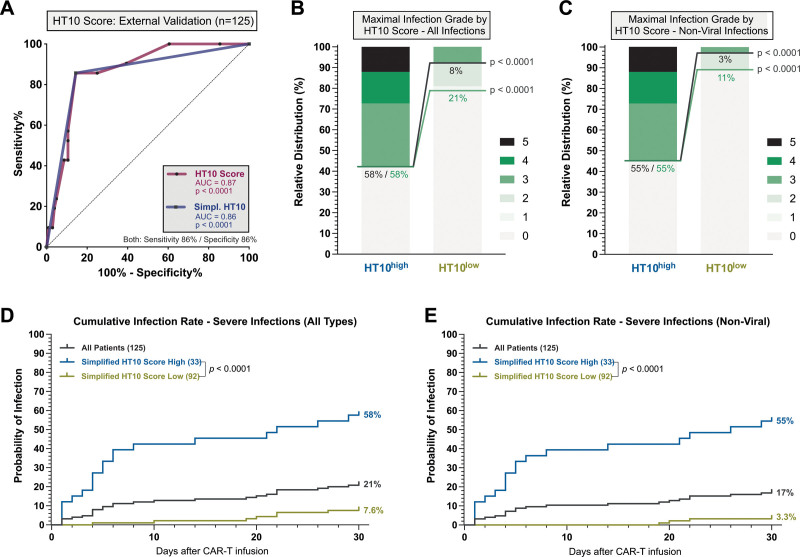
Figure 5.
External validation of the discriminatory capacity of the HT10 score at time of first fever. (A) ROC analysis studying the influence of the HT10 score (magenta) and simplified HT10 score (blue), determined at time of first fever on the binary outcome of severe infection vs CRS only during the first 30 d after CAR T-cell infusion. The respective area under the curve, P value of the ROC curve, and sensitivity/specificity are depicted. (B–C) Relative distribution of infection grades for all infection subtypes (B) and nonviral infections only (C) during the first 30 d comparing HT10 high vs low patients. Infection grades (1°–5°) are color-coded in shades of green with the connecting green and gray lines and percentage numbers comparing all-grade and grade ≥3 infections, respectively, in HT10 high vs low patients. Significance values were determined by Fisher exact test (*P < 0.05, **P < 0.01, ***P < 0.001, ****P < 0.0001). (D) Cumulative 30-d incidence on all infection types (viral, bacterial, fungal, clinical syndromes of infection) by HT10 score. (E) Cumulative 30-d incidence of only nonviral infections HT10 score. CAR = chimeric antigen receptor; CRS = cytokine release syndrome; ROC = receiver operating characteristic.

