Abstract
An important step in neural information processing is the transformation of membrane voltage into calcium signals leading to transmitter release. However, the effect of voltage to calcium transformation on neural responses to different sensory stimuli is not well understood. Here, we use in vivo two-photon imaging of genetically encoded voltage and calcium indicators, ArcLight and GCaMP6f, respectively, to measure responses in direction-selective T4 neurons of female Drosophila. Comparison between ArcLight and GCaMP6f signals reveals calcium signals to have a significantly higher direction selectivity compared with voltage signals. Using these recordings, we build a model which transforms T4 voltage responses into calcium responses. Using a cascade of thresholding, temporal filtering and a stationary nonlinearity, the model reproduces experimentally measured calcium responses across different visual stimuli. These findings provide a mechanistic underpinning of the voltage to calcium transformation and show how this processing step, in addition to synaptic mechanisms on the dendrites of T4 cells, enhances direction selectivity in the output signal of T4 neurons. Measuring the directional tuning of postsynaptic vertical system (VS)-cells with inputs from other cells blocked, we found that, indeed, it matches the one of the calcium signal in presynaptic T4 cells.
SIGNIFICANCE STATEMENT The transformation of voltage to calcium influx is an important step in the signaling cascade within a nerve cell. While this process has been intensely studied in the context of transmitter release mechanism, its consequences for information transmission and neural computation are unclear. Here, we measured both membrane voltage and cytosolic calcium levels in direction-selective cells of Drosophila in response to a large set of visual stimuli. We found direction selectivity in the calcium signal to be significantly enhanced compared with membrane voltage through a nonlinear transformation of voltage to calcium. Our findings highlight the importance of an additional step in the signaling cascade for information processing within single nerve cells.
Keywords: direction selectivity, Drosophila, imaging, nonlinear model, voltage to calcium transformation
Introduction
Neurons encode information via graded changes in membrane potential or action potential frequency. Mostly, they communicate via chemical synapses which require the release of neurotransmitters. When the presynaptic membrane is sufficiently depolarized, voltage-gated calcium channels open and allow calcium to enter the cell (Luo, 2020). Calcium entry leads to the fusion of synaptic vesicles with the membrane and the release of neurotransmitter molecules into the synaptic cleft (Chapman, 2002). As neurotransmitters diffuse across the synaptic cleft, they bind to receptors in the postsynaptic membrane, causing the postsynaptic neurons to depolarize or hyperpolarize. This way, information is passed from presynaptic to postsynaptic neurons (Di Maio, 2008). Voltage to calcium transformation, therefore, represents a crucial step in neural information processing and neural computation.
A classic example of neural computation is how Drosophila neurons compute the direction of visual motion (Borst and Helmstaedter, 2015; Yang and Clandinin, 2018; Borst et al., 2019, 2020). In Drosophila, visual information is processed in parallel ON (contrast increments) and OFF (contrast decrements) pathways (Joesch et al., 2010; Eichner et al., 2011; Strother et al., 2014). Three synapses downstream of photoreceptors, direction selectivity emerges in T4 cells of the ON pathway and in T5 cells of the OFF pathway (Maisak et al., 2013). There exist four subtypes of T4 and T5 cells (Fischbach and Dittrich, 1989; Takemura et al., 2017; Shinomiya et al., 2019), each responding selectively to one of the four cardinal directions (Maisak et al., 2013; Haag et al., 2017; Wienecke et al., 2018). The presynaptic inputs to T4 and T5 cells have been described in great detail (Behnia et al., 2014; Ammer et al., 2015; Serbe et al., 2016; Yang et al., 2016; Arenz et al., 2017; Takemura et al., 2017; Kohn et al., 2021; Gonzalez-Suarez et al., 2022; Groschner et al., 2022). Different studies provided evidence that T4 and T5 cells become selective for the direction of motion by preferred direction (PD) enhancement (Fisher et al., 2015; Salazar-Gatzimas et al., 2016; Groschner et al., 2022), by null direction (ND) suppression (Gruntman et al., 2018, 2019), and by a combination of both mechanisms (Haag et al., 2016, 2017; Leong et al., 2016).
Amazingly, right at the first stage where direction selectivity emerges, T4 and T5 cells exhibit a high degree of direction selectivity, with strong responses to preferred direction stimuli and weak or no responses to null direction stimuli. This statement is, however, based on calcium recordings (Maisak et al., 2013; Fisher et al., 2015; Haag et al., 2017; Wienecke et al., 2018). Voltage recordings show a somewhat different picture: while preferred direction stimuli also lead to large membrane depolarizations, edges or gratings moving along the null direction elicit smaller but significant depolarizing membrane responses as well (Gruntman et al., 2018, 2019; Wienecke et al., 2018; Groschner et al., 2022). This discrepancy between calcium and voltage signals hints at an additional processing step where voltage signals are transformed into calcium signals that increase the direction selectivity of the cells. In order to study this step systematically, we recorded both voltage and calcium fluorescence signals in response to a large stimulus set that includes gratings and edges moving along various directions at different speeds and contrasts. Since the calcium and voltage signals might be different in the dendrites and the axon terminals of T4-cells, we compared the directional tuning between the different compartments. Using these data, we built a model that captures the transformation from voltage to calcium by a combination of linear and nonlinear processing steps. Measuring the directional tuning in postsynaptic vertical system (VS)-cells while blocking input from other cells, we found it to match the narrow tuning of the calcium signal in presynaptic T4 cells. Therefore, we conclude that the output of T4 cells reflects the tuning of its calcium signal.
Materials and Methods
Flies
Flies (Drosophila melanogaster) were raised at 25°C and 60% humidity on a 12/12 h light/dark cycle on a standard cornmeal agar medium. Female flies 1–7 d after eclosion were used for the experiments. For calcium imaging experiments, genetically-encoded calcium indicator GCaMP6f (Chen et al., 2013) was expressed in T4c neurons with axon terminals predominantly in layer three of the lobula plate. Similarly, for voltage imaging experiments, the genetically-encoded voltage indicator (GEVI) ArcLight (Cao et al., 2013) was expressed in T4c neurons. The flies' genotypes were as follows:
T4c>GCaMP6f: w+; VT15785-Gal4AD/UAS-GCaMP6f; VT50384-Gal4DBD/UAS-GCaMP6f
T4c>ArcLight: w+; VT15785-Gal4AD/UAS-ArcLight; VT50384-Gal4DBD/+
For Mi1 and Tm3 experiments, the flies' genotypes were as follows:
Mi1>GCaMP6f: w+; R19F01-Gal4AD/UAS-GCaMP6f; R71D01-Gal4DBD/UAS-GCaMP6f
Mi1>ArcLight: w+; R19F01-Gal4AD/UAS-ArcLight; R71D01-Gal4DBD/+
Tm3>GCaMP6f: w+; R13E12-Gal4AD/UAS-GCaMP6f; R59C10-Gal4DBD/UAS-GCaMP6f
Tm3>ArcLight: w+; R13E12-Gal4AD/UAS-ArcLight; R59C10-Gal4DBD/+
For VS recordings, the flies' genotypes were as follows:
T4c/T5c>TNT: w-/w+; VT50384-lexA/13xlexAop-IVS-TNT:HA
For the whole-brain image (Fig. 1A), brains were dissected in PBS and then fixed in 4% paraformaldehyde (PFA; in PBS with 0.1% Triton X-100). Afterwards, brains were washed three times in PBT (PBS + 0.3% Triton X-100), blocked in 10% normal goat serum (NGS; in PBT) and then incubated with the primary antibody (antibody in 5% NGS in PBT) for 2 d. Next, brains were washed in PBT overnight and then incubated with the secondary antibody for 2–3 d. Brains were then washed in PBT overnight, briefly rinsed with PBS and mounted in Vectashield (VectorLabs). Primary antibodies were used at dilutions of 1:25 (anti-nc82) or 1:1000 (anti-GFP). All secondary antibodies were used at a dilution of 1:500. Confocal images were acquired with a Leica SP8 confocal microscope at a resolution of 1024 × 1024 pixels. We used 488 nm and 633 nm lasers and HyD detectors and a Leica 63× glycerol objective. Image processing was performed with ImageJ/Fiji.
Figure 1.
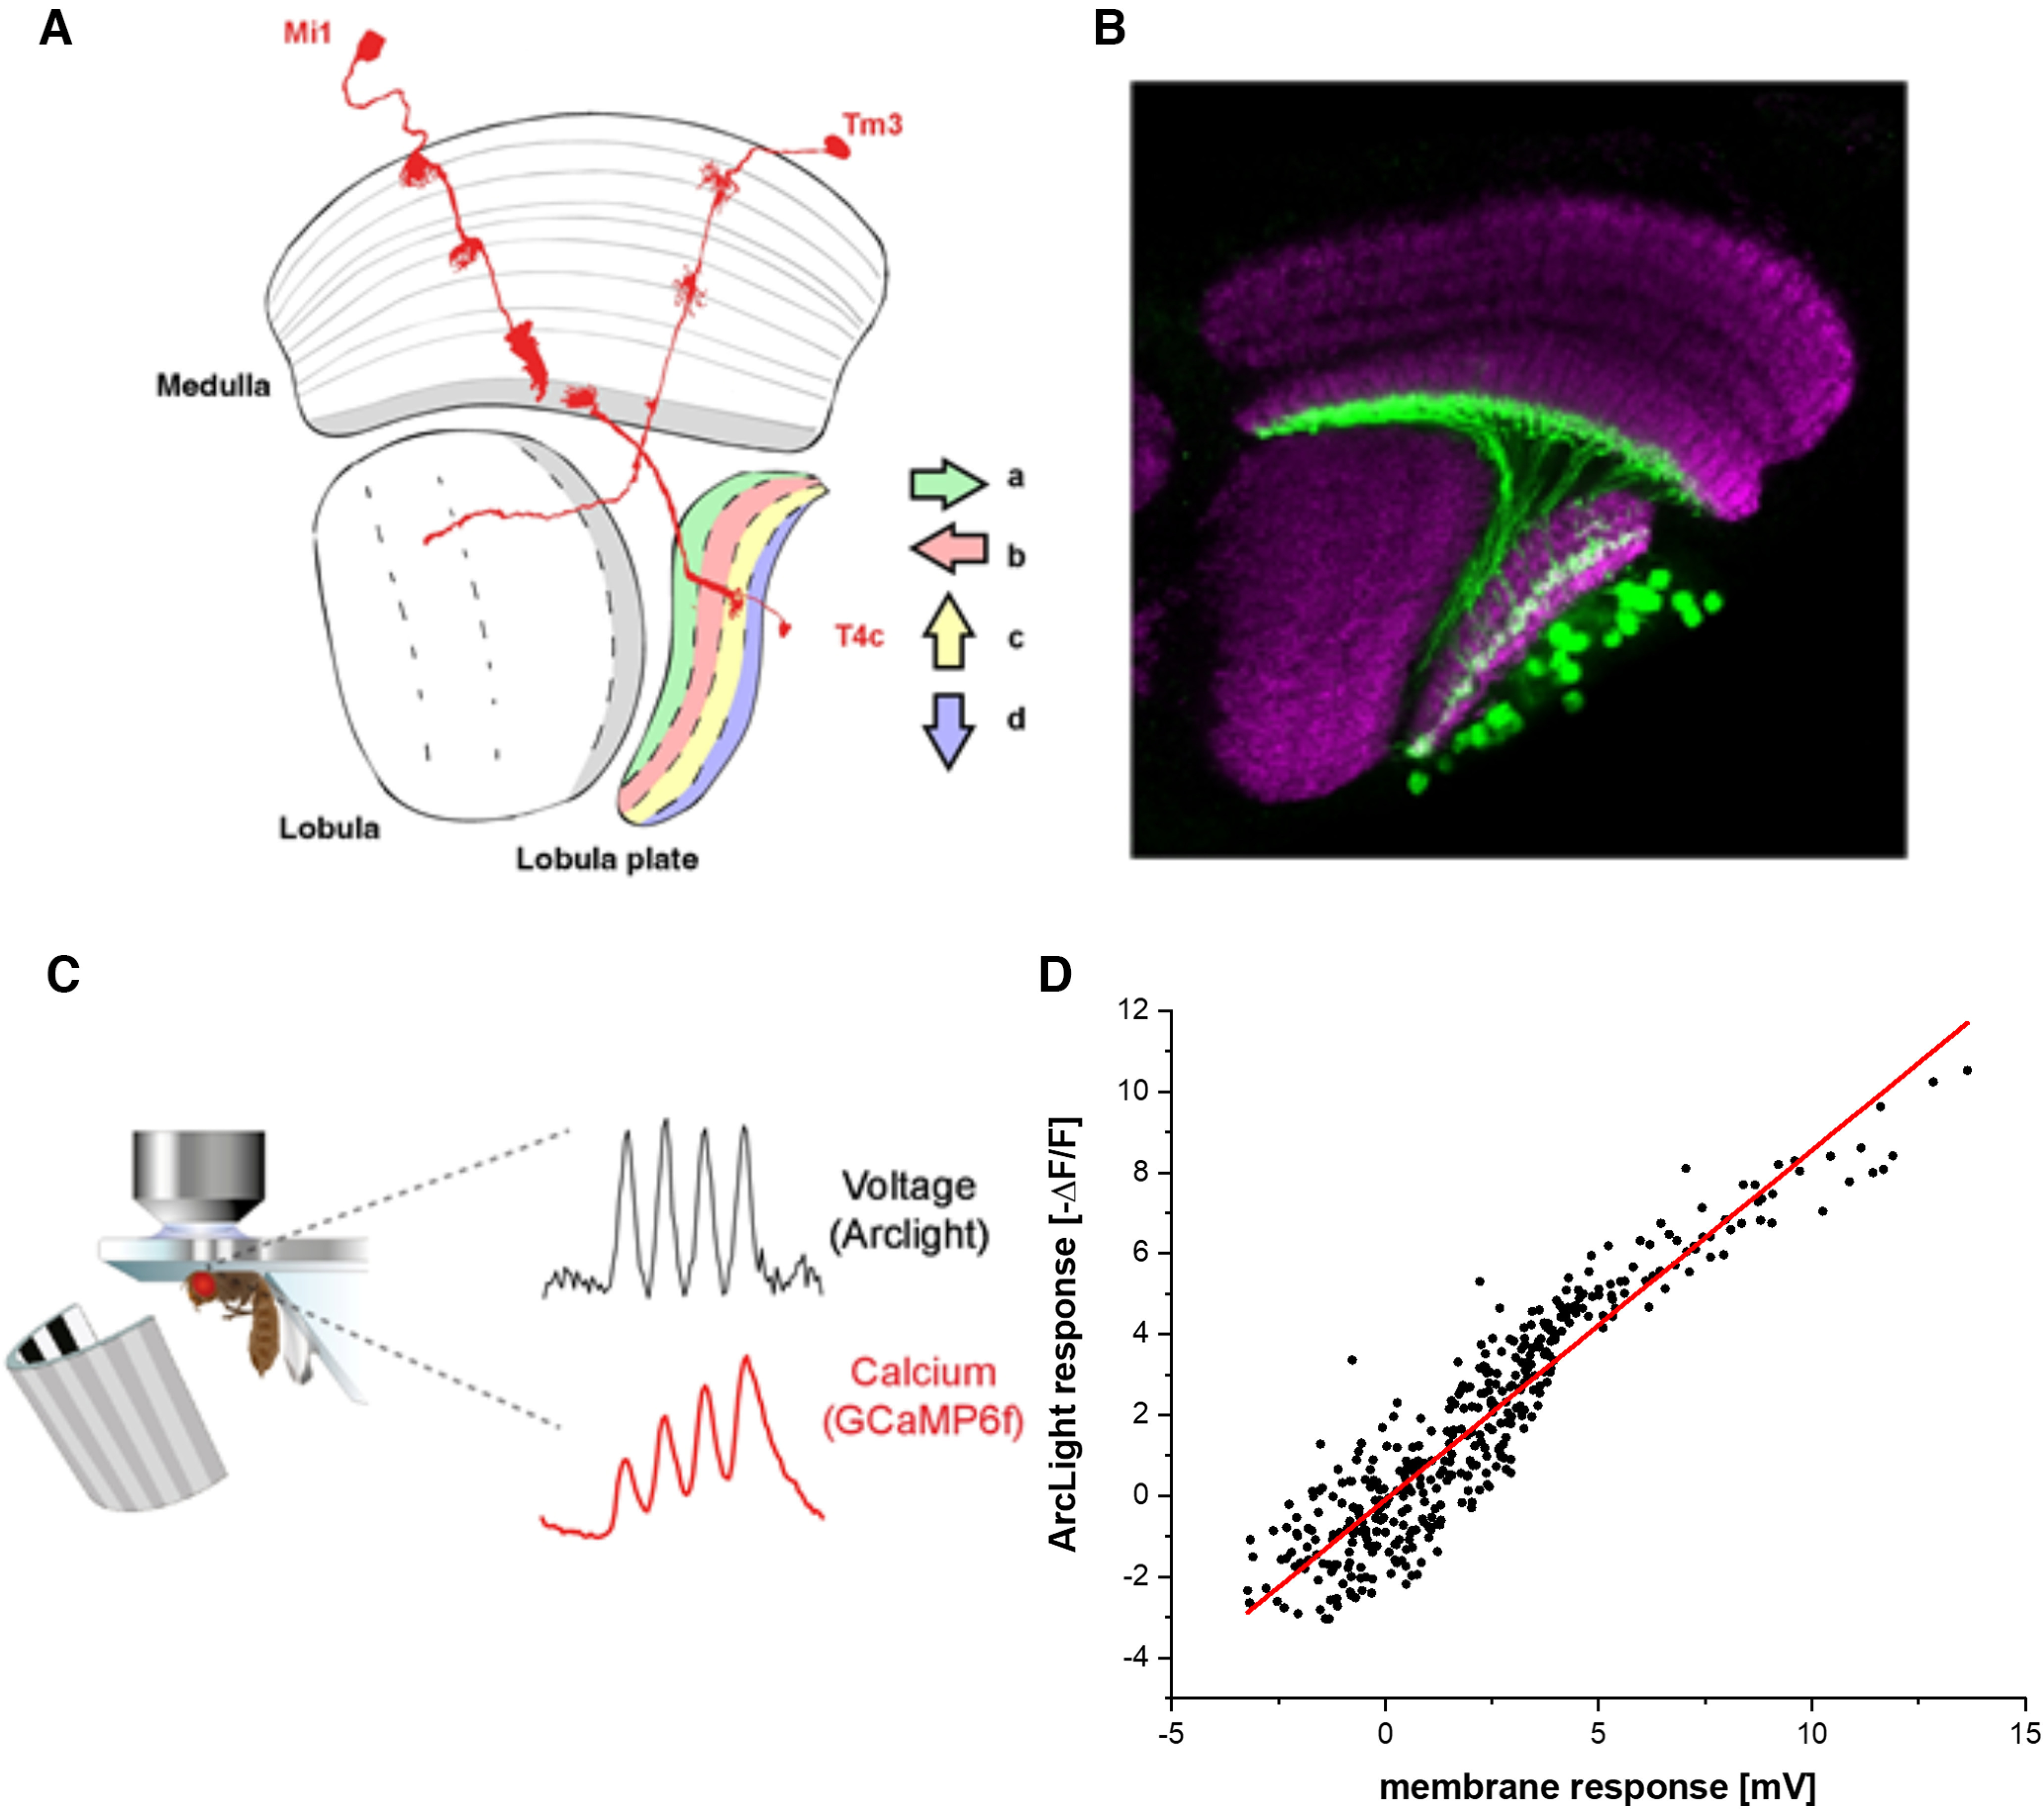
Schematic setup. A, Schematic illustration of the optic lobe, together with the reconstruction of the three neuron types Mi1, Tm3, and T4c investigated. B, Optic lobe with T4c neurons labeled with GCaMP6f (green) and nc82 (magenta). C, Experimental setup: fly tethered to a plastic holder under the two-photon microscope looking onto the stimulus arena. D, Comparison of the optically recorded ArcLight fluorescence change in T4 cells with the membrane potential as recorded by whole-cell patch from T4 cells (Groschner et al., 2022) elicited by identical visual stimuli.
Calcium and voltage imaging
For imaging experiments, fly surgeries were performed as previously described (Maisak et al., 2013). Briefly, flies were anesthetized with CO2 or on ice, fixed with their backs, legs and wings to a Plexiglas holder with the back of the head exposed to a recording chamber filled with a fly external solution. The cuticula at the back of the head on one side of the brain was cut away with a fine hypodermic needle and removed together with air sacks covering the underlying optic lobe. The neuronal activity was then measured from the optic lobe with a custom-built two-photon microscope as previously described (Maisak et al., 2013). Images were acquired at 64 × 64 pixels resolution and frame rate of 13 Hz with the Scanimage software in MATLAB (Pologruto et al., 2003).
Electrophysiology
Patch-clamp recordings from vertical system (VS) tangential cells were performed as previously described in Ammer et al., 2015. Briefly, the brain of the fly was visualized with an upright microscope (Axiotech Vario 100, Zeiss) equipped with a 40× water-immersion objective (LumPlanFL, NA 0.8, Olympus), a Hg-light source (HXP-120, Visitron Systems) and polarization filters for contrast enhancement. A glass electrode filled with collagenase (Collagenase IV, Invitrogen, 0.5 mg ml in extracellular saline) was used to expose the somata of LPTCs. Somata of VS-cells were patched with a glass electrode (5– 9 MΩ) filled with internal solution (140 mm potassium aspartate, 10 mm HEPES, 4 mm MgATP, 0.5 mm Na-GTP, 1 mm EGTA, 1 mm KCl, and 0.03 mm Alexa 568–hydrazide sodium, pH 7.26, 265 mOsm). Recordings were performed with an NPI BA-1S amplifier (NPI Electronics) in current-clamp bridge mode, low-pass filtered with a cutoff frequency at 3 kHz and digitized at 10 kHz.
Visual stimulation
For the study of visual responses of T4c cells, visual stimuli were presented on a custom-built projector-based arena as described in Arenz et al., 2017. Two micro-projectors (TI DLP Lightcrafter 3000) were used to project stimuli onto the back of an opaque cylindrical screen covering 180° in azimuth and 105° in elevation of the fly's visual field. To increase the refresh rate from 60 to 180 Hz (at eight-bit color depth), projectors were programmed to use only green LED (OSRAM L CG H9RN) which emits light between 500- and 600-nm wavelength. Two long-pass filters (Thorlabs FEL0550 and FGL550) were placed in front of each projector to restrict the stimulus light to wavelengths above 550 nm. This prevents overlap between fluorescence signal and arena light spectra. To allow only the fluorescence emission spectrum to be detected, a bandpass filter (Brightline 520/35) was placed in front of the photomultiplier. Stimuli were rendered using custom-written software in Python 2.7.
Stimuli
Stimuli were presented with three to five repetitions per experiment randomly. To measure the directional and speed tuning, square-wave gratings with a spatial wavelength of 30° spanning the full extent of the stimulus arena were used. The gratings were moved along 12 different directions from 0° to 360° at four different speeds (15°/s, 30°/s, 60°/s,120°/s). Similarly, to measure direction and contrast tuning, square-wave gratings with a spatial wavelength of 30° spanning the full extent of the stimulus arena were used. The gratings moved at a speed of 30°/s in 12 different directions at four different contrasts (10%, 20%, 50%, 100%). For different contrasts, the brightness of the bright bar was decreased and the brightness of the dark bar was increased. Edge responses were measured using ON edges, i.e., bright edges moving on a dark background with full contrast. The ON edge moved along the preferred direction (upward) or null direction (downward) at four different speeds (15°/s, 30°/s, 60°/s, 120°/s). Similarly to gratings, edges moved at a speed of 30°/s in preferred direction (upward) or null direction at four different contrasts (10%, 20%, 50%, 100%).
Data analysis
Data analysis was performed using custom-written routines in MATLAB and Python 2.7, 3.7. Images were automatically registered using horizontal and vertical translations to correct the movement of the brain. Fluorescence changes ΔF/F were then calculated using a standard baseline algorithm (Jia et al., 2011). Regions of interest (ROIs) were drawn on the average raw image manually in the medulla layer M10 for signals from T4 dendrites. Averaging the fluorescence change over this ROI in space resulted in a ΔF/F time course. Voltage imaging with ArcLight and calcium imaging with GCaMP6f were performed and analyzed using the same settings.
As the ArcLight and GCaMP6f responses were recorded from cells in different flies with different receptive fields and therefore different phase relations, the responses had to be aligned before averaging in the time domain. To do so, we calculated the cross-correlation between the responses of different flies and shifted the responses accordingly.
The direction selectivity was evaluated using a direction selectivity index (DSI) calculated as the difference between the peak responses to preferred and null directions, divided by the sum of the absolute values of the peak responses:
| (1) |
In the above measurement, only the difference in response between the two opposing directions of motion is quantified. To take into account all 12 directions of motion, we calculated the directional tuning index:
| (2) |
where is a vector proportionally scaled with the peak response and points in the direction corresponding to the direction of motion given by the rotation angle ϕ of the stimulus (Mazurek et al., 2014). For two angles separated by 180°, the Ldir is equivalent to the DSI.
The calculation of the circular variance was done with the circular statistics toolbox for MATLAB (Berens, 2009).
Note, all calculations (Peak ΔF/F, DSI, LDir) were performed on the signals from individual ROIs and then averaged.
Model simulations
Custom-written Python3.7 scripts were used to simulate the models (Fig. 5). To calculate the optimal parameter values, we first defined an error function. For each stimulus condition (si), the error was calculated as
| (3) |
Figure 5.
Models for voltage to calcium transformation. A, Rectilinear model consisting of High-Pass filter (HP), threshold (trld), Low-Pass filter (LP), gain, and shift. B, Recti-nonlinear model. The recti-nonlinear model consists of the same components than the rectilinear model with an additional power nonlinearity.
The model took as input the time averaged ArcLight data across all 112 different stimuli conditions. Next, we summed the error for all stimuli conditions:
| (4) |
The model parameters were initialized with random values within the defined parameter bounds. The Python SciPy minimize function then used the L-BFGS-B (Limited Broyden Fletcher Goldfarb Shanno) algorithm to find the parameter values corresponding to the minimum total error. A total of 300 runs were performed, and the parameter values corresponding to the run with the lowest error were used to produce the final output signals. To compare the model performances with the time averaged GCaMP data, we calculated the model error as:
| (5) |
Results
We expressed the genetically encoded calcium indicator GCaMP6f (Chen et al., 2013) in T4c cells projecting to layer three of the lobula plate (Fig. 1A,B). These cells have upward motion as their preferred direction (PD) and downward motion as their null direction (ND). We also expressed the genetically encoded voltage indicator ArcLight (Jin et al., 2012) using the same driver line. ArcLight's fluorescence decreases with membrane depolarization and increases with membrane hyperpolarization (Cao et al., 2013). To compare voltage and calcium signals, we recorded the activity in T4c cells dendrites in medulla layer 10 in response to the same set of stimuli using two-photon microscopy (Fig. 1C; Denk et al., 1990). The complete stimuli set included square-wave gratings of 30° spatial wavelength moving along 12 different directions, and ON edges moving in PD and ND, at four different speeds (15°/s, 30°/s, 60°/s, 120°/s) and four different contrasts (10%, 20%, 50%, 100%). In order to test how well ArcLight reflects the membrane potential, we compared the measured fluorescence changes in T4c cells to gratings moving at 30°/s in 8 different directions to membrane potential recordings (Fig. 1D; electrophysiology data from Groschner et al., 2022) to the same set of stimuli. The fluorescence change of ArcLight is shown (black dots) for every time point as a function of the membrane response. The fluorescence change depends in an almost linear way (red line) on the membrane potential change (slope 0.86, Pearson's R = 0.93).
In the first set of experiments, we measured voltage and calcium signals in response to gratings moving in PD and ND at four different speeds (Fig. 2A). As the grating stimuli consist of alternate bright and dark bars moving in a certain direction, there was a modulation at the same frequency as the contrast frequency of the grating (Egelhaaf and Borst, 1989; Single and Borst, 1998; Haag et al., 2004; Wienecke et al., 2018) in the ArcLight (black traces) and GCaMP6f (red traces) signals. GCaMP6f responses showed modulations only for slower speeds, while ArcLight responses revealed modulations also at higher speeds. In addition, the response amplitudes were much higher for GCaMP6f (≈2.0 ΔF/F) compared with ArcLight (≈−0.06 ΔF/F). The peak responses (maximum ΔF/F) decreased with increasing stimulus speed both for GCaMP6f and ArcLight signals (Fig. 2B). To understand how the voltage to calcium transformation affects direction selectivity in T4 cells, we compared the responses to gratings moving in PD and ND. GCaMP6f responses in ND were negligible compared with its responses in PD, while for ArcLight responses in ND were relatively high (Fig. 2A,C). We quantified the direction selectivity of the calcium and voltage responses by a direction selectivity index (DS-index) calculated as the difference between the peak responses to preferred and null directions, divided by the sum of the absolute values of the peak responses (Materials and Methods, Eq. 1). The results revealed a high degree of direction selectivity of ≈0.8 for GCaMP6f at slower velocities, compared with a direction selectivity of ≈0.4 for ArcLight (Fig. 2E). For both GCaMP6f and ArcLight signals, direction selectivity decreased with increasing velocity.
Figure 2.
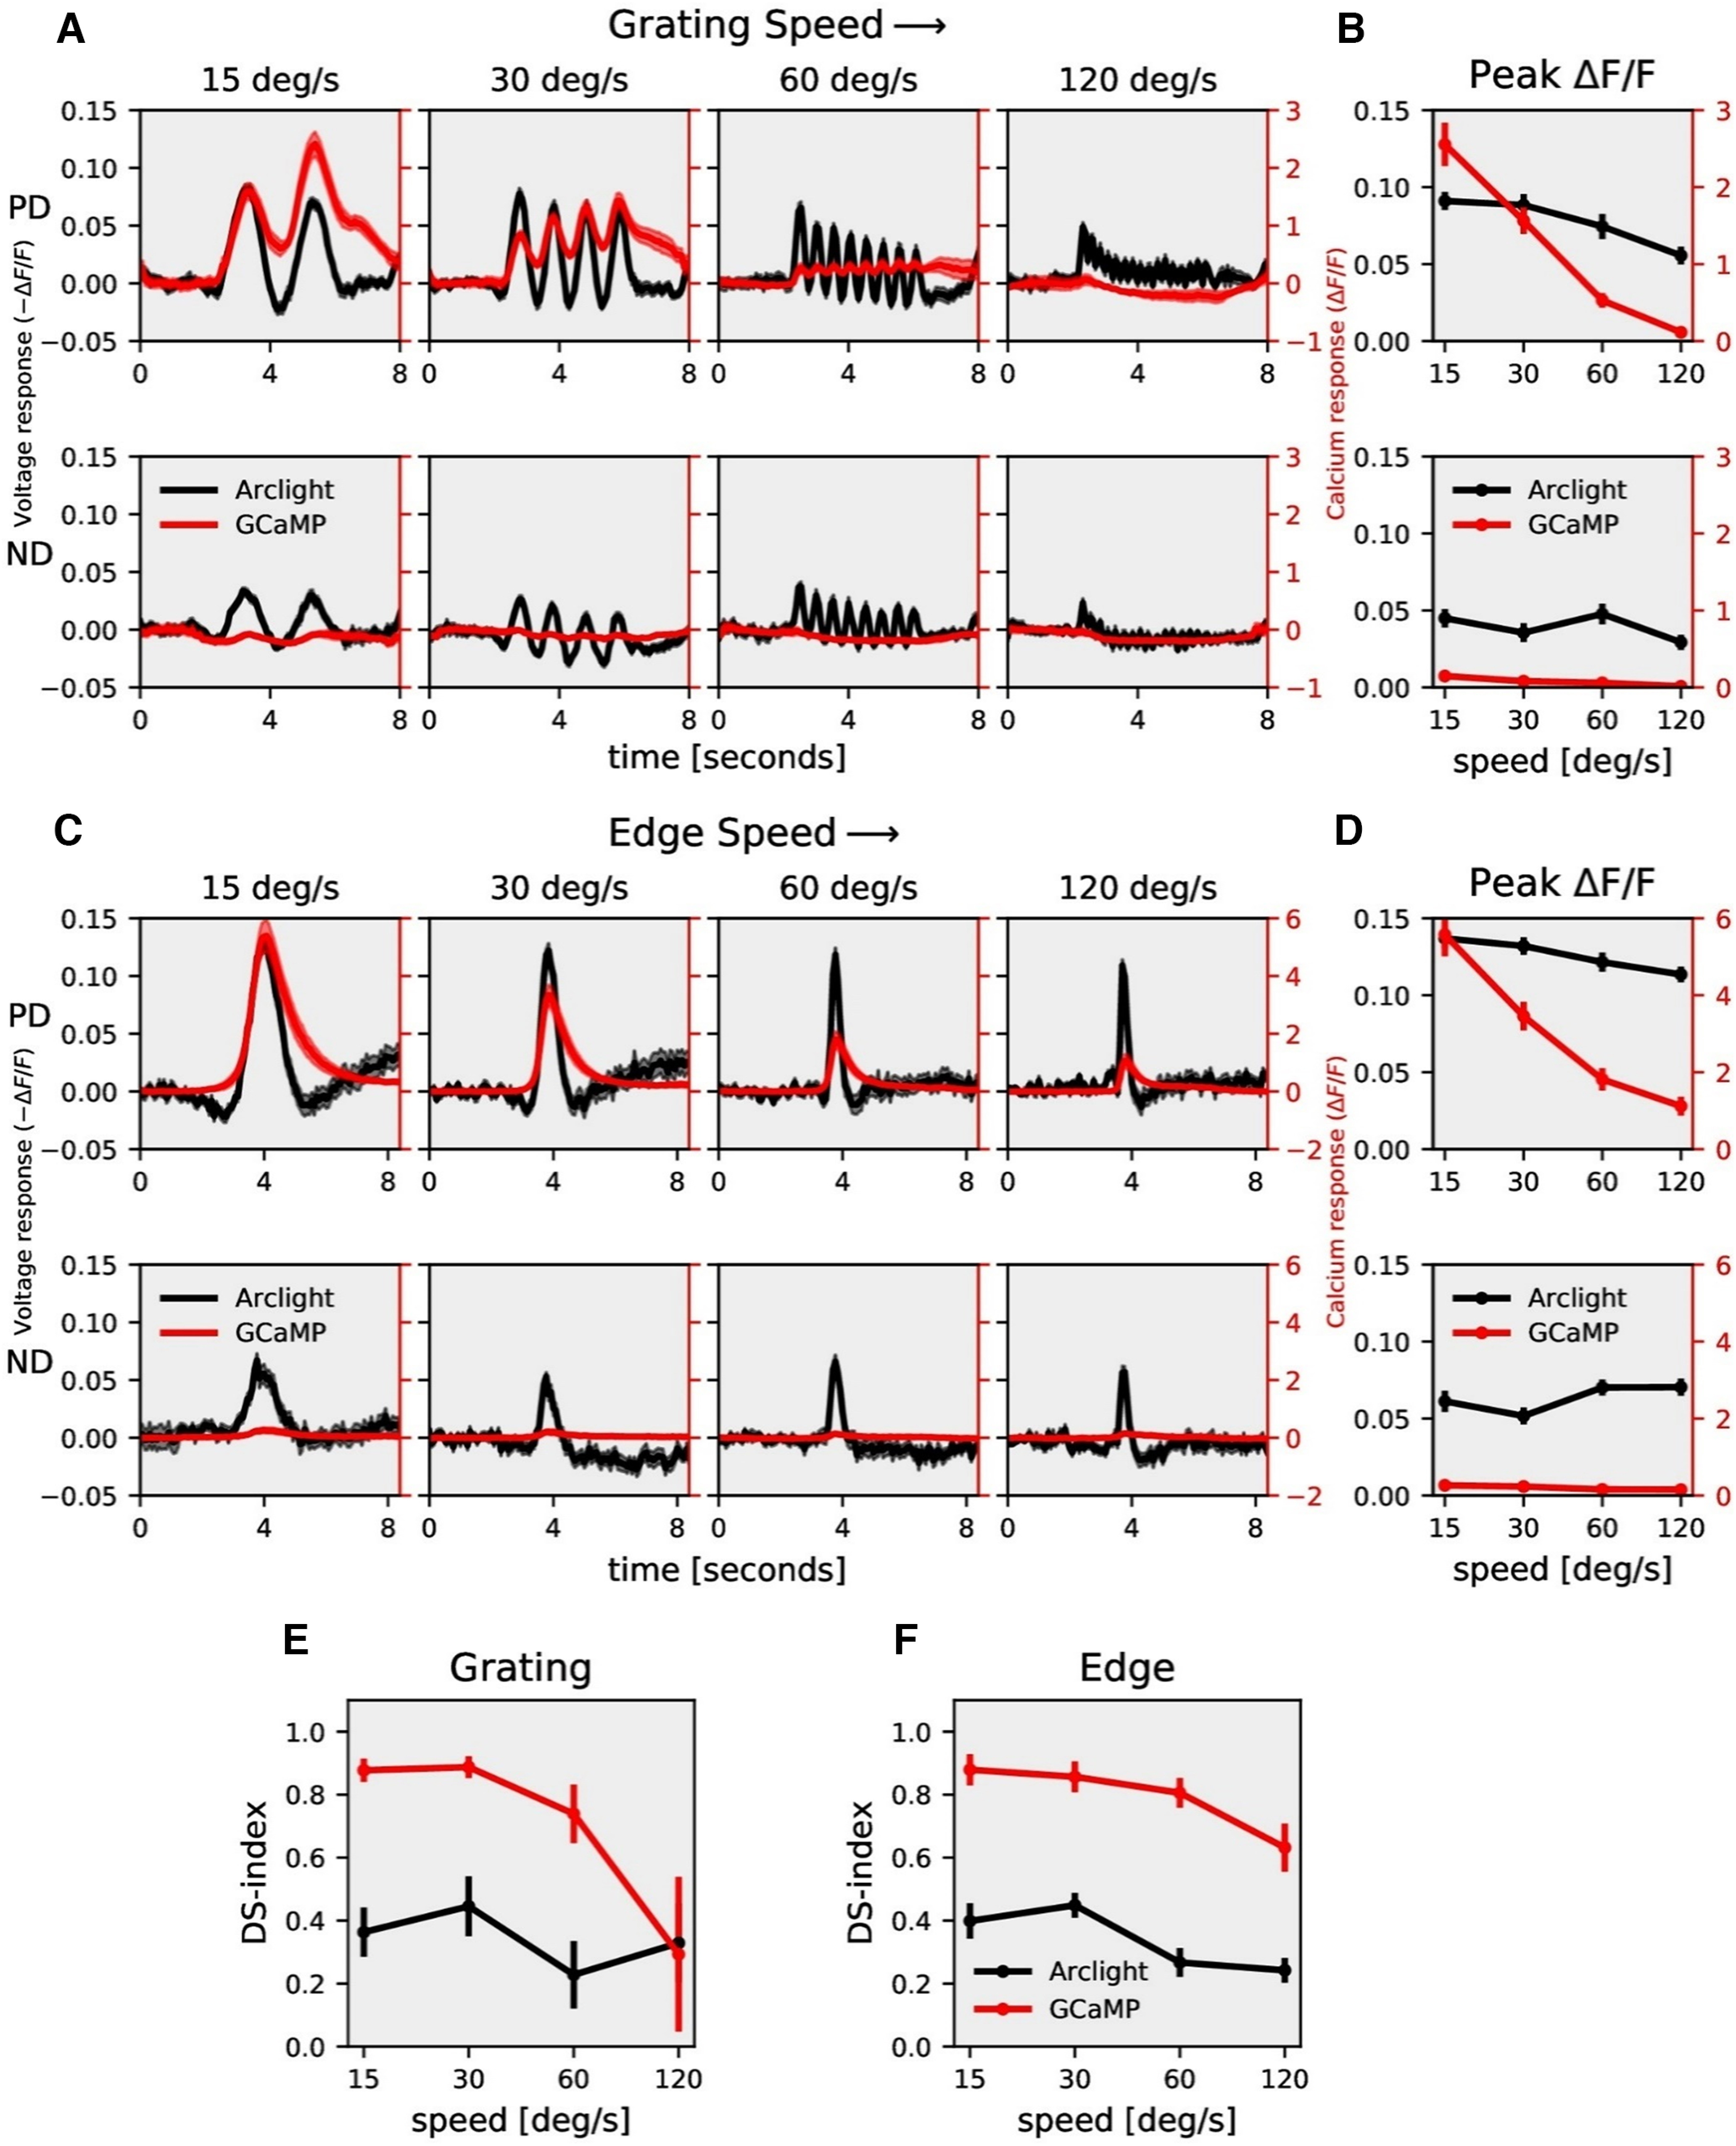
T4c speed dependence. A, T4c ArcLight (black) and GCaMP6f (red) responses to grating moving in PD (top row) and ND (bottom row) at four different speeds. The plots have a twin y-axis. The left y-axis of the plot represents voltage responses, i.e., changes in ArcLight fluorescence (−ΔF/F) and the right y-axis of the plot represents calcium responses, i.e., changes in GCaMP6f fluorescence (ΔF/F). B, T4c peak responses to grating moving in PD (top) and ND (bottom) at four different speeds (n = 22 ROIs from N = 9 flies for ArcLight, n = 12, N = 8 for GCaMP6f). C, T4c ArcLight (black) and GCaMP6f (red) responses to ON-edge moving in PD (top row) and ND (bottom row) at four different speeds. D, T4c peak responses to ON-edge moving in PD and ND at four different speeds (n = 21, N = 9 for ArcLight, n = 12, N = 4 for GCaMP6f). E, Direction selectivity index (DS-index) calculated as the difference of peak responses in PD and ND divided by the sum of peak responses for grating. F, Direction selectivity index (DSI) for ON-edge. All data show the mean ± SEM PD: preferred direction, ND: null direction.
Next, instead of gratings, we used moving bright edges with all other stimulus parameters remaining the same (Fig. 2C). As the edge moves upward on the screen, it crosses the receptive field of T4c neurons only once. Hence, there was only a single peak in the response. The peak response decreased with increasing stimulus speed for GCaMP6f, while the peak response remained almost constant for ArcLight throughout all speeds (Fig. 2D). When comparing responses to edges moving along preferred and null directions, GCaMP6f showed negligible responses to the null direction while ArcLight revealed considerable responses to null direction stimuli. The direction selectivity index was again much higher for GCaMP6f compared with ArcLight (Fig. 2F). Together, these results show that GCaMP6f signals have a high level of direction selectivity compared with ArcLight signals, both for grating and edge stimuli.
The stimulus strength was further varied by changing the contrast between bright and dark bars for gratings and between moving edges and background for edge stimuli. We measured ArcLight and GCaMP6f responses to gratings moving at 30°/s at four different contrasts (Fig. 3A). Increasing contrast resulted in an increase in response for both ArcLight and GCaMP6f. GCaMP6f signals were modulated at the temporal frequency of the grating but showed an additional rise over time. This slow increase was not observed in ArcLight signals. We also measured ArcLight and GCaMP6f responses to ON edges, all moving at the same speed of 30°/s but having different contrasts (Fig. 3C). The peak response (maximum ΔF/F) increased with increasing contrast (Fig. 3D). Similar to previous experiments, the direction selectivity index was much higher for GCaMP6f (≈0.9) compared with that for ArcLight (≈0.4; Fig. 3E,F).
Figure 3.
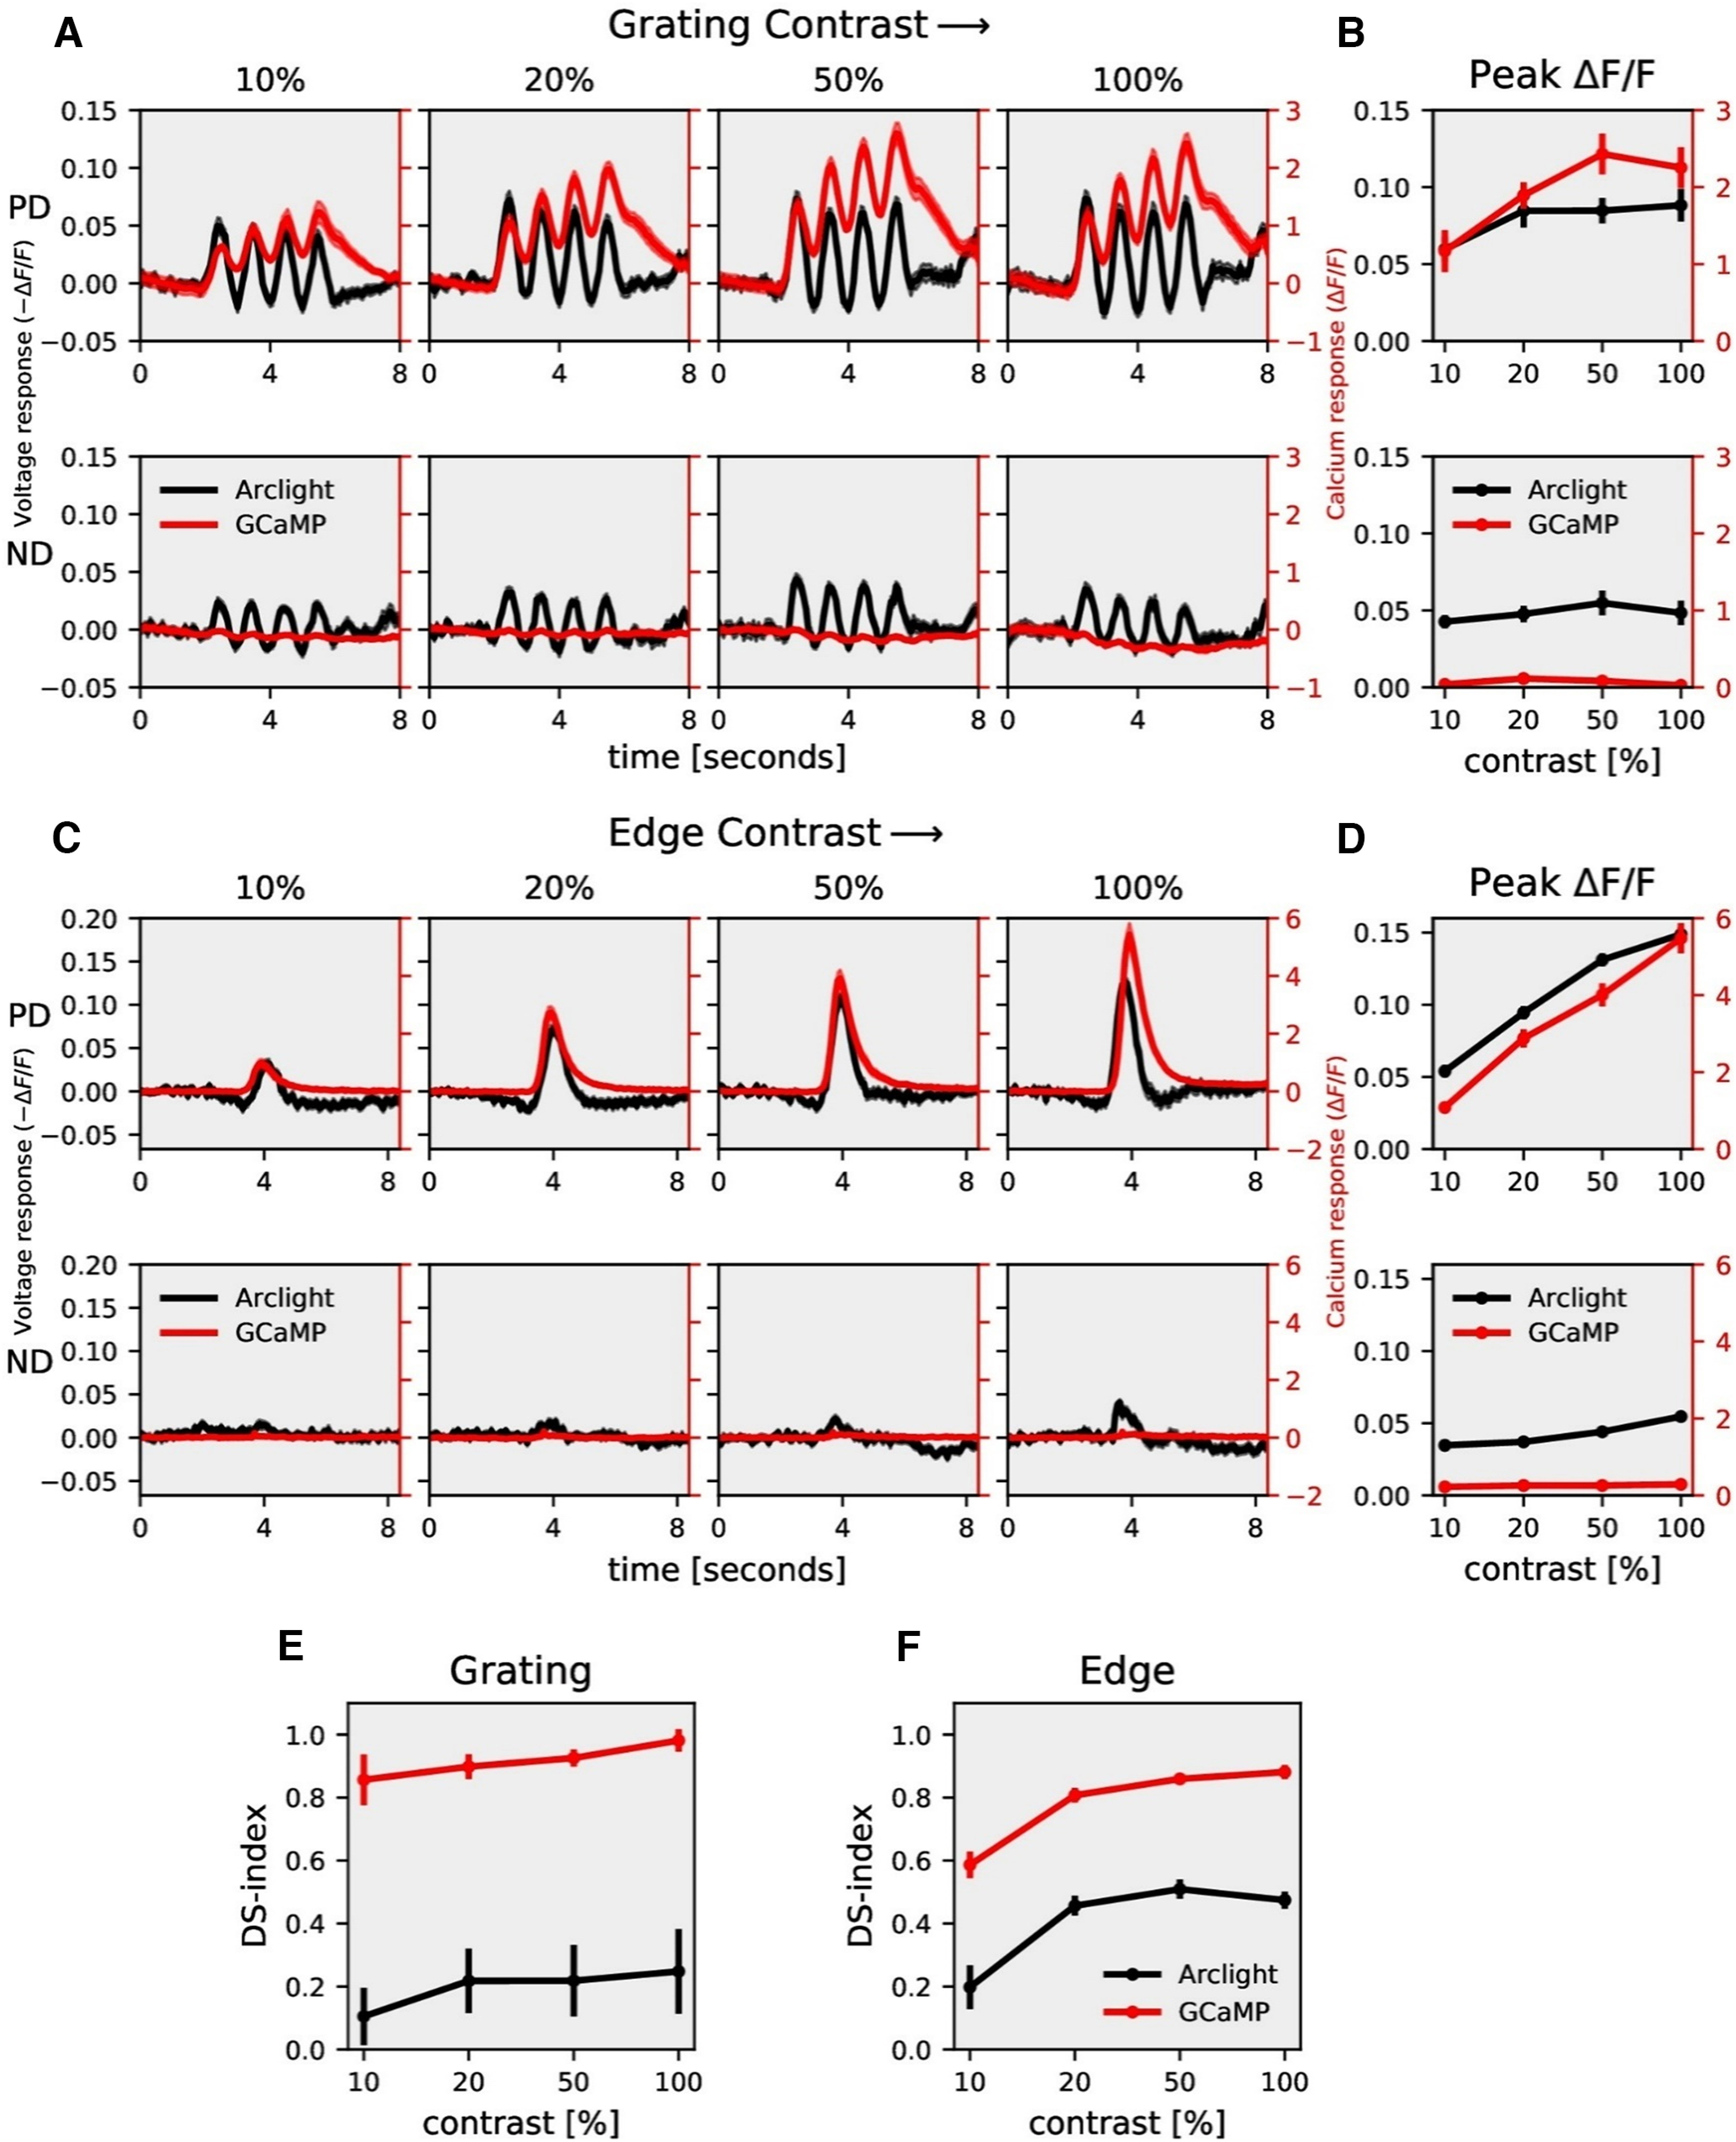
T4c contrast dependence. A, T4c ArcLight (black) and GCaMP6f (red) responses to grating moving in PD (top row) and ND (bottom row) at four different contrasts. The left y-axis of the plot represents voltage responses, i.e., changes in ArcLight fluorescence (−ΔF/F) and the right y-axis of the plot represents calcium responses, i.e., changes in GCaMP6f fluorescence (ΔF/F). B, T4c peak responses to grating moving in PD (top) and ND (bottom) at four different contrasts (n = 17 ROIs from N = 10 flies for ArcLight, n = 15, N = 7 for GCaMP6f). C, T4c ArcLight (black) and GCaMP6f (red) responses to ON-edge moving in PD (top row) and ND (bottom row) at four different contrasts. D, T4c peak responses to ON-edge moving in PD and ND at four different contrasts (n = 36, N = 5 for ArcLight, n = 29, N = 5 for GCaMP6f). E, Direction selectivity index (DSI) calculated as the difference of peak responses in PD and ND divided by the sum of peak responses for grating. F, Direction selectivity index (DSI) for ON-edge. All data show the mean ± SEM.
In the results presented so far, we compared responses for two directions only, i.e., along the preferred (upward) and along the null direction (downward). Since the direction selectivity index becomes rather unselective when PD and ND responses are close to zero, we next extended the comparison to motion along 12 directions, from 0° to 360° in steps of 30°. For this comparison, we determined the normalized peak responses of ArcLight and GCaMP6f signals to gratings moving at four different speeds and four different contrasts, respectively (Fig. 4A,B). The directional tuning was much sharper for GCaMP6f compared with ArcLight. To quantify this, we calculated the directional tuning index Ldir (Mazurek et al., 2014) for each speed and each contrast as the magnitude of the vector sum of the peak responses divided by the sum of all individual vector magnitudes (Materials and Methods, Eq. 2). In general, the directional tuning indices again were much higher for GCaMP6f (≅0.6) compared with that of ArcLight (≅0.2; Fig. 4C,D). Together, these results show that calcium signals have a higher degree of directional tuning across different speeds and contrasts than voltage responses, arguing for a nonlinear transformation from voltage to calcium.
Figure 4.
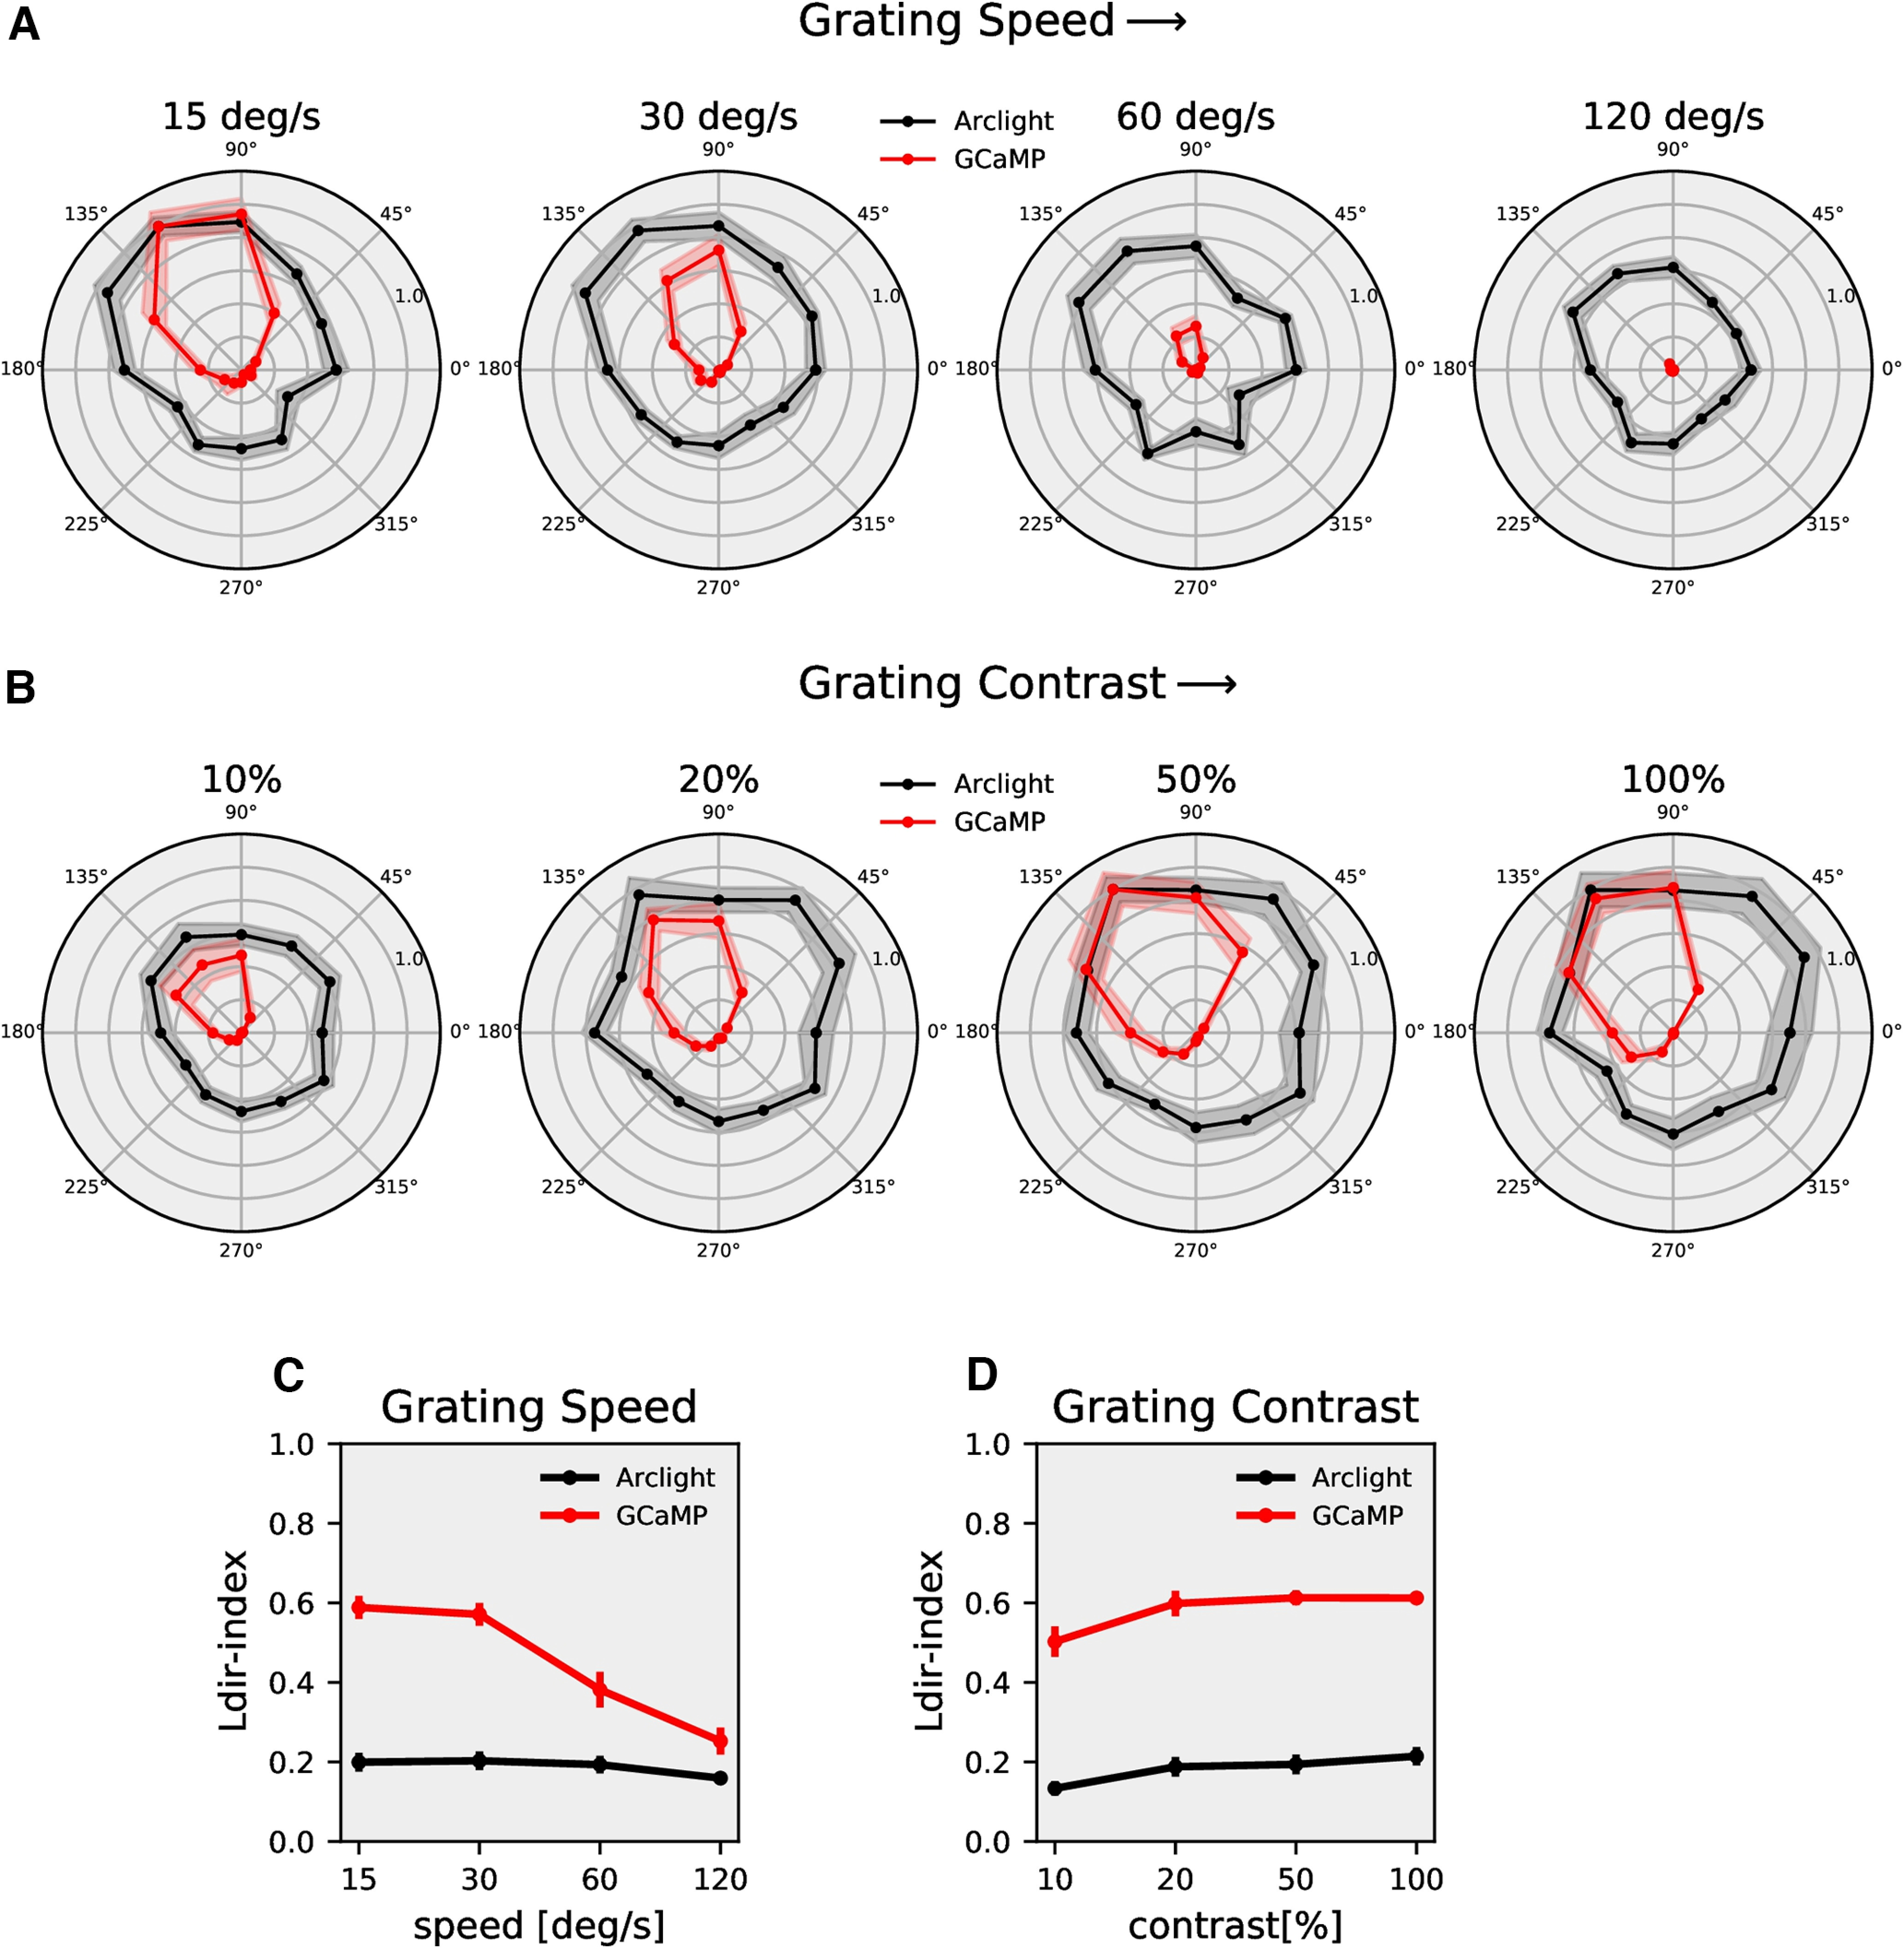
T4c directional tuning. A, T4c ArcLight (black) and GCaMP6f (red) normalized peak responses to grating moving in 12 directions at four different speeds (n = 22 ROIs from N = 9 flies for ArcLight, n = 26, N = 8 for GCaMP6f). B, T4c ArcLight (black) and GCaMP6f (red) normalized peak responses to grating moving in 12 directions at four different contrasts (n = 17, N = 10 for ArcLight, n = 15, N = 7 for GCaMP6f). C, The directional tuning index Ldir for grating moving at four different speeds. The directional tuning index is calculated as the vector sum of the peak responses divided by the sum of all individual vector magnitudes. D, The directional tuning index for grating at four different contrasts. All data show the mean ± SEM.
How does the voltage to calcium transformation lead to calcium signals with significantly higher directional tuning compared with voltage signals? To address this question, we constructed an algorithmic model (Fig. 5), which takes ArcLight signals as inputs and outputs GCaMP signals. In order to find the optimal parameter values, we first defined an error function. For each stimulus condition, the error was calculated as the sum of the squared difference between the model and the experimental data at each time point (Materials and Methods, Eq. 3). There was a total of 112 stimulus conditions: grating speed (four speeds, 12 directions), grating contrast (four contrasts, 12 directions), edge speed (four speeds, PD and ND), and edge contrast (four contrasts, PD and ND). The total error amounted to the sum of all errors across all stimulus conditions (Materials and Methods, Eq. 4). We defined the model error as the total error divided by the power of the data (Materials and Methods, Eq. 5). We then found the optimal parameter values of the model that correspond to the minimum total error using the Python SciPy minimize function (Virtanen et al., 2020). To avoid the risk of being trapped in a local minimum, we ran the parameter search 300 times with random starting parameters and chose the parameter set which resulted in the smallest error.
We started with a rectilinear model (Fig. 5A). The model first passes the ArcLight signal through a high-pass filter which removes slow fluctuations. This is followed by a threshold, assuming that the voltage changes below a certain threshold do not affect the calcium level in the cell (Yang et al., 2016). In addition, we further considered a few experimental observations for constructing the model. First, the GCaMP6f response to gratings showed modulations only for slower speeds, whereas the ArcLight response had modulations even at faster speeds (Fig. 2A). This suggests that the GCaMP6f signal is a low-pass filtered version of the ArcLight signal. In the rectilinear model, we used a single low-pass filter followed by a gain and time shift. Multiplication with a gain factor was required since GCaMP6f signals have a much higher magnitude compared with ArcLight. Since ArcLight and GCaMP6f responses were recorded from cells in different flies with different receptive fields, the responses had different phases. Therefore, a time shift was necessary to align the signals. However, the rectilinear model with a single low-pass filter could not reproduce responses across all stimuli. The model error for the complete data set for the rectilinear model was around 39% (see Table 1 for list of parameters). Specifically, the rectilinear model failed to suppress the ND responses and to reproduce the edge responses. The directional tuning index Ldir was much smaller for the rectilinear model compared with the experimental data (Fig. 6E,F, blue lines). Second, the GCaMP6f responses in addition to modulation also had a steady rise over time whereas the ArcLight signal only had modulations (Figs. 2A, 3A). To quantify this rise, we calculated the modulation ratio of the peak amplitude of the last modulation divided by the peak amplitude of the first modulation for gratings moving at 15°/s. For the ArcLight signal the modulation ratio was 0.86 ± 0.04, for the GCaMP signal the modulation ratio was 1.69 ± 0.21. In order to reproduce the edge responses and modulation in grating responses, the model needed a low-pass filter with a small time constant. However, to simulate the steady rise in the grating signal, a low-pass filter with a large time constant was necessary. Hence, we combined the output of two low-pass filters. Summing up the low-pass filter outputs did not lead to much improvement. However, multiplying the outputs of the low-pass filters led to a significant decrease in the error. The model error dropped from 39% for the rectilinear model to 23% for the multiplicative model. Counterintuitively, optimizing parameters reliably found the time constant of the two low-pass filters to be identical. We therefore changed our model to a single low pass filter followed by a power nonlinearity (Fig. 5B).
Table 1.
Parameter for the models
| Cell | Threshold (%) | τ HP (s) | τ-LP (s) | Exponent | Gain | Error (%) |
|---|---|---|---|---|---|---|
| Mi1 | ||||||
| Rectilinear model | −0.68 | 1.96 | 0.39 | 32.09 | 8.99 | |
| Recti-nonlinear model | −0.22 | 2.26 | 0.41 | 1.28 | 20.27 | 8.65 |
| Tm3 | ||||||
| Rectilinear model | −0.60 | 0.67 | 0.79 | 77.17 | 6.79 | |
| Recti-nonlinear model | −0.34 | 0.56 | 1.03 | 1.48 | 58.57 | 4.92 |
| T4c complete | ||||||
| Rectilinear model | −1.15 | 0.33 | 3.91 | 347.30 | 39.48 | |
| Recti-nonlinear model | −0.34 | 0.45 | 2.41 | 2.53 | 297.67 | 21.59 |
Figure 6.
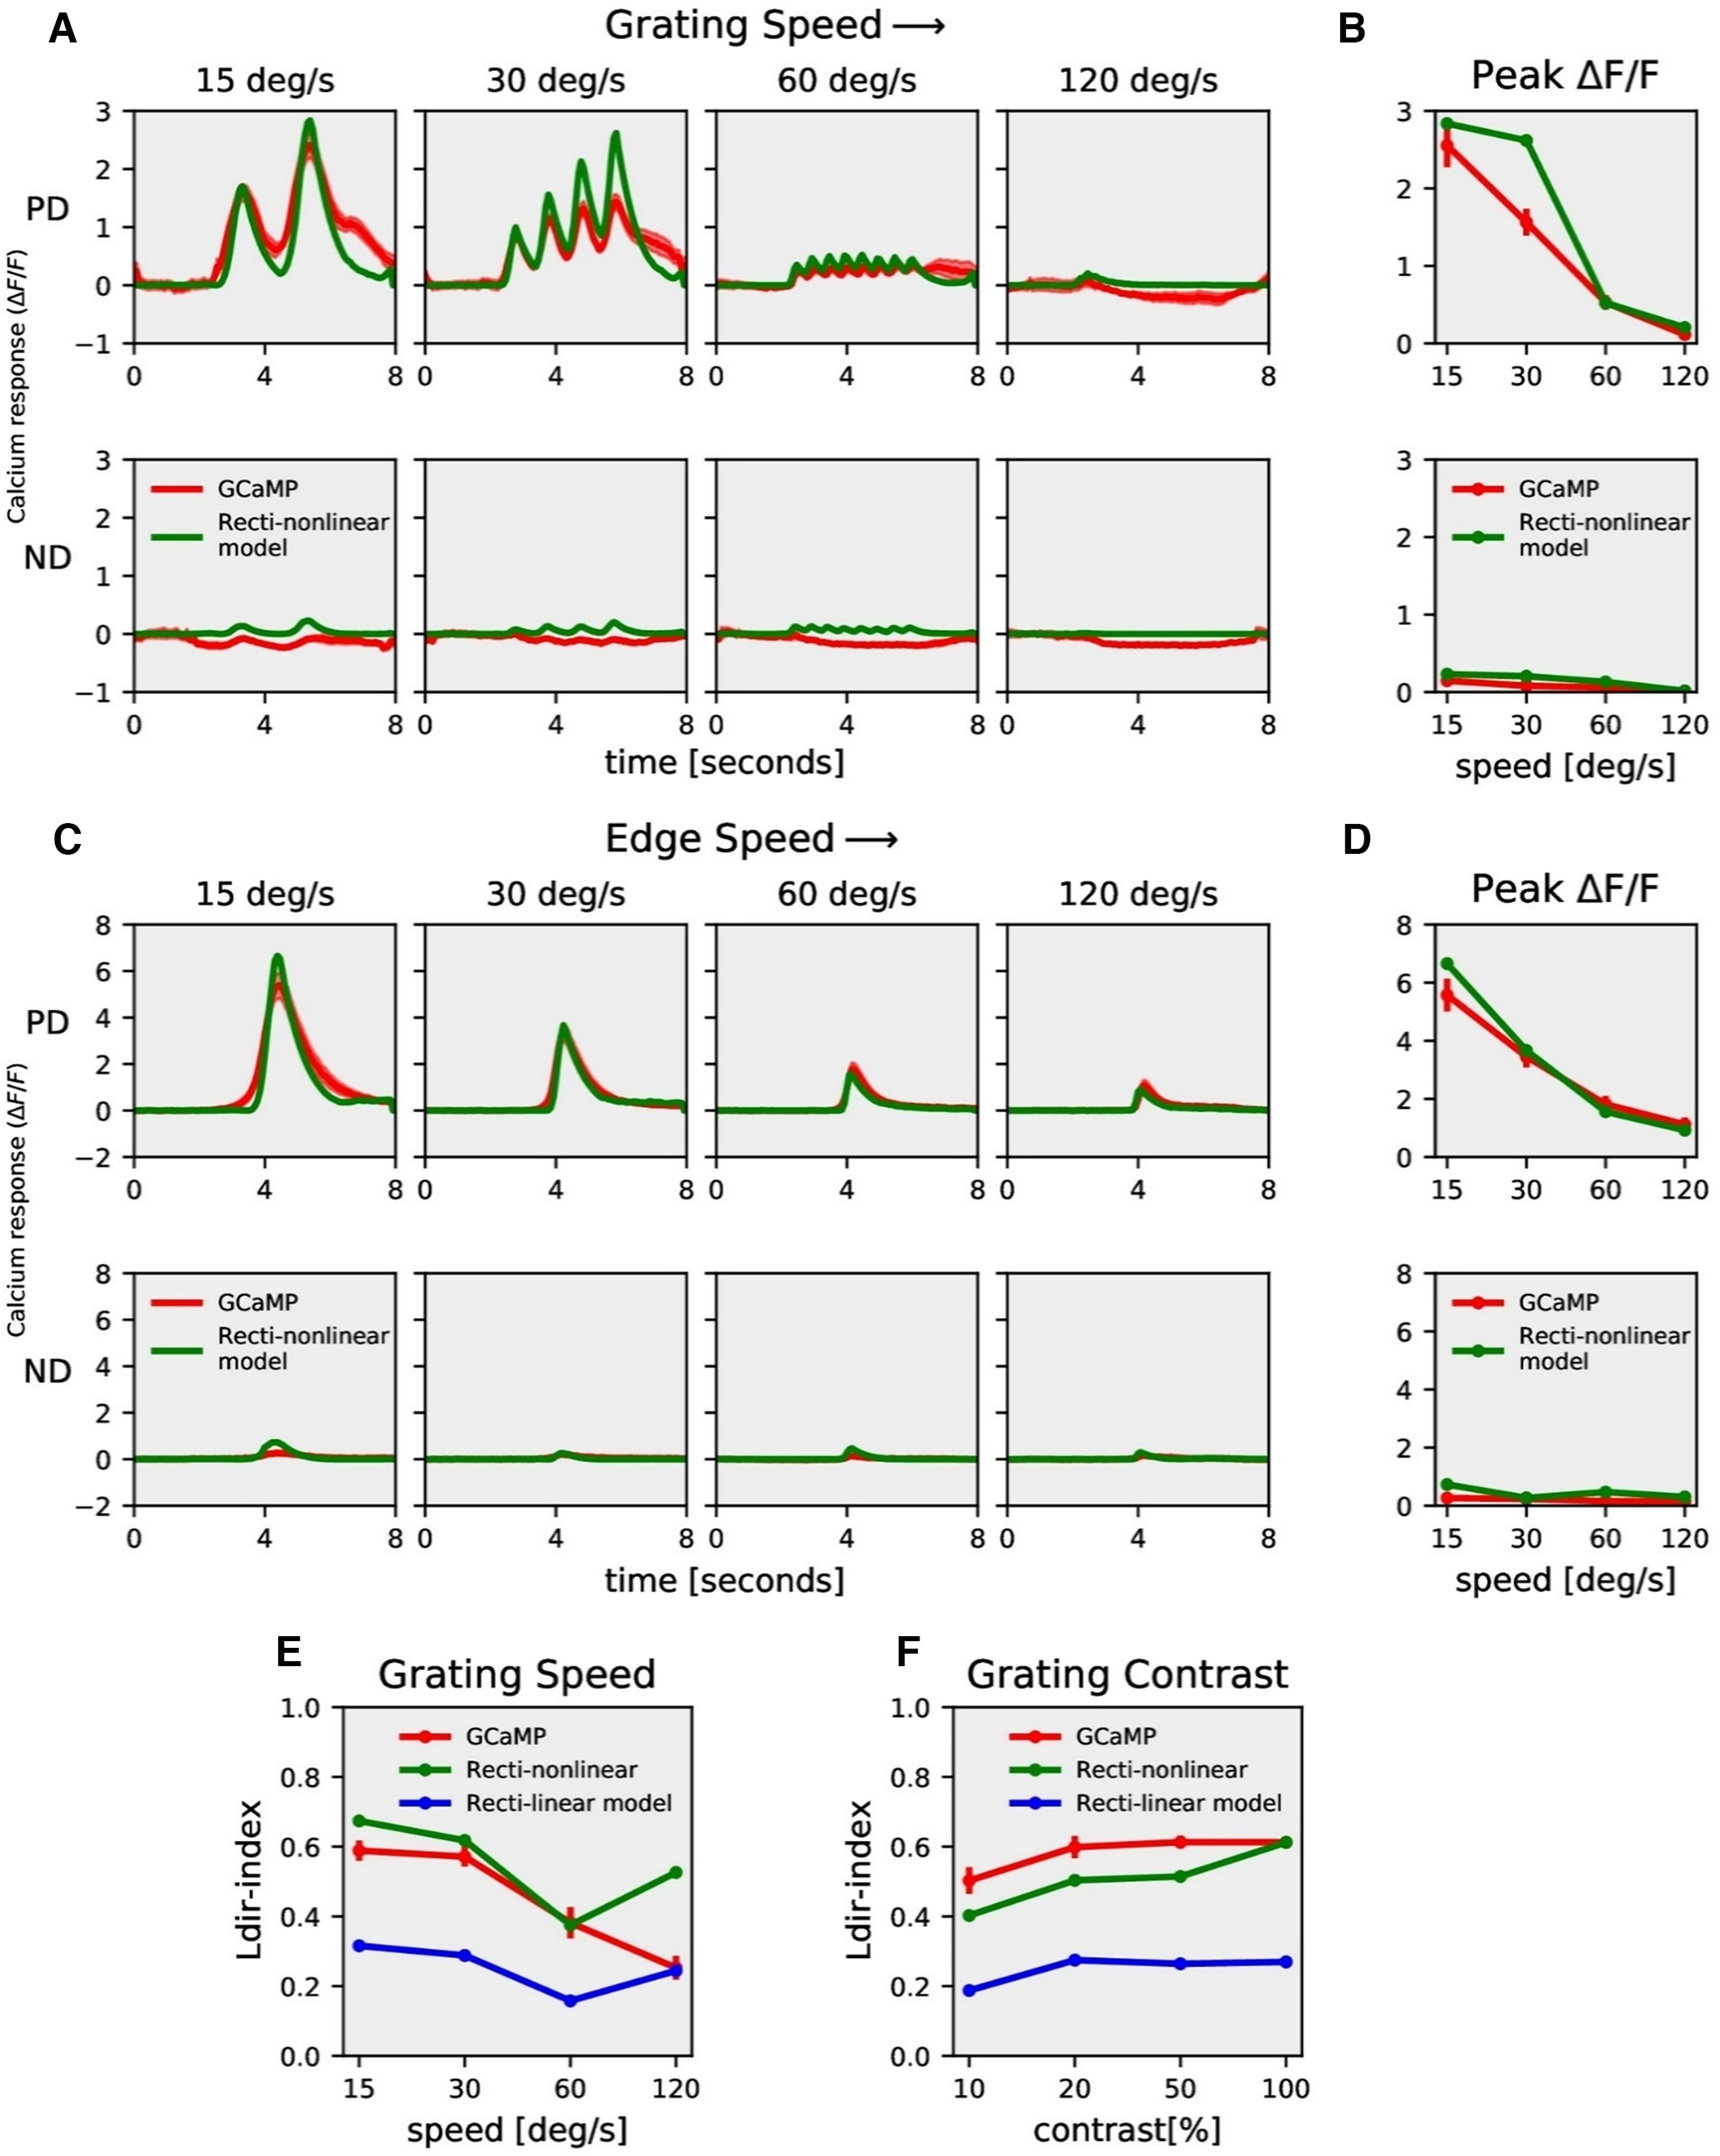
Model responses. A, T4c GCaMP6f (red) and recti-nonlinear model (green) responses to grating moving in PD (top row) and ND (bottom row) at four different speeds. B, T4c GCaMP6f and model peak responses to grating moving in PD (top) and ND (bottom) at four different speeds. C, T4c GCaMP6f (red) and recti-nonlinear model (green) responses to ON-edge moving in PD (top row) and ND (bottom row) at four different speeds. D, T4c GCaMP6f and model peak responses to ON-edge moving in PD (top) and ND (bottom) at four different speeds. E, F, The directional tuning index Ldir for GCaMP6f (red), recti-nonlinear (green), and rectilinear (blue) model for grating moving in 12 directions at four different speeds and at four different contrasts, respectively.
This recti-nonlinear model thus has in total six parameters: high-pass filter time constant, threshold, the low-pass filter time constant, exponent, gain and shift. The recti-nonlinear model was able to reproduce calcium signals across different visual stimuli (Fig. 6). In contrast to the rectilinear model where we found a modulation ratio of 1.1, the recti-nonlinear model could reproduce both the modulation as well as the slow rise in the GCaMP6f signal in response to gratings (Fig. 6A; modulation ratio 1.60, parameter in Table 1). The recti-nonlinear model could also reproduce the ON edge speed tuning responses across different speeds (Fig. 6C,D). Consequently, the directional tuning index Ldir was similar for the recti-nonlinear model and experimental data across slower speeds and all contrasts (Fig. 6E,F).
To investigate whether the voltage to calcium transformation as described for T4-cells by a recti-nonlinear model also applies to nondirectional cells, or whether, in these cells, the simpler rectilinear model is sufficient, we expressed ArcLight and GCaMP6f in medulla neurons Mi1 and Tm3 cells, which are both nondirection-selective. Mi1 and Tm3 are presynaptic to T4 cells (Takemura et al., 2017) and have an ON-center receptive field (Behnia et al., 2014; Arenz et al., 2017; Strother et al., 2017; Groschner et al., 2022). We measured ArcLight (black), and GCaMP6f (red) responses of Mi1 and Tm3 cells to gratings and edges moving at four different speeds and to gratings moving at four different contrasts (Figs. 7, 8). The gratings and edges moved along only one direction since the direction does not affect nondirection-selective cells' responses. Contrary to T4, Mi1 GCaMP6f responses showed only modulation without a slow increase over time (modulation ratio: 1.0; Fig. 7A; 15°/s, modulation ratio 1.2) For gratings moving at 30°/s and 60°/s, there was an increase in Tm3 GCaMP6f response over time, but the ArcLight response already had a slow increment over time (Fig. 8A). Similar to T4, the peak response for Mi1 and Tm3 decreased with increasing stimulus speed and increased with increasing stimulus contrast (Figs. 7, 8). However, the decrease in amplitude for increasing speeds turned out to be much stronger for T4c than for Mi1 and Tm3 (compare Figs. 2B,D to 7B,D and 8B,D). This hints to a shorter time-constant of the low-pass filter for Mi1 and Tm3.
Figure 7.
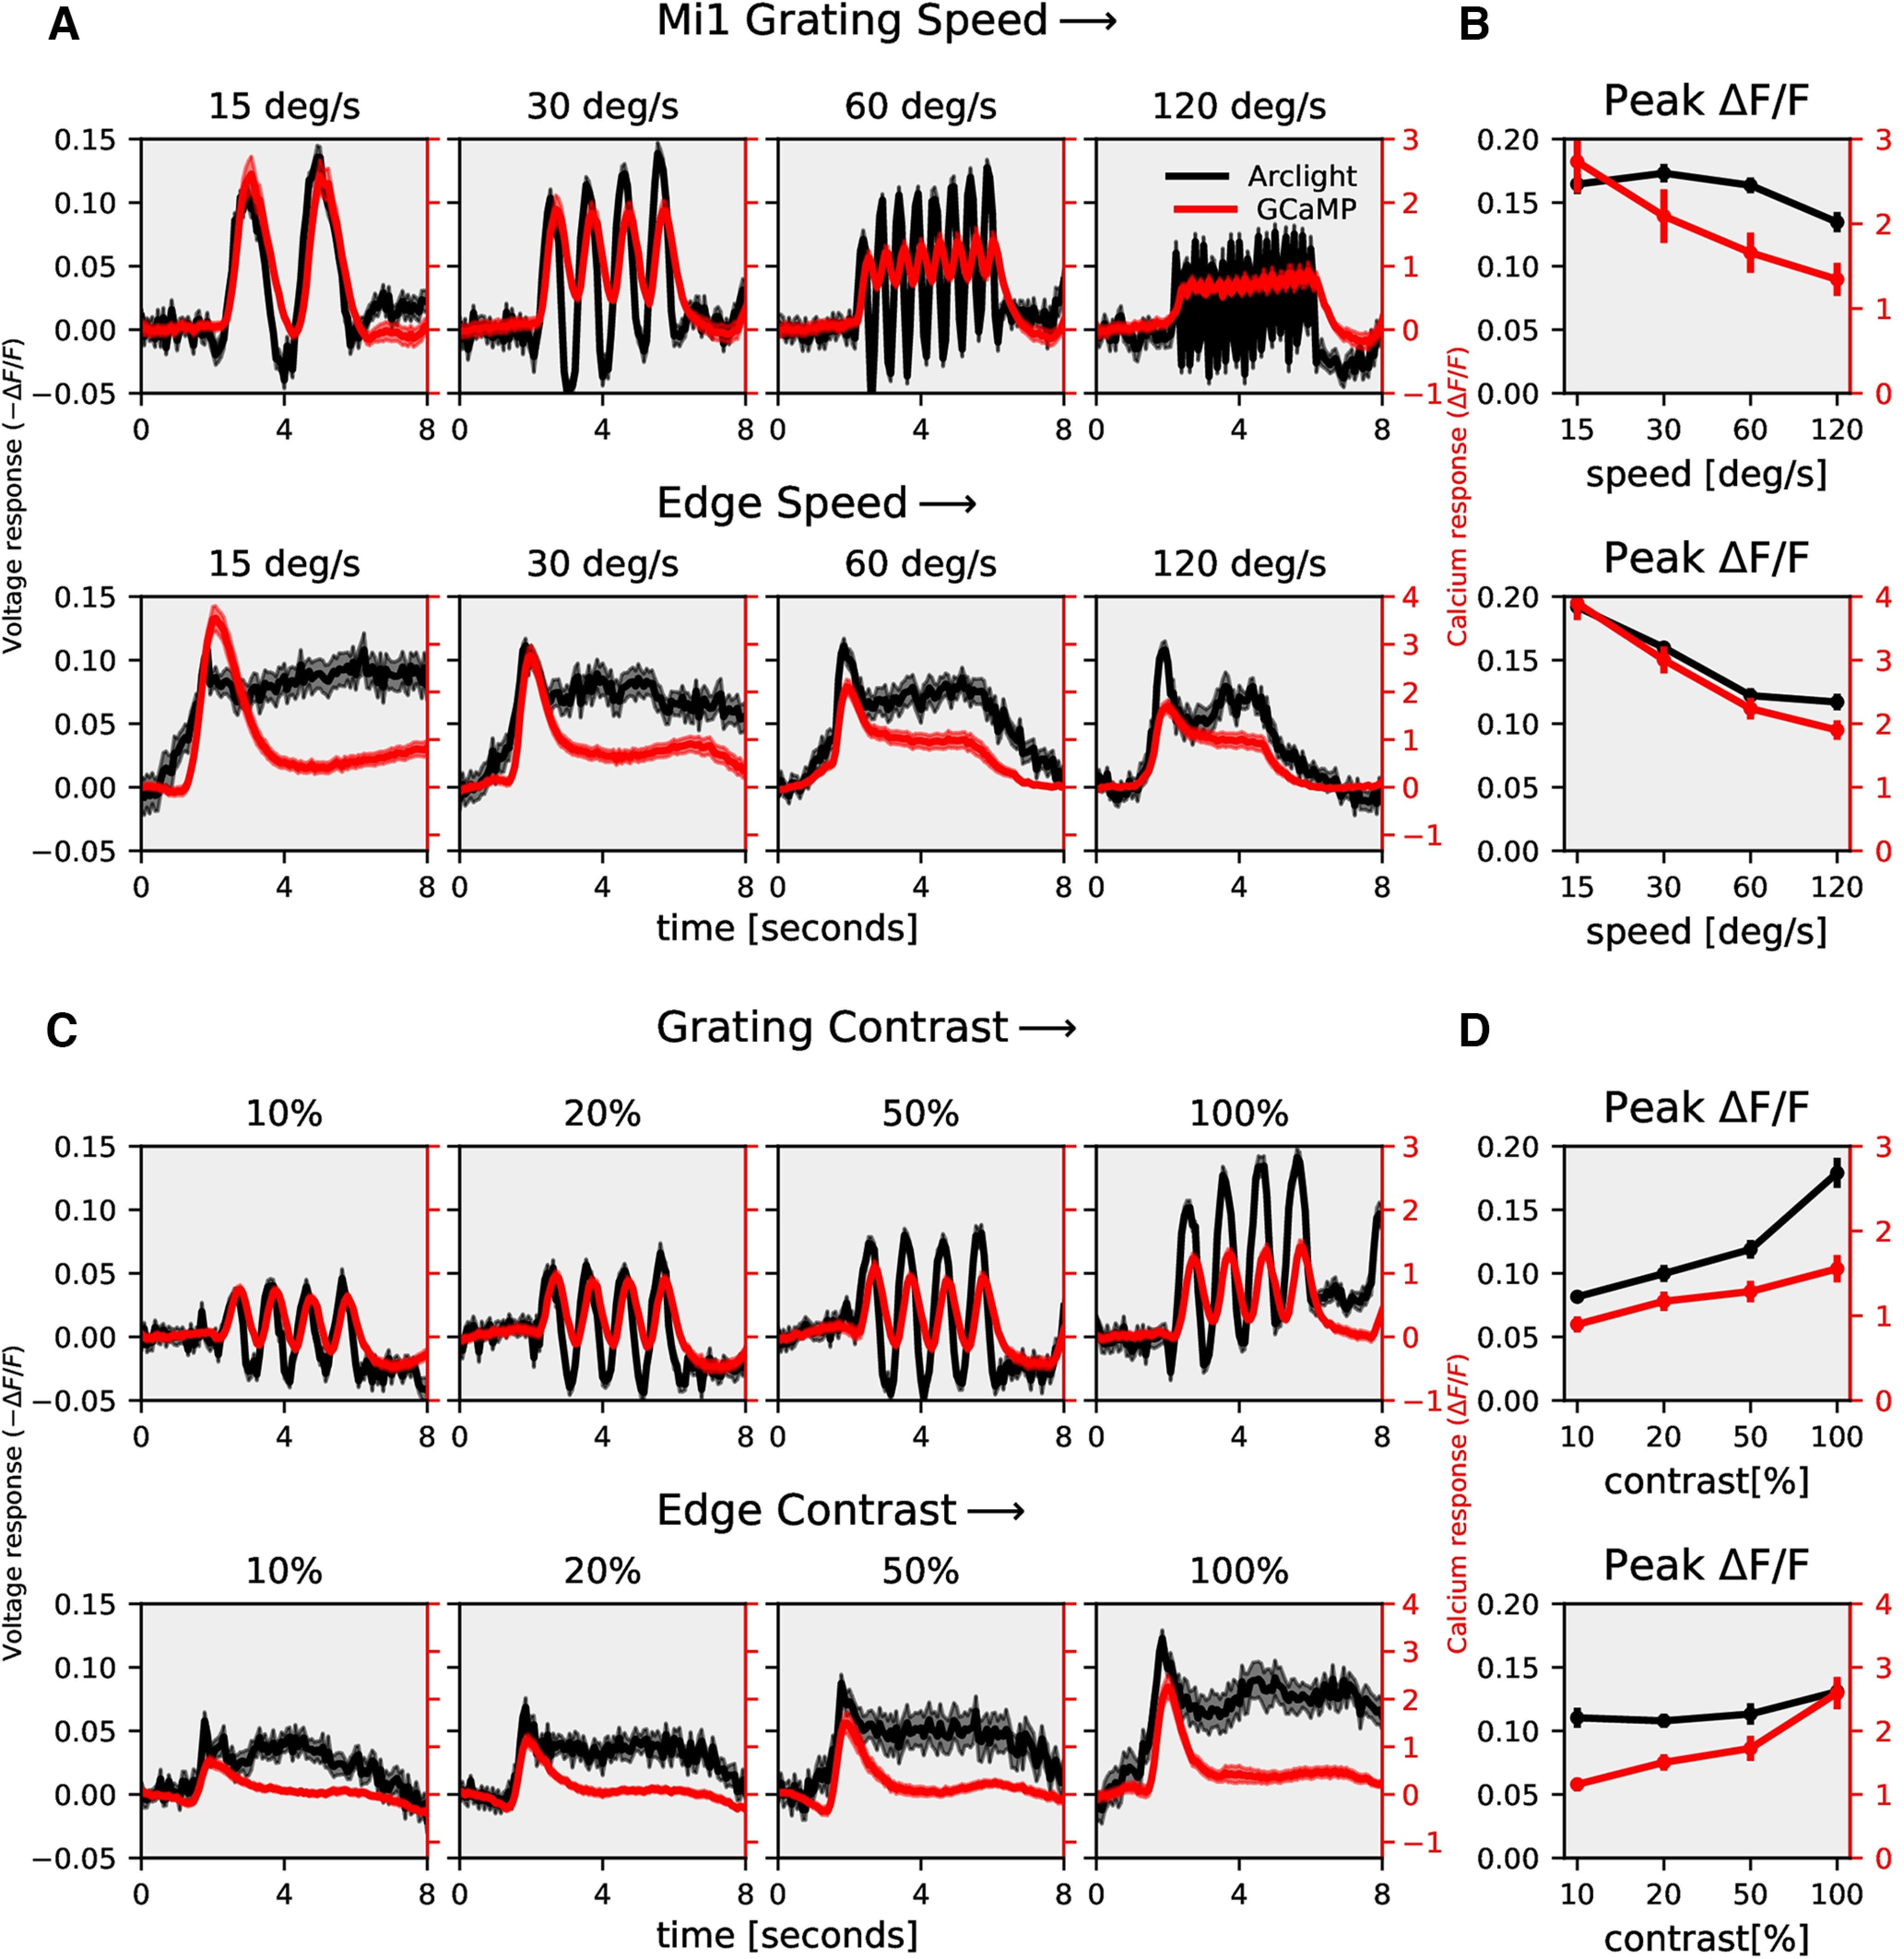
Mi1 speed and contrast dependence. A, Mi1 ArcLight (black) and GCaMP6f (red) responses to grating (top row) and edges (bottom row) moving at four different speeds (gratings: n = 24 ROIs from N = 5 flies for ArcLight, n = 19, N = 5 for GCaMP; edge: n = 27, N = 4 for ArcLight, n = 35, N = 5 for GCaMP). B, Mi1 peak responses to gratings (top) and edges (bottom) moving at four different speeds (top). C, Mi1 ArcLight (black) and GCaMP6f (red) responses to grating (top row) and edges (bottom row) moving at four different contrasts (gratings: n = 24 ROIs from N = 5 flies for ArcLight, n = 22, N = 5 for GCaMP; edge: n = 18, N = 4 for ArcLight, n = 24, N = 5 for GCaMP). The left y-axis of the plot represents voltage responses, i.e., changes in ArcLight fluorescence (−ΔF/F) and the right y-axis of the plot represents calcium responses, i.e., changes in GCaMP6f fluorescence (ΔF/F). D, Mi1 peak responses to gratings (top) and edges (bottom) moving at four different contrasts. All data show the mean ± SEM.
Figure 8.
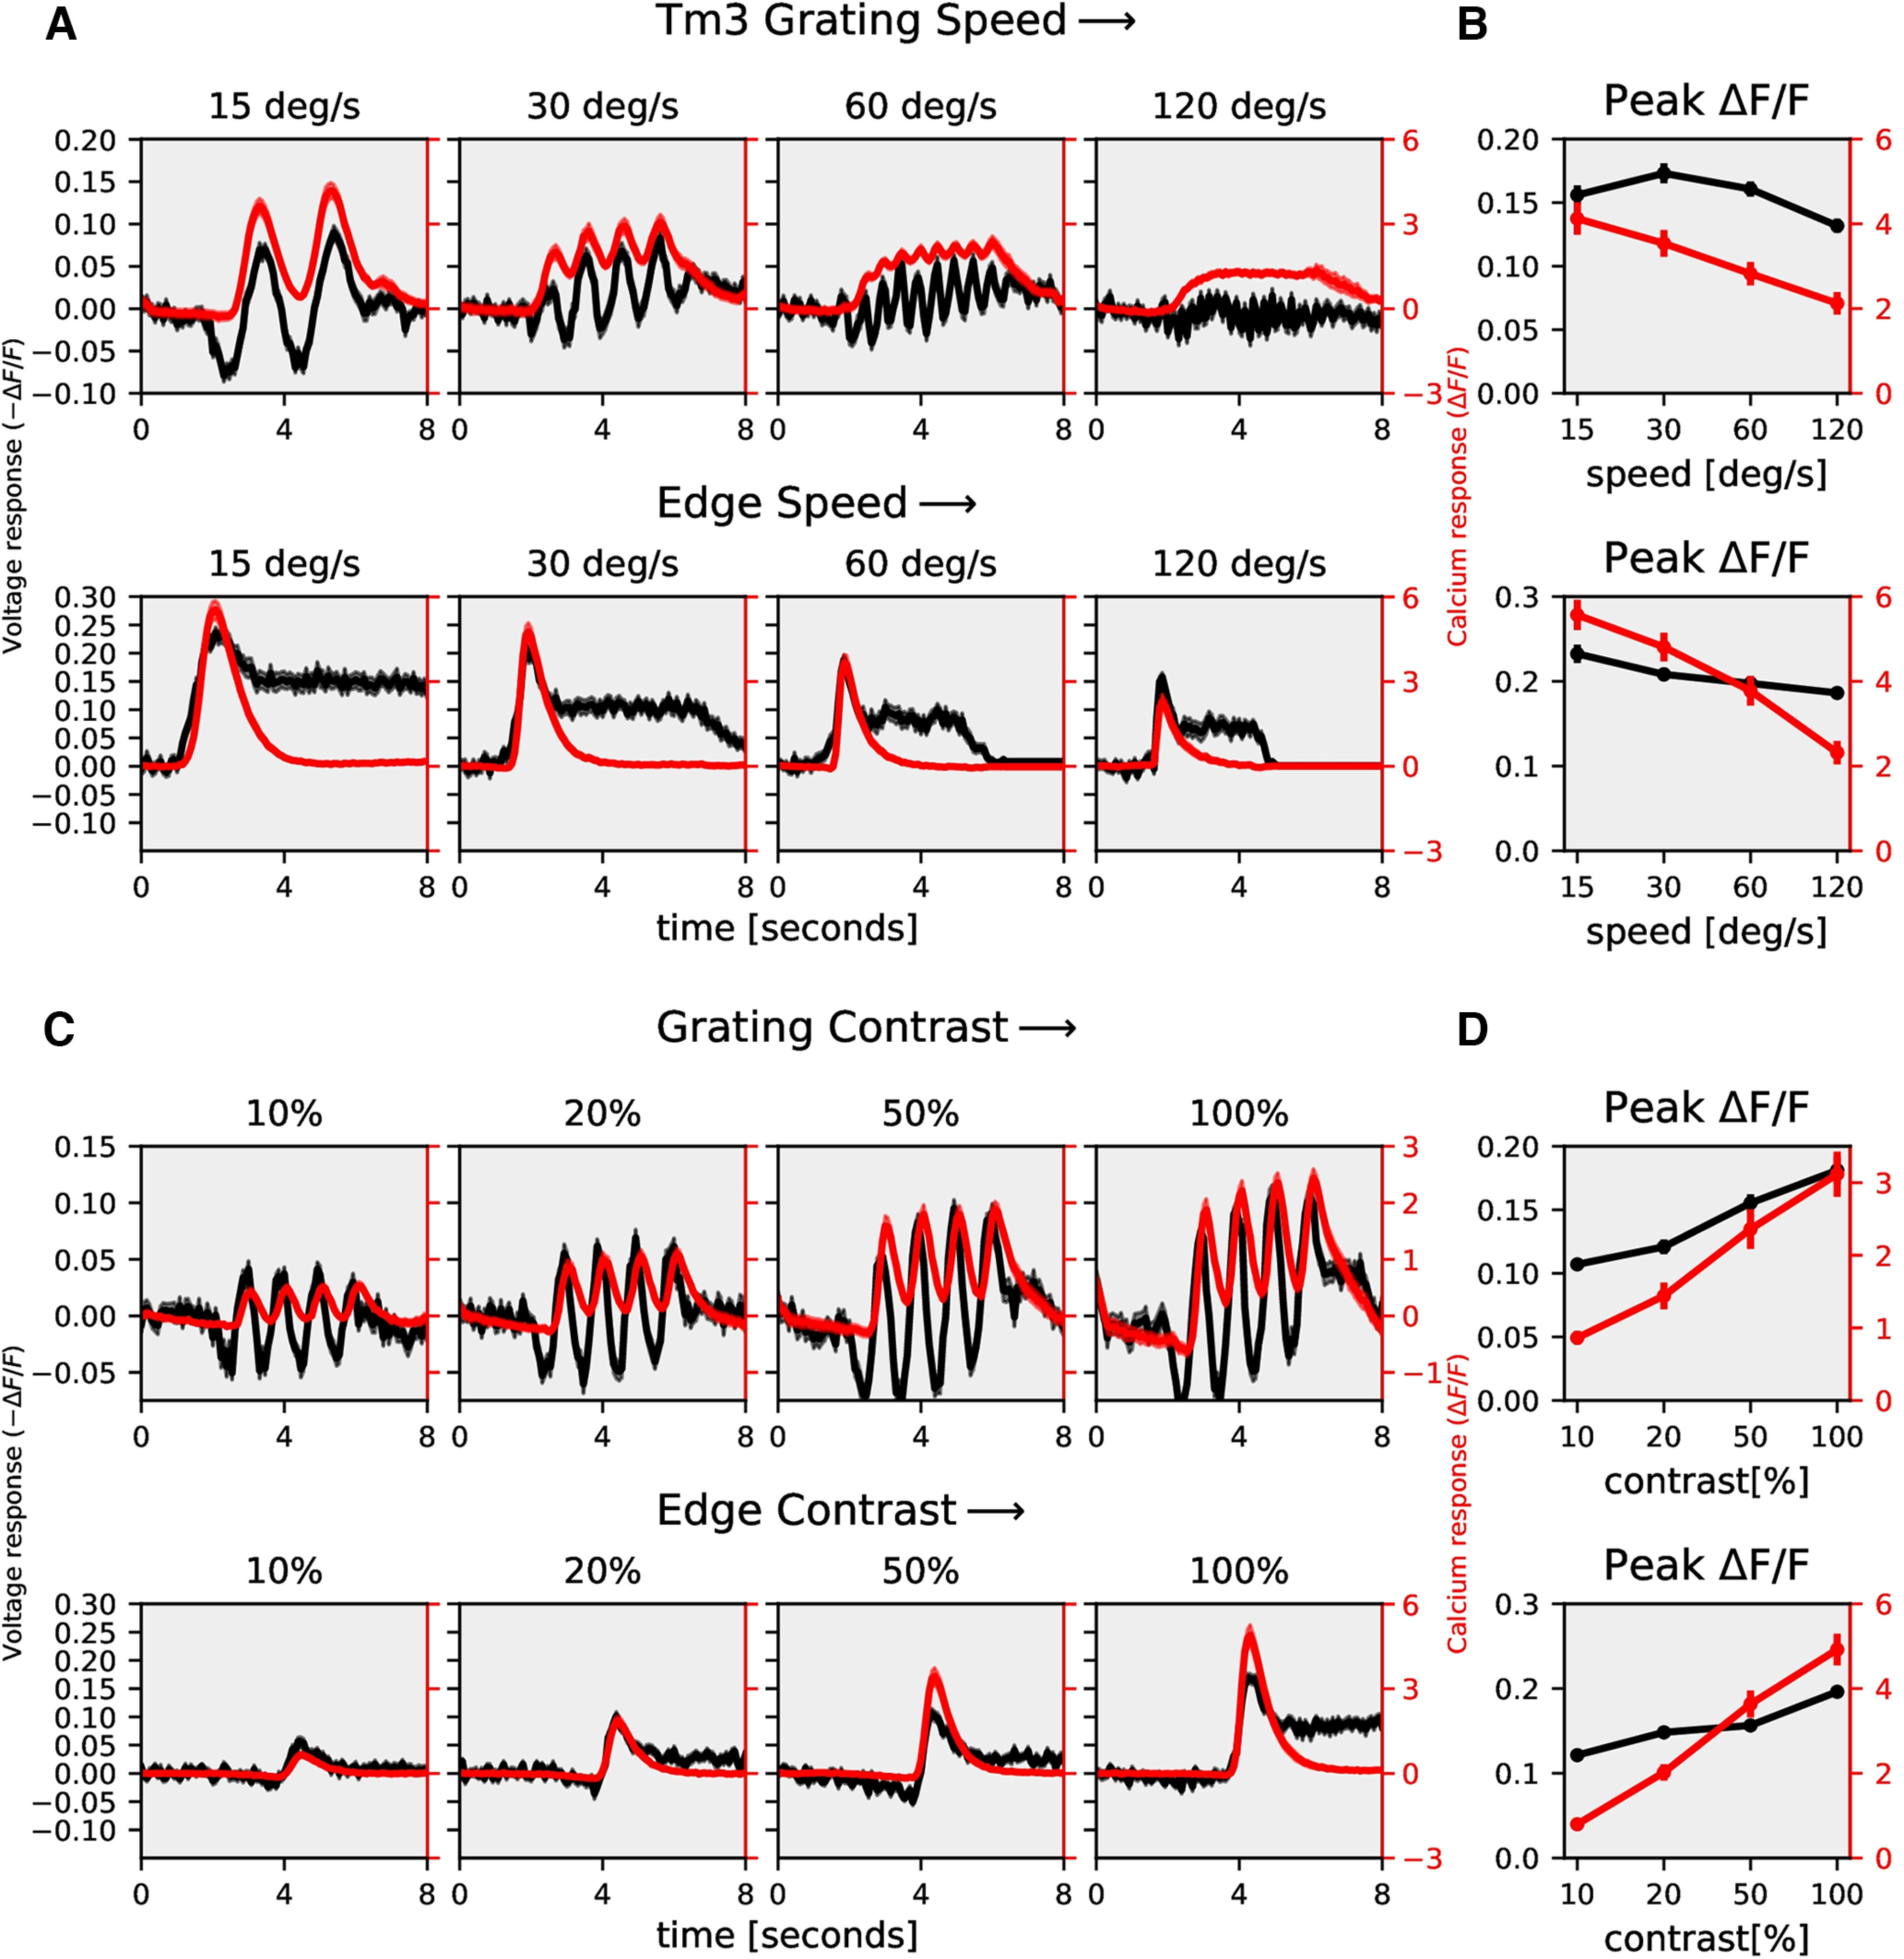
Tm3 speed and contrast dependence: Same as Figure 7, but for Tm3. A, Gratings: n = 52 ROIs from N = 5 flies for ArcLight, n = 26, N = 3 for GCaMP; edge: n = 28, N = 4 for ArcLight, n = 42, N = 4 for GCaMP. B, Tm3 peak responses to gratings (top) and edges (bottom) moving at four different speeds. C, Gratings: n = 35 ROIs from N = 5 flies for ArcLight, n = 36, N = 4 for GCaMP; edge: n = 29, N = 4 for ArcLight, n = 39, N = 4 for GCaMP. D, Tm3 peak responses to gratings (top) and edges (bottom) moving at four different contrasts. All data show the mean ± SEM.
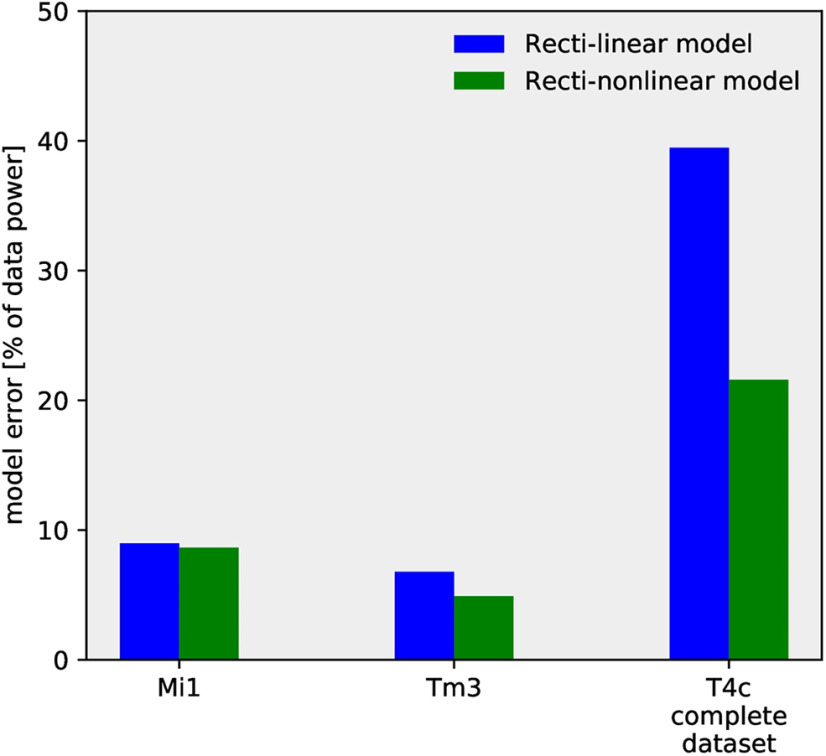
Next, we used the models described in Figure 5 to reproduce Mi1 and Tm3 calcium responses using their ArcLight responses. As discussed earlier, the rectilinear model (Fig. 5A) with a single low-pass filter was not able to reproduce T4 calcium responses across all stimuli. However, for Mi1 and Tm3, the rectilinear model accurately replicated the speed and contrast tuning (Figs. 9, 10; see Table 1 for parameter). We further compared the model error for the rectilinear and recti-nonlinear models for Mi1, Tm3, and T4c data (Fig. 11). The model error for Mi1 and Tm3 for the rectilinear model was ≈9% and ≅7%, respectively, compared with ≈9% and ≅5% for the recti-nonlinear model with exponents close to 1 (Mi1 exponent: 1.3; Tm3 exponent: 1.5). Thus, the rectilinear model already performed well for the Mi1 and Tm3 datasets, and changing to the recti-nonlinear model only slightly improved the performance. For the T4c dataset, the model error was ≈39% and ≈22% for the rectilinear and recti-nonlinear models (exponent: 2.5), respectively. Hence, the recti-nonlinear model performed better for the T4c dataset whereas for Mi1 and Tm3 the rectilinear model was sufficient to reproduce the calcium responses. This suggests that voltage to calcium transformation is different for the direction-selective cell T4 than for the nondirection-selective cells Mi1 and Tm3.
Figure 9.
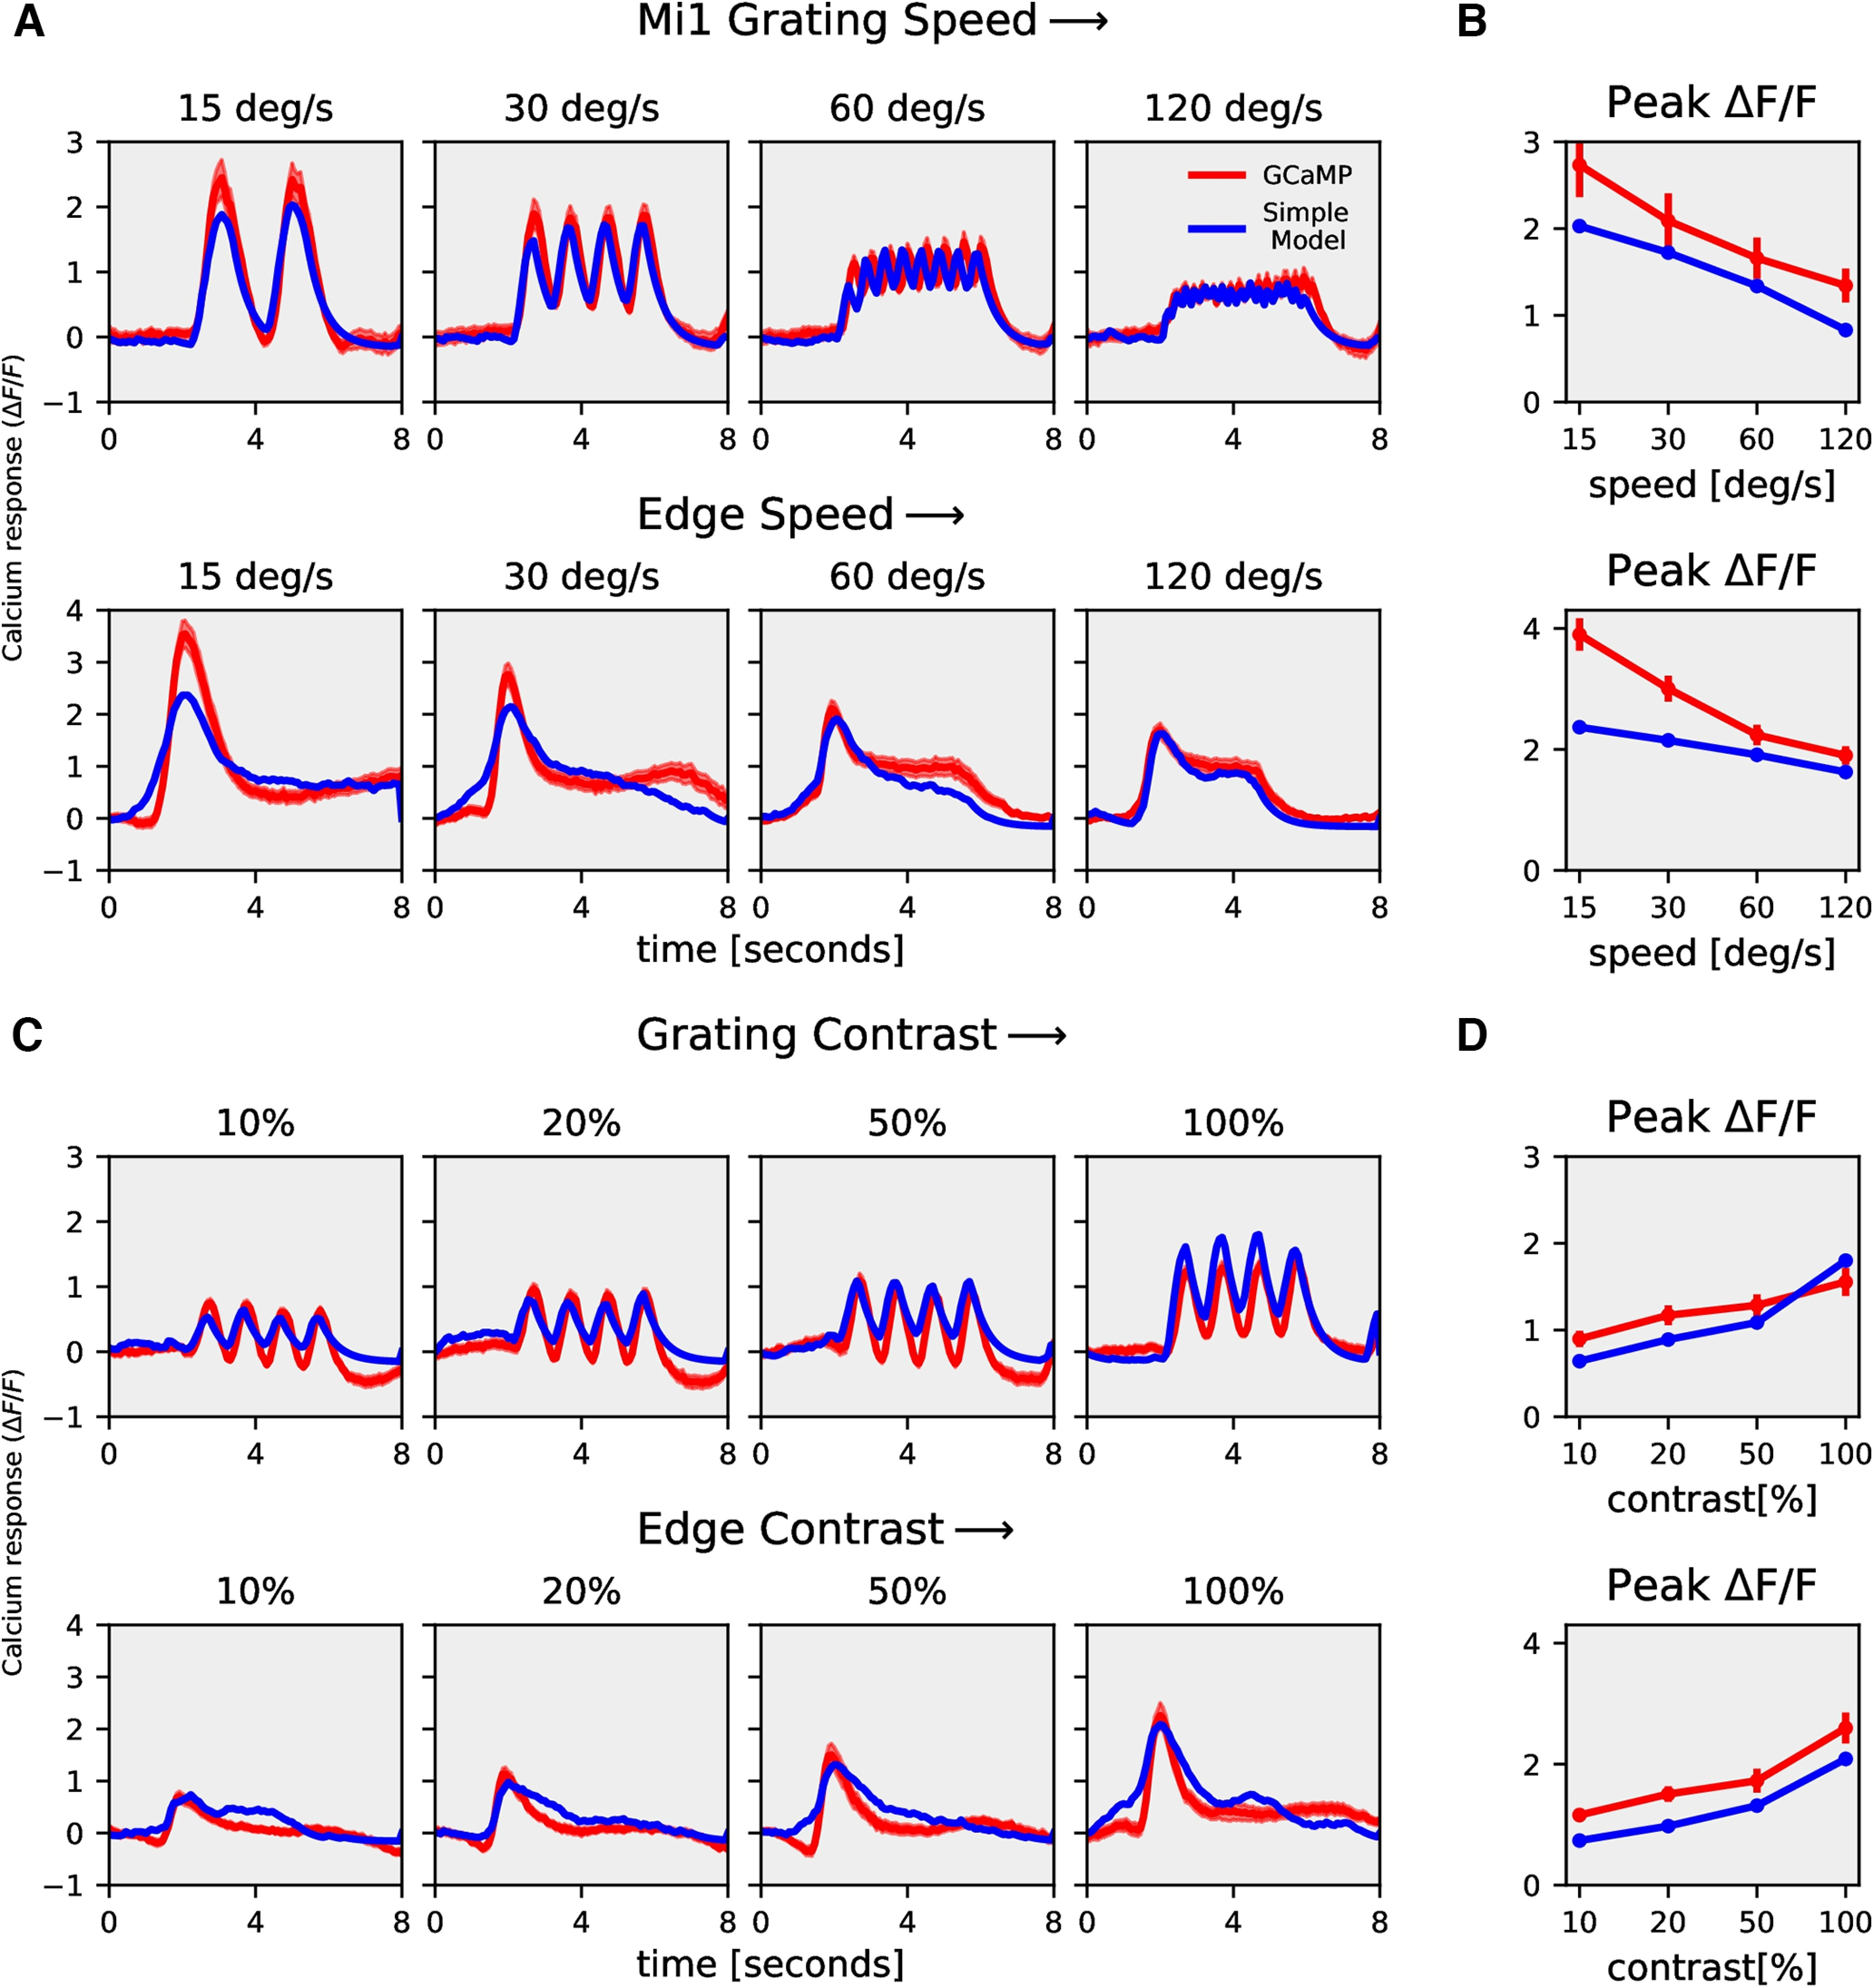
Mi1 rectilinear model responses. A, Mi1 GCaMP6f (red) and rectilinear model (blue) responses to gratings moving at four different speeds (top row) and to gratings moving at four different contrasts (bottom row). B, Mi1 GCaMP6f and model peak responses to gratings moving at four different speeds (top) and four different contrasts (bottom). C, Tm3 GCaMP6f (red) and rectilinear model (blue) responses to gratings moving at four different speeds (top row) and to gratings moving at four different contrasts (bottom row). D, Tm3 GCaMP6f and model peak responses to gratings moving at four different speeds (top) and four different contrasts (bottom).
Figure 10.
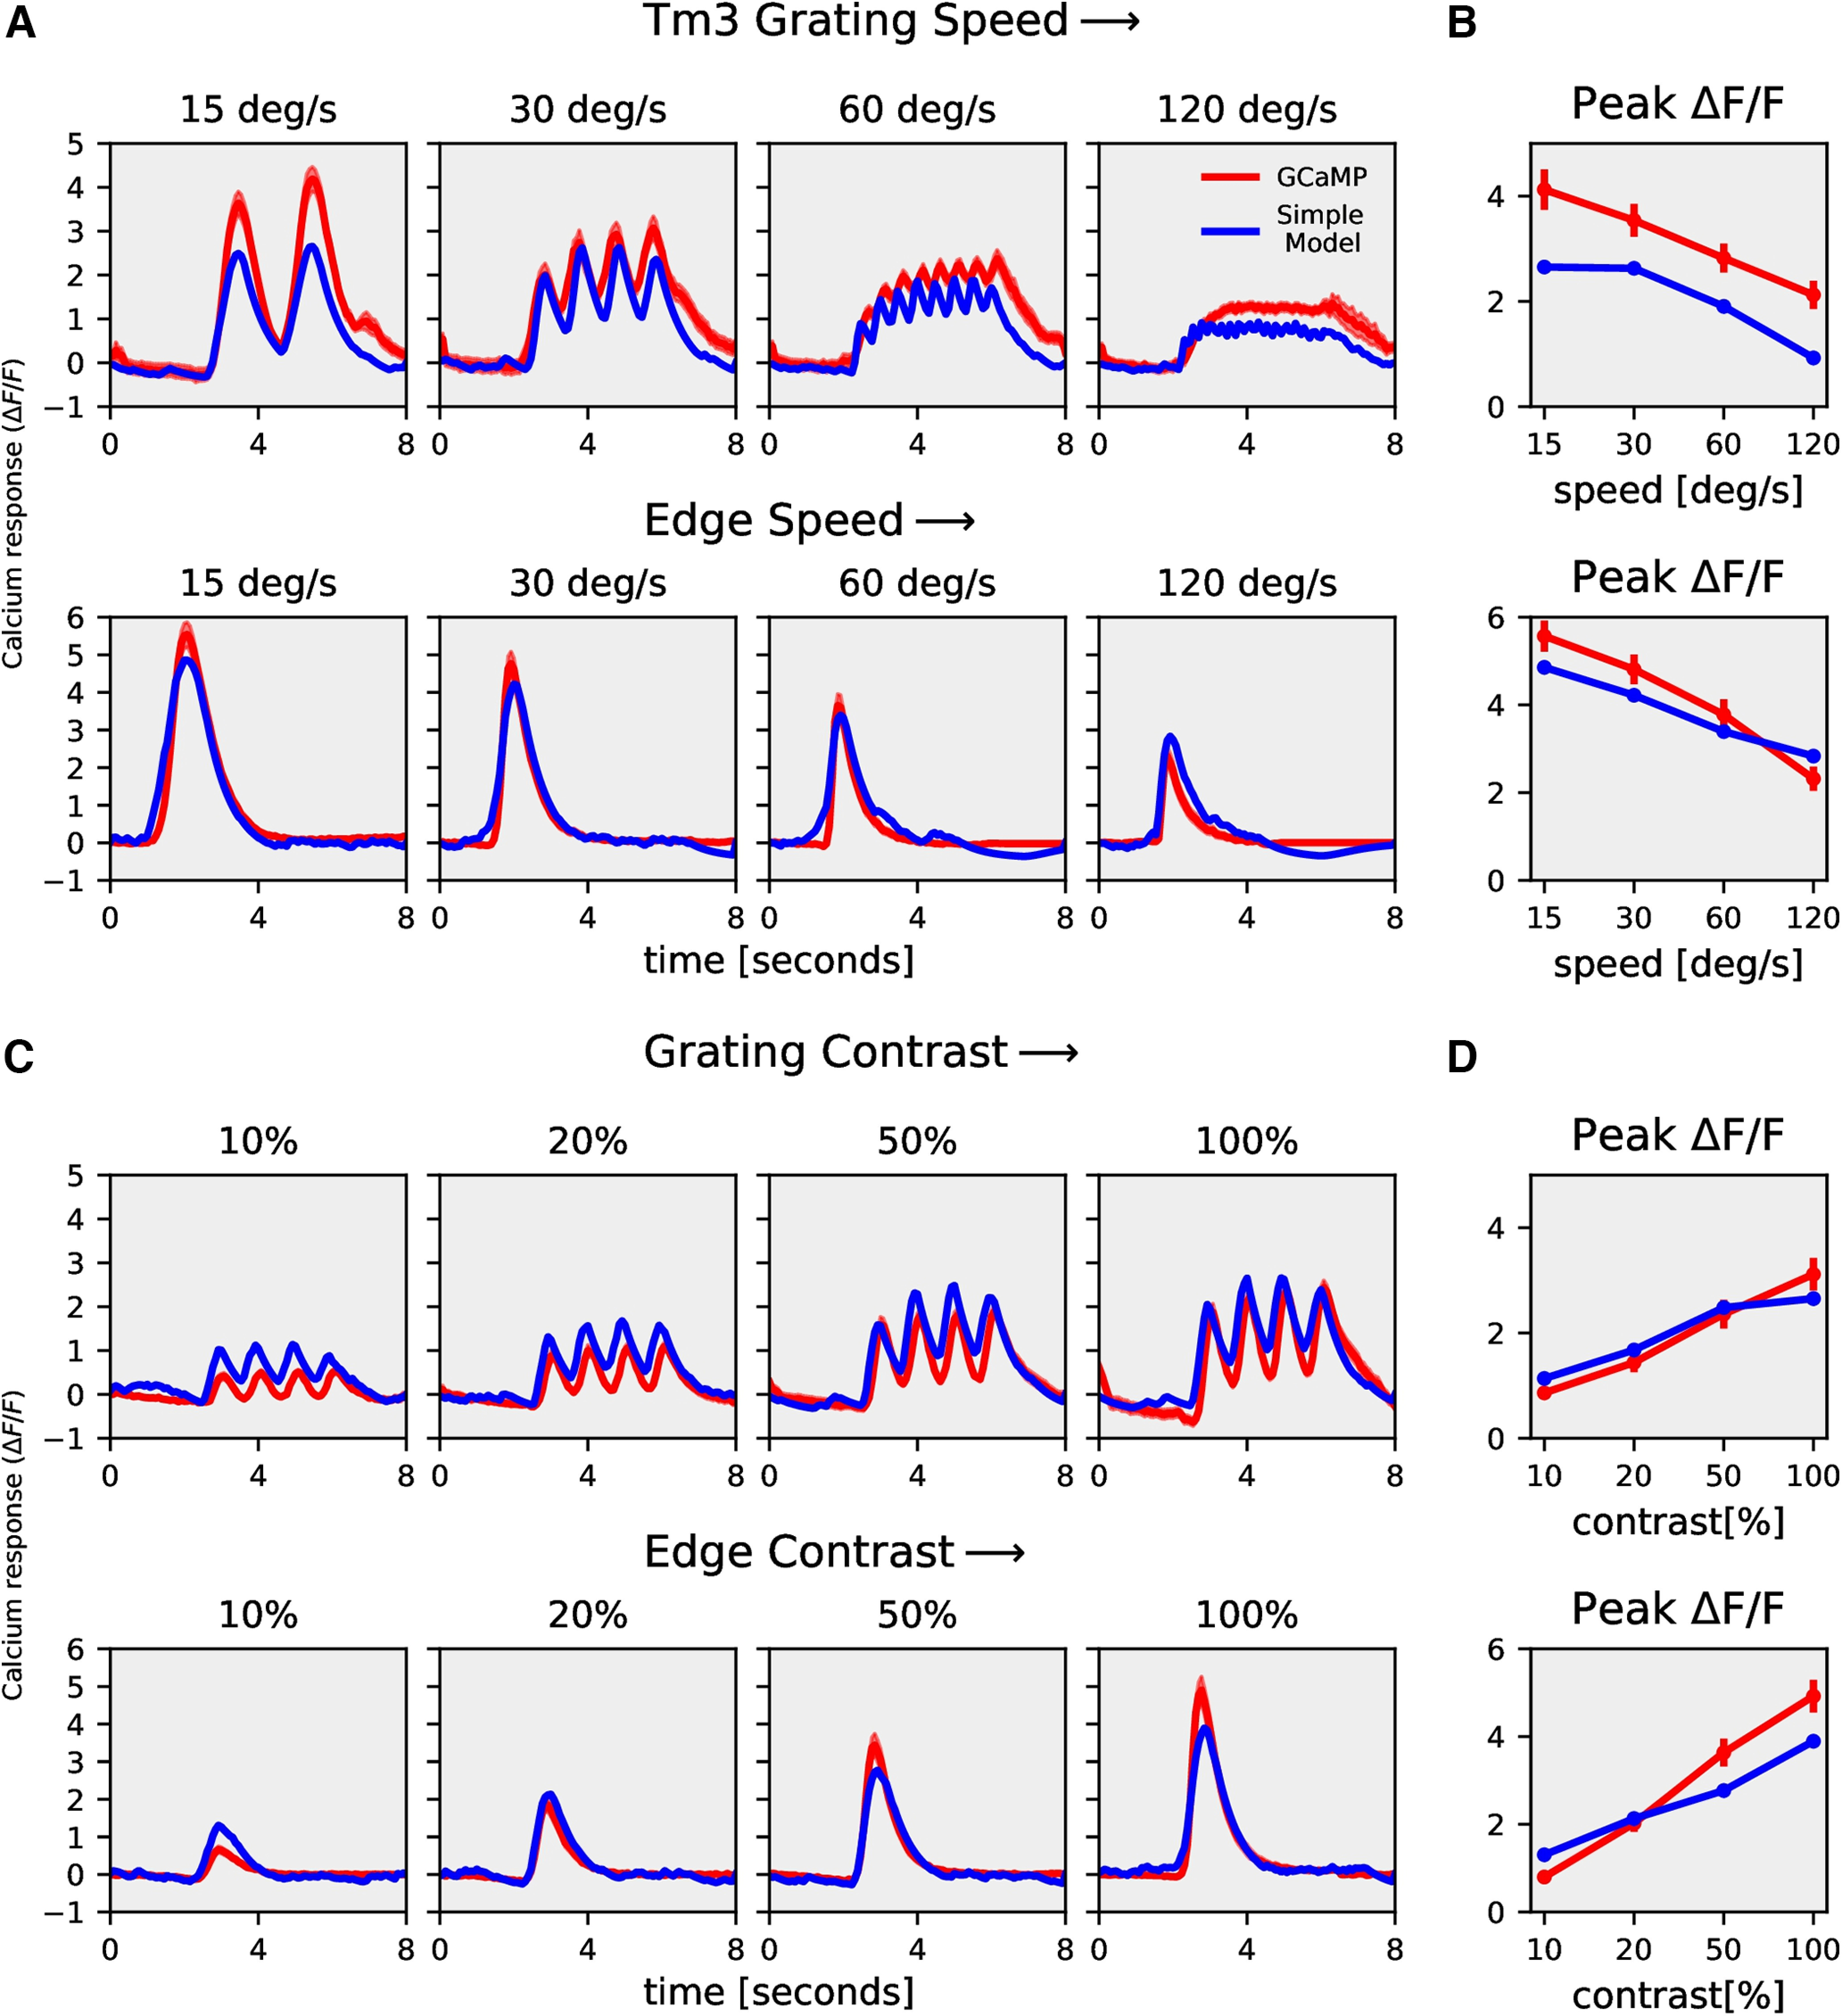
Tm3 rectilinear model responses. A, Mi1 GCaMP6f (red) and rectilinear model (blue) responses to gratings moving at four different speeds (top row) and to gratings moving at four different contrasts (bottom row). B, Mi1 GCaMP6f and model peak responses to gratings moving at four different speeds (top) and four different contrasts (bottom). C, Tm3 GCaMP6f (red) and rectilinear model (blue) responses to gratings moving at four different speeds (top row) and to gratings moving at four different contrasts (bottom row). D, Tm3 GCaMP6f and model peak responses to gratings moving at four different speeds (top) and four different contrasts (bottom).
Figure 11.
Model error for the rectilinear and recti-nonlinear model. The model error for the rectilinear model (blue) and recti-nonlinear model (green). Mi1 and Tm3 dataset consists of gratings at four different speeds and contrast moving in a single direction. T4c complete dataset consists of gratings moving in 12 different directions, and ON edge moving in PD, ND at four different speeds and contrasts, i.e., a total of 112 stimuli conditions.
So far, all optical recordings have been made from dendritic compartments of T4 cells located in layer 10 of the medulla. As was shown for Mi1 cells, even in tiny neurons of Drosophila, calcium signals can be compartmentalized (Yang et al., 2016). In order to compare calcium responses in different compartments of T4c, we recorded the activity in axon terminals in the lobula plate (layer c). Figure 12 shows the directional tuning for different speeds (Fig. 12A) and different contrasts (Fig. 12B) for GCaMP6f responses in the medulla (red lines) and in the lobula plate (gray lines). We found that the directional tuning in the two compartments is very similar with a slightly narrower tuning in the lobula plate. To test for statistical significance, we calculated the circular variance (Berens, 2009) for each experiment and tested the values for differences in the two distributions with a two-sample t test. At the 5% significance level, the two distributions were not different (p = 0.51).
Figure 12.
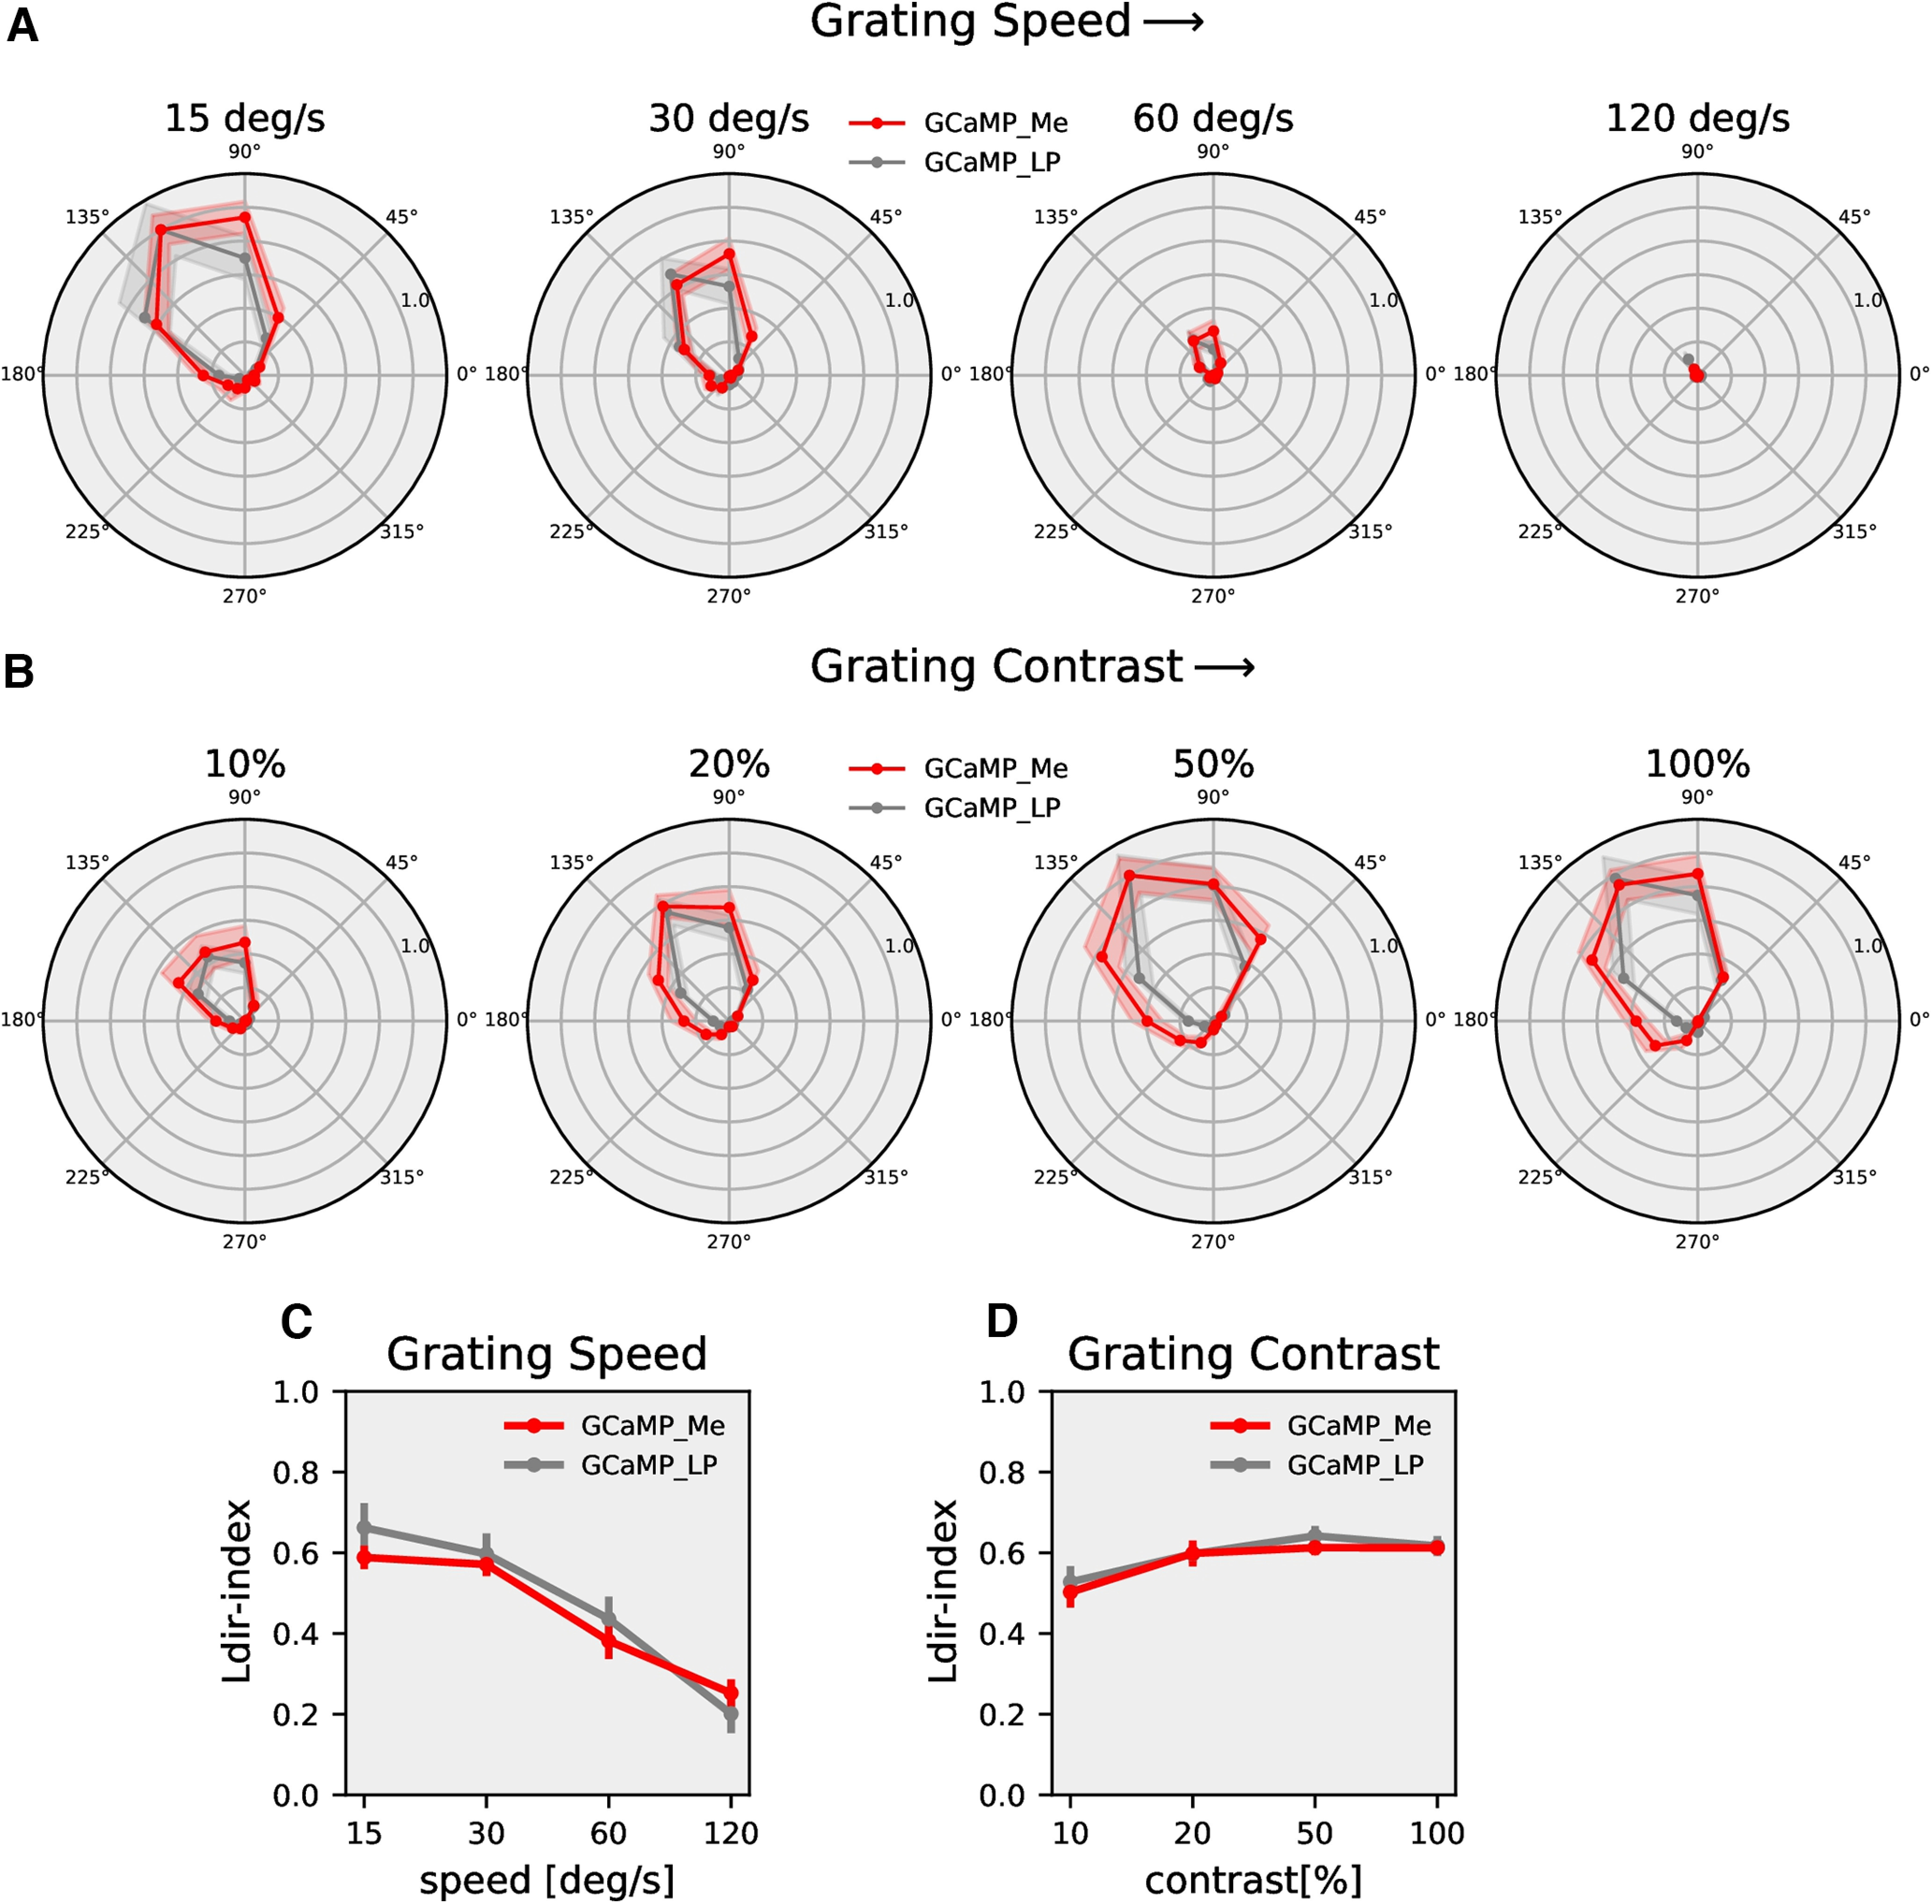
T4c directional tuning in the dendrite and the axon terminal. A, T4c GCaMP6f (red) recorded in the medulla and T4c GCaMP6f (gray) recorded in the lobula plate. Shown are the normalized peak responses to grating moving in 12 directions at four different speeds (medulla: n = 12 ROIs from N = 8 flies; lobula plate: n = 9, N = 6). B, Same as A but for four different contrasts (medulla: n = 15 ROIs from N = 7 flies; lobula plate: n = 19, N = 8). C, The directional tuning index Ldir for grating moving at four different speeds. The directional tuning index is calculated as the vector sum of the peak responses divided by the sum of all individual vector magnitudes. D, The directional tuning index for grating at four different contrasts. All data show the mean ± SEM.
To further test whether calcium signals might be different in dendrites and axon terminals, we compared the calcium responses in the dendrite and axon terminal of individual T4 cells using the SPARC technique (Isaacman-Beck et al., 2020). This toolkit allows to express effectors in a sparse subset of cells of the same cell type. Figure 13A shows the anatomy of such a single T4c cell. The calcium responses to gratings moving at different speeds is shown in Figure 13B. There is no difference in the directional tuning between GCaMP signals measured in the axon terminal (gray line) and in the dendrite (red line), indicating that there is no compartmentalization for calcium signals (two sample t test for differences in the circular variances: p = 0.81).
Figure 13.
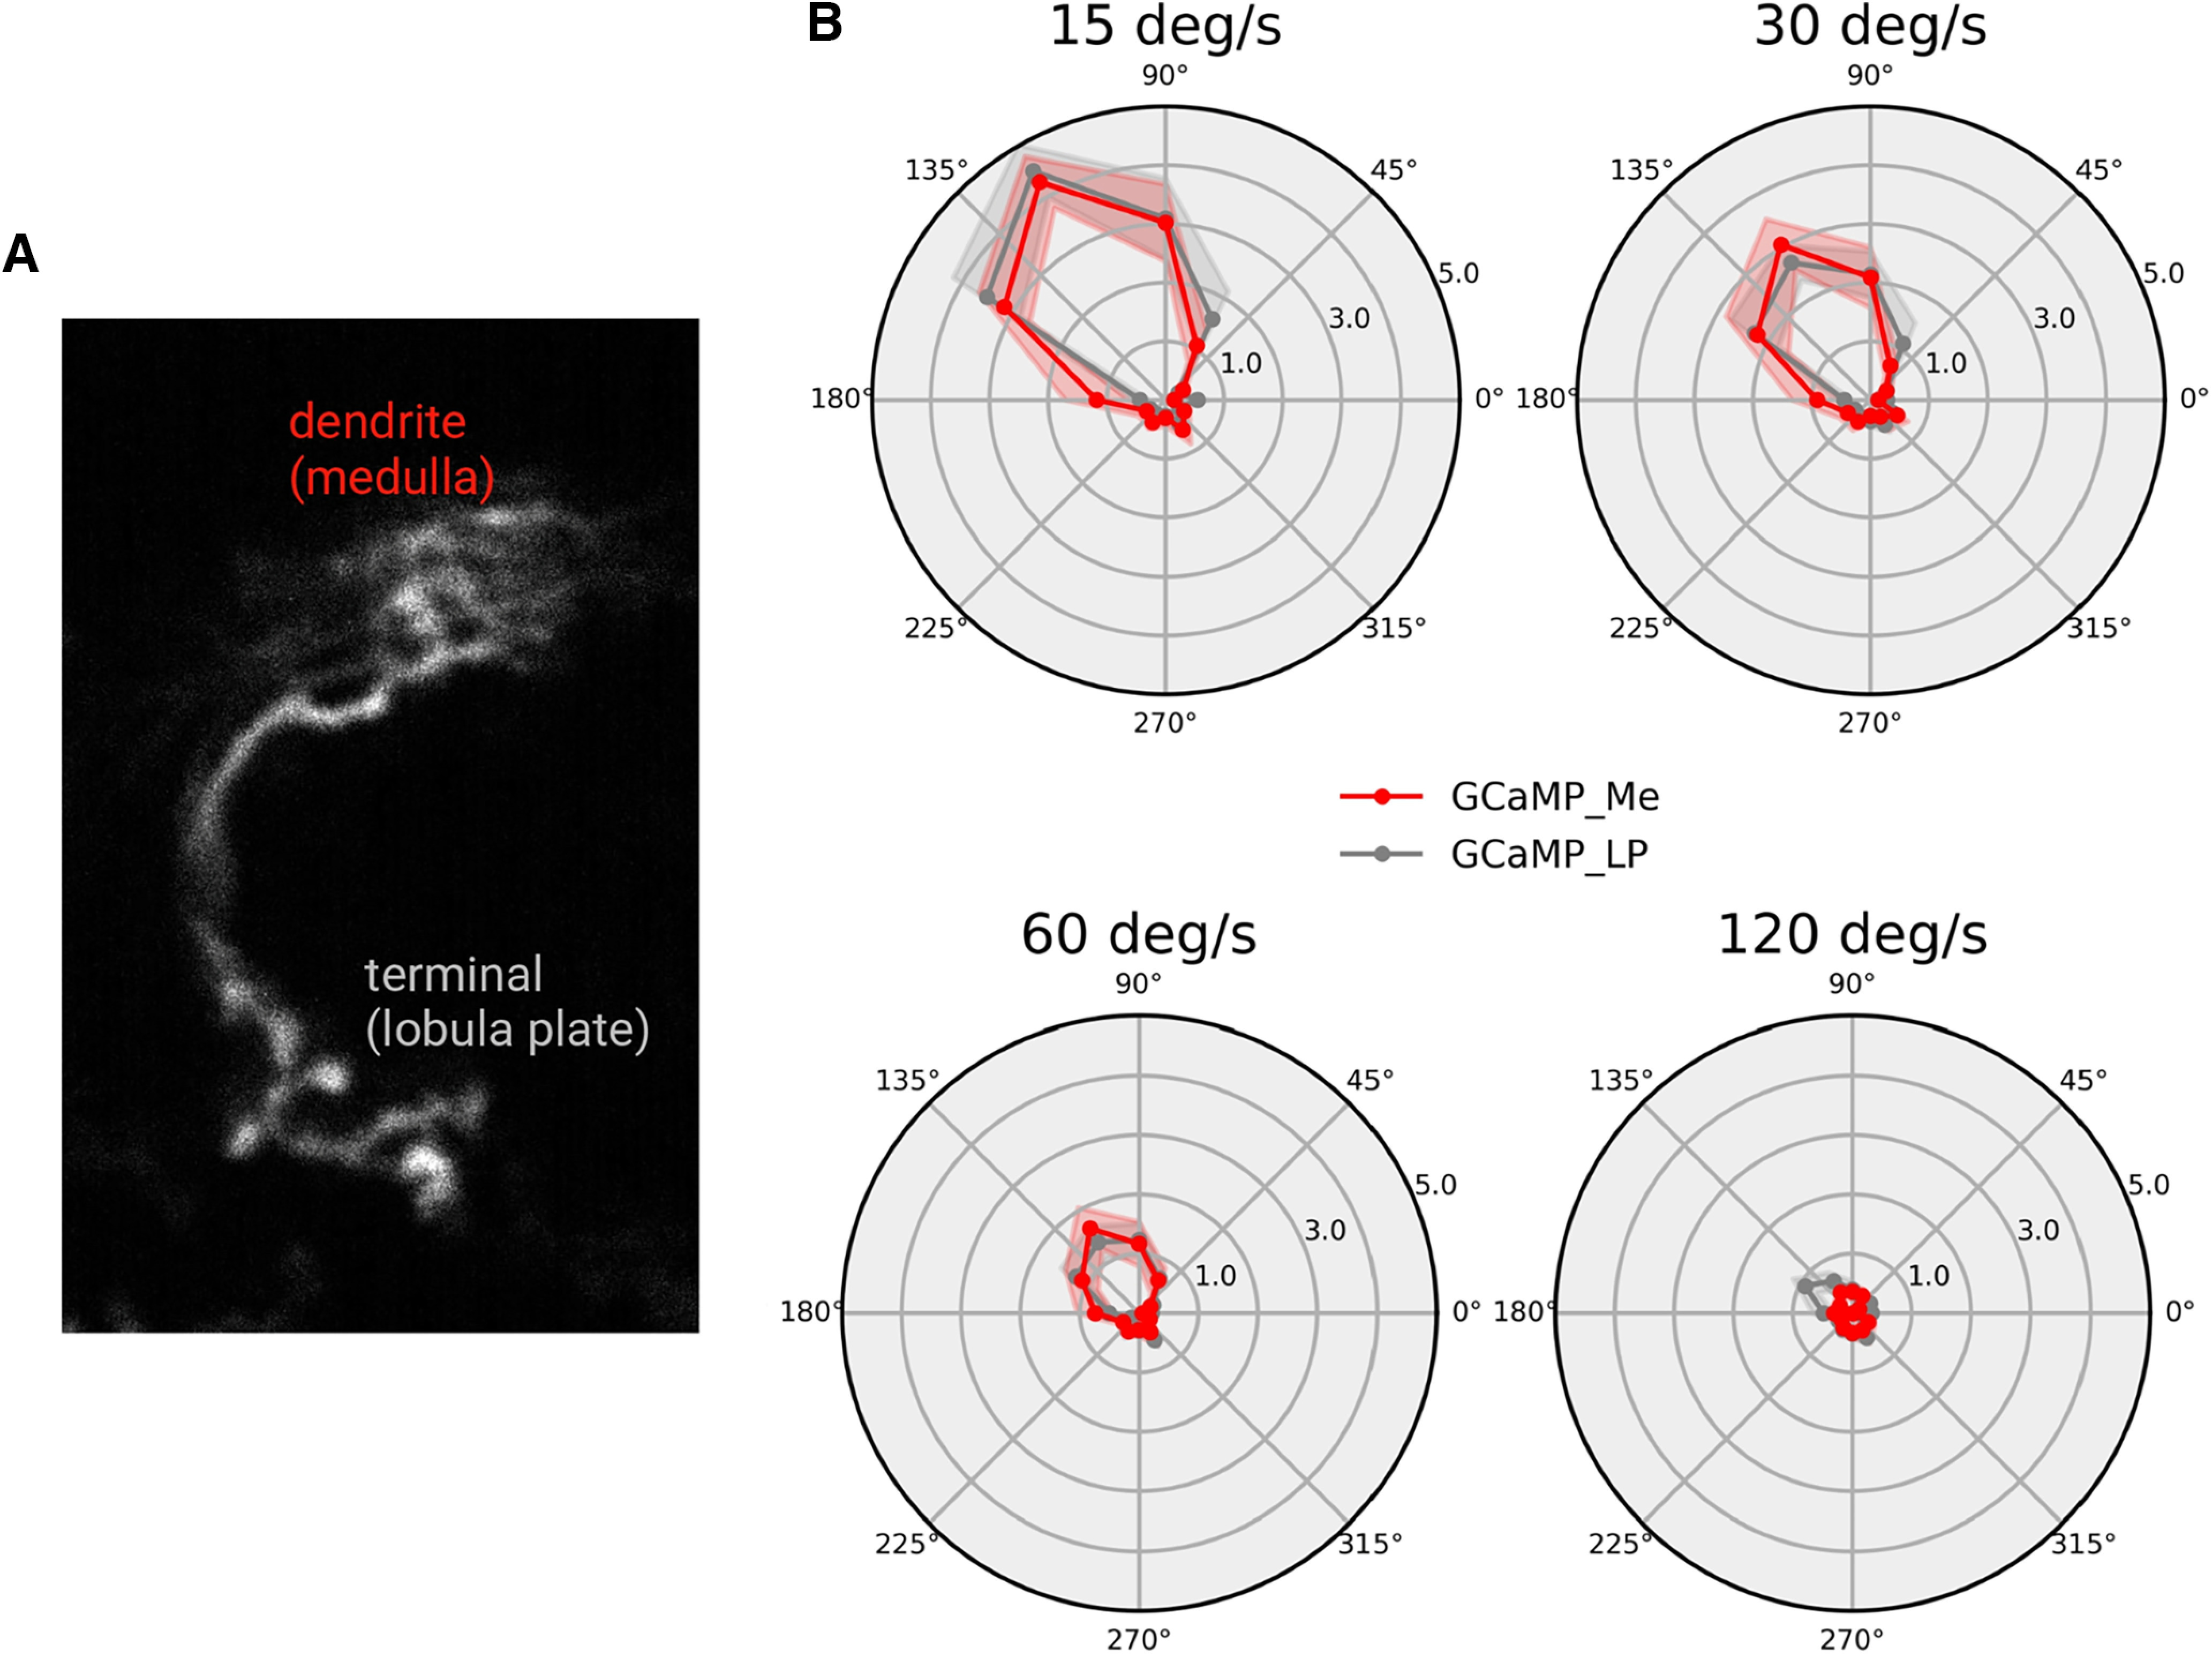
Directional tuning in the dendrite and axon terminal of single T4c cells. A, Anatomy of a single T4c cell. B, Directional tuning of single T4c cells to grating moving in 12 directions at four different speeds (dendrite red line: n = 13 ROIs from N = 5 flies; axon terminal gray line: n = 13, N = 4). Shown are the normalized peak responses (mean ± SEM) measured with GCaMP6f.
In order to see whether cells postsynaptic to T4c cells follow their voltage or their calcium signals, we performed patch-clamp recordings from VS-cells. VS-cells integrate the excitatory output of downward tuned T4d/T5d cells on their dendrite. In addition, they are inhibited via LPi neurons which in turn are excited by upward tuned T4c/T5c cells (Fig. 14B; Mauss et al., 2015). In order to isolate the excitatory input from T4d/T5d cells, we blocked synaptic transmission from T4c/T5c neurons by expressing tetanus toxin (TNT) while measuring voltage responses in VS-cells to grating stimuli moving at 30°/s in preferred and null direction (Fig. 14C,D, magenta line). As expected (Mauss et al., 2015), silencing synaptic output from T4c/T5c cells completely abolished null-direction hyperpolarization in VS-cells (Fig. 14D), while leaving the preferred direction response mediated by T4d/T5d unchanged (Fig. 14C). The only input that VS-cells receive after blocking of T4c/T5c is the direct excitatory input from T4d/T5d. Under the assumption that the voltage to calcium transformation in T4d/T5d is identical to the one measured in T4c/T5c, the directional tuning of VS-cells should reflect the one in the output signals of T4/T5 cells. The directional tuning in VS-cells (with T4c/T5c blocked) is similar to the tuning of T4c GCaMP signal (Fig. 14E, gray line). From this, we conclude that the output of T4 cells reflects the narrow tuning of its calcium signal.
Figure 14.
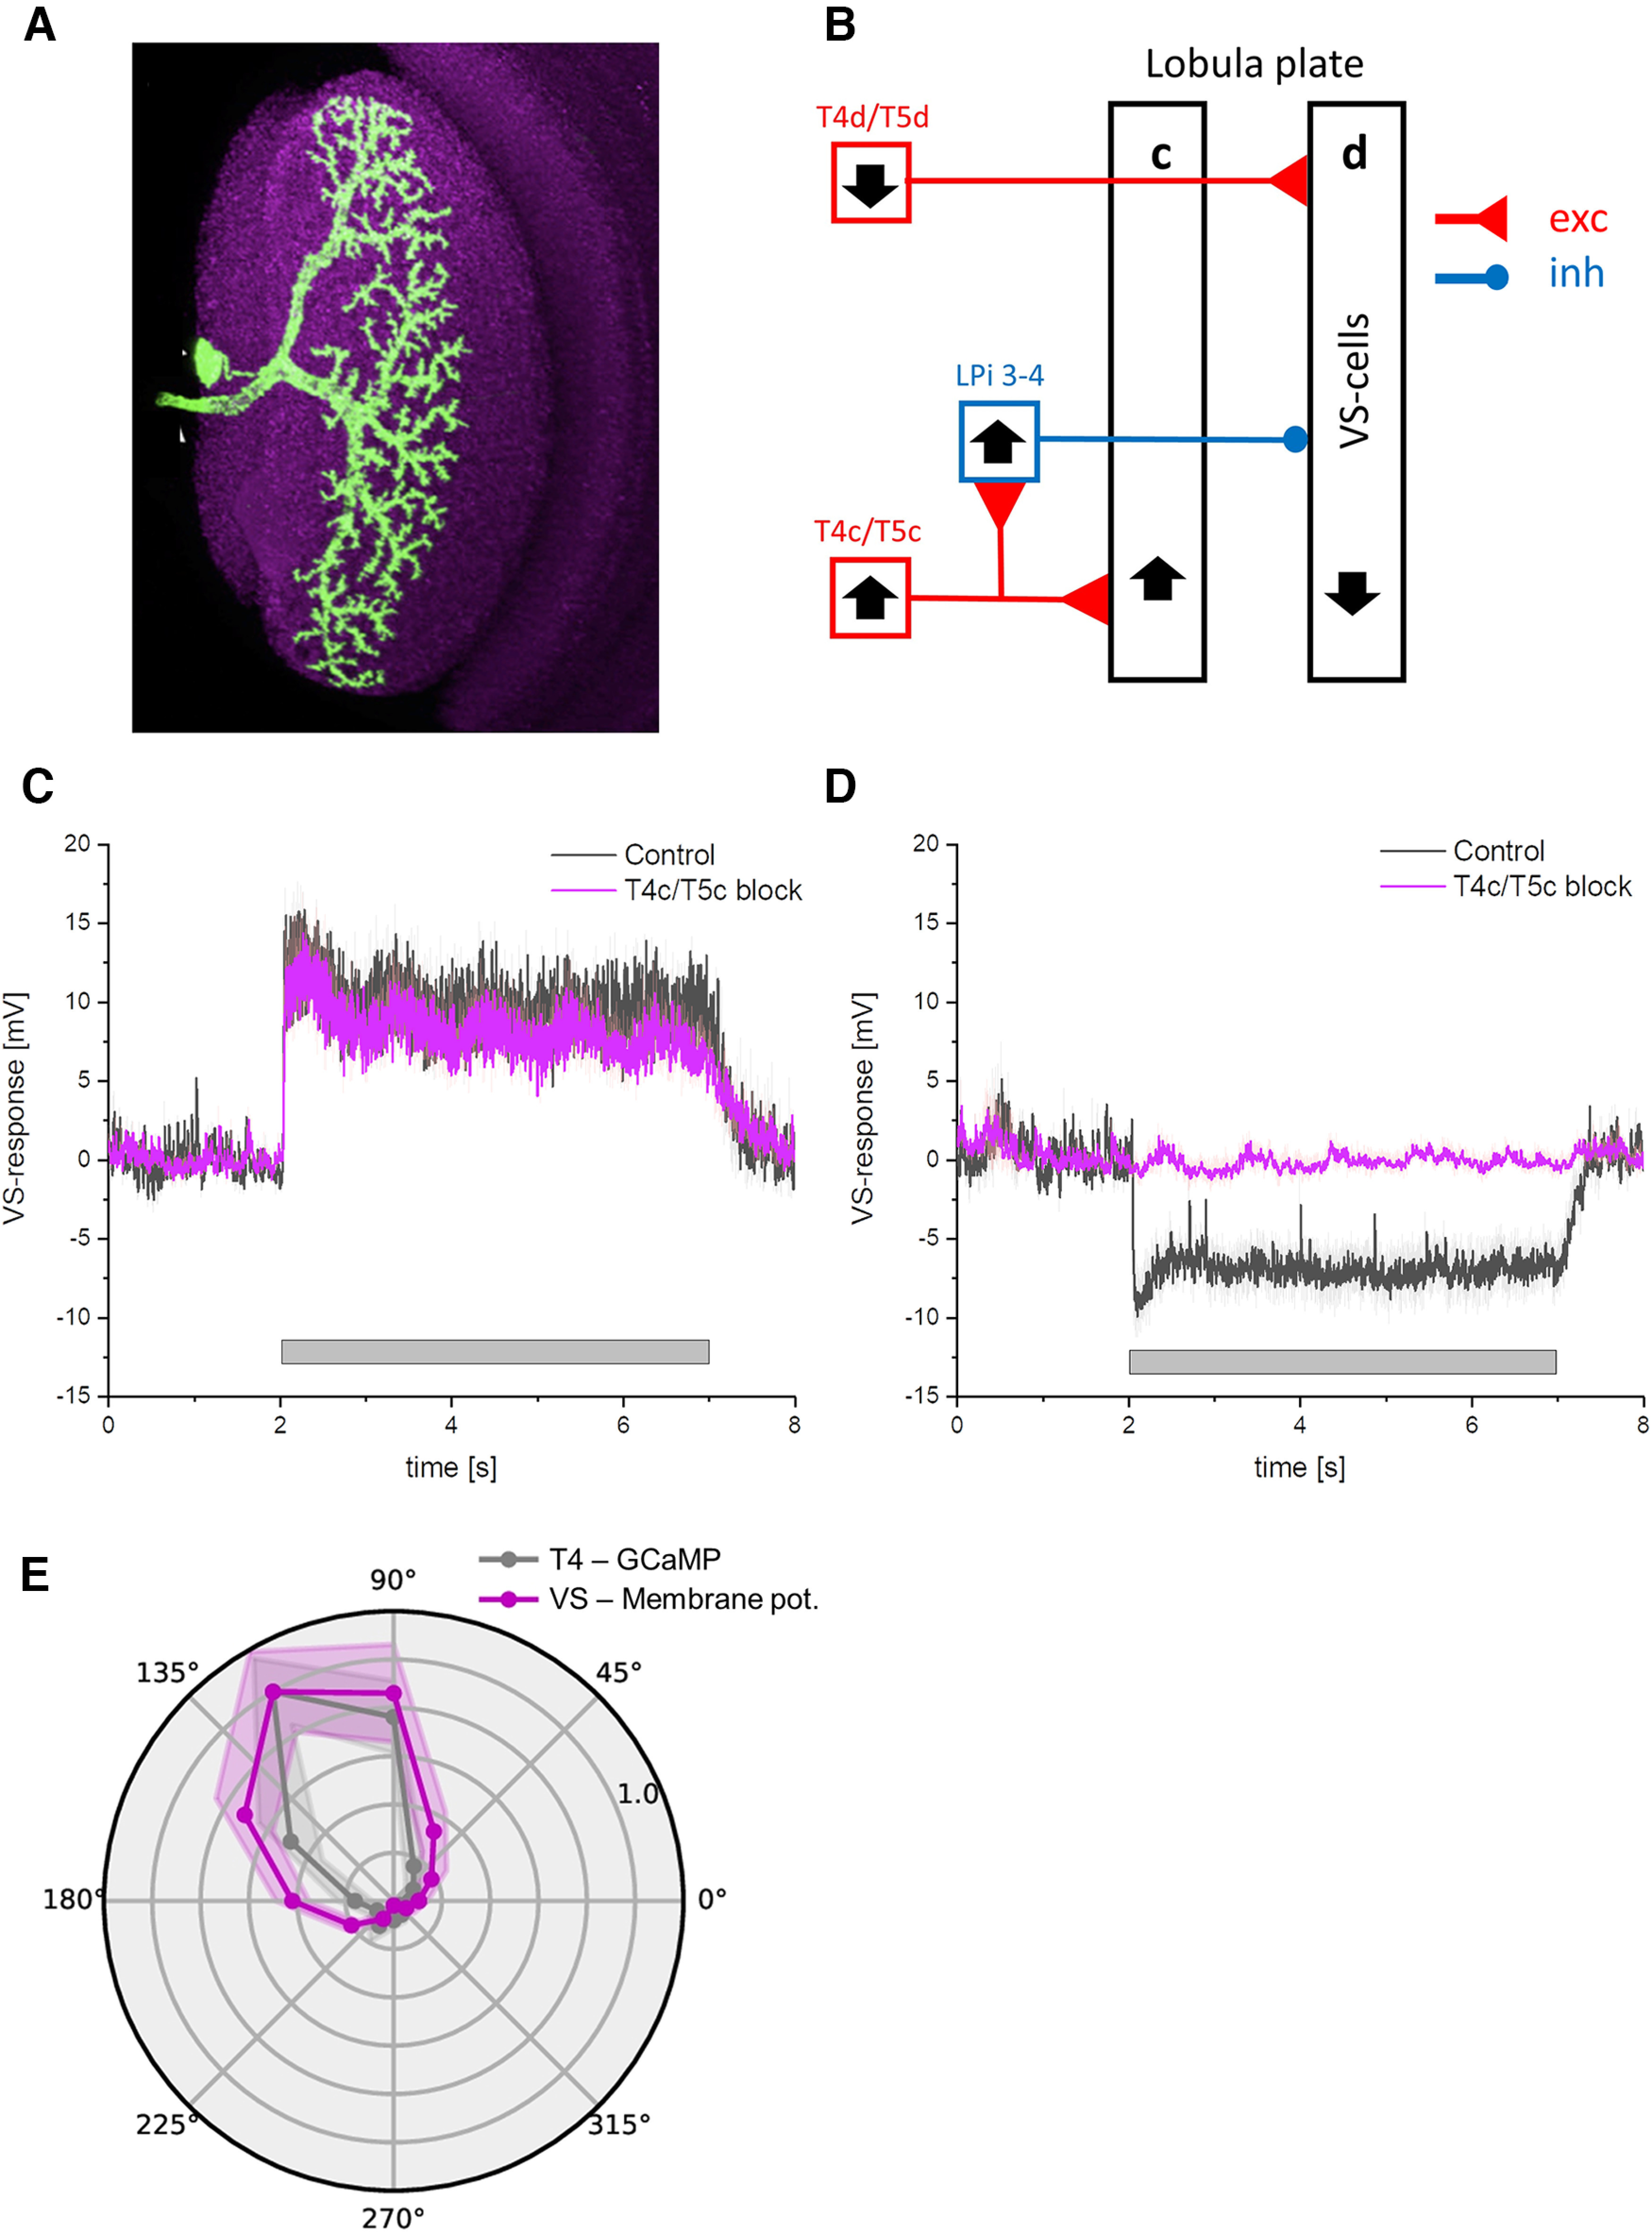
Comparison of T4 and VS-cell tuning. A, Anatomy of a single VS-cell (from Mauss et al., 2015). B, Schematic wiring diagram of VS-cells. VS-cells receive excitatory input from T4d/T5d cells and inhibitory input from LPi3-4 cells. LPi3-4 cells in turn receive excitatory input from T4c/T5c cells. Black arrows indicate the preferred direction. C, VS-cells response to grating moving in preferred direction. The black trace shows the response in control flies, the magenta trace when T4c/T5c cells are blocked with TNT. The blocking did not change the PD response. D, same as C but with grating moving in the null direction of VS-cells. Blocking of T4c/T5c led to a complete loss of the null direction response in VS-cells. E, Normalized calcium responses of T4c cells (gray) and voltage responses of VS-cells (with T4c/T5c blocked, magenta) to gratings moving along 12 directions at four different speeds (n = 9 ROIs from N = 6 flies for GCaMP6f, n = 8 cells from N = 6 flies for VS-cells). Note, to compare the tuning curves of T4c GCaMP6f and VS-cell voltage responses, we shifted the orientation tuning of downward selective (270°) VS-cells to the tuning peak of T4c cells.
Discussion
A neuron processes the input signals it receives from its presynaptic neurons and transforms them into a final transmitter output signal it provides to postsynaptic neurons. This signal flow comprises the following stages: (1) dendritic integration and processing of voltage signals; (2) transformation of voltage signals into calcium influx; and (3) transformation of calcium signals into transmitter release. Information processing can occur at different stages of this signaling cascade. In this study, we explored the transformation of voltage into calcium signals in T4 cells, the first direction-selective neurons in the Drosophila ON motion pathway. We showed that the voltage to calcium transformation enhances direction selectivity of voltage signals computed in the dendrites. By recording from postsynaptic cells, we also demonstrated that this enhanced direction selectivity of the calcium signal is indeed reflected in an enhanced direction selectivity of the transmitter output signal of T4 cells.
Electrophysiology has been the most frequently used method to measure the membrane potential changes in neurons. However, because of the small size of neurons in the optic lobe, single-cell electrophysiological recordings of these neurons have been difficult (but see Gruntman et al., 2018, 2019; Groschner et al., 2022). Genetically encoded voltage indicators (GEVIs) have evolved as powerful tools for recording changes in neuronal membrane potentials (Yang et al., 2016; Wienecke et al., 2018; Aimon et al., 2019). Optical methods of monitoring brain activity are appealing because they allow simultaneous, noninvasive monitoring of activity in many individual neurons. We used a fluorescence protein voltage sensor called ArcLight (Jin et al., 2012). ArcLight is based on the fusion of the voltage-sensing domain of Ciona intestinalis voltage-sensitive phosphatase (Murata et al., 2005) and the fluorescent protein super ecliptic pHluorin with an A227D mutation. ArcLight has been shown to robustly report both subthreshold events and action potentials in genetically targeted neurons in the intact Drosophila brain (Cao et al., 2013).
We built a model to capture voltage to calcium transformation in T4c, Mi1, and Tm3 cells. A rectilinear model with a single low-pass filter was able to reproduce calcium responses in nondirection-selective Mi1 and Tm3 cells (Figs. 9, 10), whereas a recti-nonlinear model with a supralinear function for mapping voltage onto calcium was required to reproduce T4c calcium responses (Fig. 6). The direction selectivity for the rectilinear model signals for T4c was lower compared with the recti-nonlinear model. This suggests that voltage to calcium transformation in Mi1 and Tm3 cells is different from those in T4c cells.
Differential expression of voltage-gated calcium channels in different cells could explain the different voltage to calcium transformations. Voltage-gated calcium channels mediate depolarization-induced calcium influx that drives the release of neurotransmitters. The ɑ1-subunit of the voltage-gated calcium channels forms the ion-conducting pore, which makes it distinct from other calcium channels. Three families of genes encode ɑ1 subunits. The Drosophila genome has one ɑ1 subunit gene in each family: ɑ1D (Cav1), cac (Cav2), and ɑ1T (Cav3; Littleton and Ganetzky, 2000; King, 2007). In Drosophila antennal lobe projection neurons, cac (Cav2) type and ɑ1T (Cav3) type voltage-gated calcium channels are involved in sustained and transient calcium currents, respectively (Gu et al., 2009; Iniguez et al., 2013). According to an RNA-sequencing study (Davis et al., 2020), ɑ1T (Cav3) mRNA has a higher expression level in Mi1 compared with T4 and Tm3, while cac (Cav2) mRNA has a higher expression level in T4 compared with Mi1 and Tm3. Recent experiments with expressing RNAi against cac led to a significantly faster response in Mi1 and Tm3 cells (Gonzalez-Suarez et al., 2022). The differential expressions of voltage-gated calcium channels could cause different voltage to calcium transformations in nondirection selective and direction-selective cells.
We found that the voltage to calcium transformation in T4c neurons enhances their direction selectivity: calcium signals in T4c cells have a significantly higher direction selectivity and directional tuning index compared with membrane voltage across a large set of stimuli, including different speeds, different contrasts, different directions and different spatial structures (Figs. 2–4). Using a smaller stimulus set, a previous study on T5 cells also found the calcium signal to be more directionally selective than the voltage signal (Wienecke et al., 2018). Based on their experiments, the authors made a qualitative proposal for an adaptive supralinearity to account for the voltage to calcium transformation. In contrast, we demonstrate that a static supralinearity is sufficient to quantitatively match the experimental data derived from a comprehensive stimulus set covering a large range of speeds and contrasts.
As calcium is required for neurotransmitter release (Katz and Miledi, 1967), the voltage to calcium transformation is expected to increase the direction selectivity of T4/T5 cells' output signals. In the lobula plate, T4/T5 cells provide input to large lobula plate tangential cells that are depolarized during preferred and hyperpolarized during null direction motion (Mauss et al., 2015). For example, vertical system (VS)-cells with dendrites in layer four receive direct excitatory inputs from downward-tuned T4d/T5d neurons causing depolarization during motion in the downward preferred direction. These VS cells also receive indirect inhibitory inputs from upward-tuned T4c/T5c neurons via glutamatergic LPi3-4 neurons projecting from layer three to layer four causing hyperpolarization in VS-cells during motion in the upward null direction. Upon silencing LPi3-4 neurons' synaptic output via tetanus toxin, VS neurons depolarization response in the preferred direction did not change, but the inhibition for null direction was absent (Mauss et al., 2015). Furthermore, there was no depolarizing response to stimuli moving in null direction. This suggests that T4/T5 do not release any transmitter in response to null direction motion, which matches our findings for the calcium responses in T4c cells to null direction motion. We confirmed this finding by measuring the voltage response of VS-cells to gratings moving in different directions (Fig. 14E). The directional tuning measured in VS-cells with T4c/T5c blocked followed the tuning of the calcium signal measured in the terminal region of T4 cells. Thus, voltage to calcium transformation increases direction selectivity in T4/T5 cells which in turn enhances direction selectivity in downstream neurons.
In summary, our study provides evidence that the characteristics of voltage to calcium transformation are specifically tailored to the function of T4 cells within the motion processing pathway: instead of being a mere copy of the membrane voltage required for transmitter output at a chemical synapse, this transformation represents an important processing step that enhances direction selectivity in the output signal of motion-sensing T4 cells.
Footnotes
This work was supported by the Max Planck Society. We thank Christian Theile and Romina Kutlesa for fly work and Georg Ammer for critically reading the manuscript.
The authors declare no competing financial interests.
References
- Aimon S, Katsuki T, Jia T, Grosenick L, Broxton M, Deisseroth K, Sejnowski TJ, Greenspan RJ (2019) Fast near-whole-brain imaging in adult Drosophila during responses to stimuli and behavior. PLoS Biol 17:e2006732. [DOI] [PMC free article] [PubMed] [Google Scholar]
- Ammer G, Leonhardt A, Bahl A, Dickson BJ, Borst A (2015) Functional specialization of neural input elements to the Drosophila ON motion detector. Curr Biol 25:2247–2253. [DOI] [PubMed] [Google Scholar]
- Arenz A, Drews MS, Richter FG, Ammer G, Borst A (2017) The temporal tuning of the Drosophila motion detectors is determined by the dynamics of their input elements. Curr Biol 27:929–944. [DOI] [PubMed] [Google Scholar]
- Berens P (2009) CircStat: A MATLAB Toolbox for Circular Statistics. J Stat Soft 31(10):1–21. [Google Scholar]
- Behnia R, Clark DA, Carter AG, Clandinin TR, Desplan C (2014) Processing properties of ON and OFF pathways for Drosophila motion detection. Nature 512:427–430. [DOI] [PMC free article] [PubMed] [Google Scholar]
- Borst A, Helmstaedter M (2015) Common circuit design in fly and mammalian motion vision. Nat Neurosci 18:1067–1076. [DOI] [PubMed] [Google Scholar]
- Borst A, Haag J, Mauss AS (2019) How fly neurons compute the direction of visual motion. J Comp Physiol A Neuroethol Sens Neural Behav Physiol 206:109–124. [DOI] [PMC free article] [PubMed] [Google Scholar]
- Borst A, Drews M, Meier M (2020) The neural network behind the eyes of a fly. Curr Opin Physiol 16:33–42. [Google Scholar]
- Cao G, Platisa J, Pieribone VA, Raccuglia D, Kunst M, Nitabach MN (2013) Genetically targeted optical electrophysiology in intact neural circuits. Cell 154:904–913. [DOI] [PMC free article] [PubMed] [Google Scholar]
- Chapman ER (2002) Synaptotagmin: a Ca2+ sensor that triggers exocytosis? Nat Rev Mol Cell Biol 3:498–508. [DOI] [PubMed] [Google Scholar]
- Chen TW, Wardill TJ, Sun Y, Pulver SR, Renninger SL, Baohan A, Schreiter ER, Kerr RA, Orger MB, Jayaraman V, Looger LL, Svoboda K, Kim DS (2013) Ultrasensitive fluorescent proteins for imaging neuronal activity. Nature 499:295–300. 10.1038/nature12354 [DOI] [PMC free article] [PubMed] [Google Scholar]
- Davis FP, Nern A, Picard S, Reiser MB, Rubin GM, Eddy SR, Henry GL (2020) A genetic, genomic, and computational resource for exploring neural circuit function. Elife 9:e50901. [DOI] [PMC free article] [PubMed] [Google Scholar]
- Denk W, Strickler JH, Webb WW (1990) Two-photon laser scanning fluorescence microscopy. Science 248:73–76. 10.1126/science.2321027 [DOI] [PubMed] [Google Scholar]
- Di Maio V (2008) Regulation of information passing by synaptic transmission: a short review. Brain Res 1225:26–38. [DOI] [PubMed] [Google Scholar]
- Egelhaaf M, Borst A (1989) Transient and steady-state response properties of movement detectors. J Opt Soc Am A 6:116–127. 10.1364/josaa.6.000116 [DOI] [PubMed] [Google Scholar]
- Eichner H, Joesch M, Schnell B, Reiff DF, Borst A (2011) Internal structure of the fly elementary motion detector. Neuron 70:1155–1164. [DOI] [PubMed] [Google Scholar]
- Fischbach KF, Dittrich APM (1989) The optic lobe of Drosophila melanogaster. I. A Golgi analysis of wild-type structure. Cell Tissue Res 258:441–475. [Google Scholar]
- Fisher YE, Silies M, Clandinin TR (2015) Orientation selectivity sharpens motion detection in Drosophila. Neuron 88:390–402. [DOI] [PMC free article] [PubMed] [Google Scholar]
- Gonzalez-Suarez AD, Zavatone-Veth JA, Chen J, Matulis CA, Badwan BA, Clark DA (2022) Excitatory and inhibitory neural dynamics jointly tune motion detection. Curr Biol 32:3659–3675.e8. 10.1016/j.cub.2022.06.075 [DOI] [PMC free article] [PubMed] [Google Scholar]
- Gruntman E, Romani S, Reiser MB (2018) Simple integration of fast excitation and offset, delayed inhibition computes directional selectivity in Drosophila. Nat Neurosci 21:250–257. 10.1038/s41593-017-0046-4 [DOI] [PMC free article] [PubMed] [Google Scholar]
- Gruntman E, Romani S, Reiser MB (2019) The computation of directional selectivity in the Drosophila OFF motion pathway. Elife 8:e50706. [DOI] [PMC free article] [PubMed] [Google Scholar]
- Groschner LN, Malis JG, Zuidinga B, Borst A (2022) A biophysical account of multiplication by a single neuron. Nature 603:119–123. 10.1038/s41586-022-04428-3 [DOI] [PMC free article] [PubMed] [Google Scholar]
- Gu H, Jiang SA, Campusano JM, Iniguez J, Su H, Hoang AA, Lavian M, Sun XO'Dowd DK (2009) Cav2-type calcium channels encoded by cac regulate AP-independent neurotransmitter release at cholinergic synapses in adult Drosophila brain. J Neurophysiol 101:42–53. [DOI] [PMC free article] [PubMed] [Google Scholar]
- Haag J, Denk W, Borst A (2004) Fly motion vision is based on Reichardt detectors regardless of the signal-to-noise ratio. Proc Natl Acad Sci U S A 101:16333–16338. 10.1073/pnas.0407368101 [DOI] [PMC free article] [PubMed] [Google Scholar]
- Haag J, Arenz A, Serbe E, Gabbiani F, Borst A (2016) Complementary mechanisms create direction selectivity in the fly. Elife 5:e17421. [DOI] [PMC free article] [PubMed] [Google Scholar]
- Haag J, Mishra A, Borst A (2017) A common directional tuning mechanism of Drosophila motion-sensing neurons in the ON and in the OFF pathway. Elife 6:e29044. [DOI] [PMC free article] [PubMed] [Google Scholar]
- Iniguez J, Schutte SS, O'Dowd DK (2013) Cav3-type α1T calcium channels mediate transient calcium currents that regulate repetitive firing in Drosophila antennal lobe PNs. J Neurophysiol 110:1490–1496. [DOI] [PMC free article] [PubMed] [Google Scholar]
- Isaacman-Beck J, Paik KC, Wienecke CFR, Yang HH, Fisher YE, Wang IE, Ishida IG, Maimon G, Wilson RI, Clandinin TR (2020) SPARC enables genetic manipulation of precise proportions of cells. Nat Neurosci 23:1168–1175. [DOI] [PMC free article] [PubMed] [Google Scholar]
- Jia H, Rochefort NL, Chen X, Konnerth A (2011) In vivo two-photon imaging of sensory-evoked dendritic calcium signals in cortical neurons. Nat Protoc 6:28–35. [DOI] [PubMed] [Google Scholar]
- Jin L, Han Z, Platisa J, Wooltorton JRA, Cohen LB, Pieribone VA (2012) Single action potentials and subthreshold electrical events imaged in neurons with a fluorescent protein voltage probe. Neuron 75:779–785. [DOI] [PMC free article] [PubMed] [Google Scholar]
- Joesch M, Schnell B, Raghu SV, Reiff DF, Borst A (2010) ON and OFF pathways in Drosophila motion vision. Nature 468:300–304. 10.1038/nature09545 [DOI] [PubMed] [Google Scholar]
- Katz B, Miledi R (1967) Ionic requirements of synaptic transmitter release. Nature 215:651–651. 10.1038/215651a0 [DOI] [PubMed] [Google Scholar]
- King GF (2007) Modulation of insect CaV channels by peptidic spider toxins. Toxicon 49:513–530. [DOI] [PubMed] [Google Scholar]
- Kohn JR, Portes JP, Christenson MP, Abbott LF, Behnia R (2021) Flexible filtering by neural inputs supports motion computation across states and stimuli. Curr Biol 31:5249–5260.e5. 10.1016/j.cub.2021.09.061 [DOI] [PMC free article] [PubMed] [Google Scholar]
- Leong JC, Esch JJ, Poole B, Ganguli S, Clandinin TR (2016) Direction selectivity in Drosophila emerges from preferred-direction enhancement and null-direction suppression. J Neurosci 36:8078–8092. [DOI] [PMC free article] [PubMed] [Google Scholar]
- Littleton JT, Ganetzky B (2000) Ion channels and synaptic organization: analysis of the Drosophila genome. Neuron 26:35–43. [DOI] [PubMed] [Google Scholar]
- Luo L (2020) Principles of neurobiology. New York: Garland Science. [Google Scholar]
- Maisak MS, Haag J, Ammer G, Serbe E, Meier M, Leonhardt A, Schilling T, Bahl A, Rubin GM, Nern A, Dickson BJ, Reiff DF, Hopp E, Borst A (2013) A directional tuning map of Drosophila elementary motion detectors. Nature 500:212–216. 10.1038/nature12320 [DOI] [PubMed] [Google Scholar]
- Mauss AS, Pankova K, Arenz A, Nern A, Rubin GM, Borst A (2015) Neural circuit to integrate opposing motions in the visual field. Cell 162:351–362. [DOI] [PubMed] [Google Scholar]
- Mazurek M, Kager M, Van Hooser SD (2014) Robust quantification of orientation selectivity and direction selectivity. Front Neural Circuits 8:92. 10.3389/fncir.2014.00092 [DOI] [PMC free article] [PubMed] [Google Scholar]
- Murata Y, Iwasaki H, Sasaki M, Inaba K, Okamura Y (2005) Phosphoinositide phosphatase activity coupled to an intrinsic voltage sensor. Nature 435:1239–1243. [DOI] [PubMed] [Google Scholar]
- Pologruto TA, Sabatini BL, Svoboda K (2003) ScanImage: flexible software for operating laser scanning microscopes. Biomed Eng Online 2:1–9. [DOI] [PMC free article] [PubMed] [Google Scholar]
- Salazar-Gatzimas E, Chen J, Creamer MS, Mano O, Mandel HB, Matulis CA, Pottackal J, Clark DA (2016) Direct measurement of correlation responses in Drosophila elementary motion detectors reveals fast timescale tuning. Neuron 92:227–239. [DOI] [PMC free article] [PubMed] [Google Scholar]
- Serbe E, Meier M, Leonhardt A, Borst A (2016) Comprehensive characterization of the major presynaptic elements to the Drosophila OFF motion detector. Neuron 89:829–841. [DOI] [PubMed] [Google Scholar]
- Shinomiya K, et al. (2019) Comparisons between the ON- and OFF-edge motion pathways in the Drosophila brain. Elife 8:e40025. [DOI] [PMC free article] [PubMed] [Google Scholar]
- Single S, Borst A (1998) Dendritic integration and its role in computing image velocity. Science 281:1848–1850. [DOI] [PubMed] [Google Scholar]
- Strother JA, Nern A, Reiser MB (2014) Direct observation of on and off pathways in the Drosophila visual system. Curr Biol 24:976–983. [DOI] [PubMed] [Google Scholar]
- Strother JA, Wu S, Wong AM, Nern A, Rogers EM, Le JQ, Rubin GM, Reiser MB (2017) The emergence of directional selectivity in the visual motion pathway of Drosophila. Neuron 94:168–182. [DOI] [PubMed] [Google Scholar]
- Takemura SY, Nern A, Chklovskii DB, Scheffer LK, Rubin GM, Meinertzhagen IA (2017) The comprehensive connectome of a neural substrate for 'ON' motion detection in Drosophila. Elife 6:e24394. [DOI] [PMC free article] [PubMed] [Google Scholar]
- Virtanen P, et al. (2020) SciPy 1.0: fundamental algorithms for scientific computing in Python. Nat Methods 17:261–272. [DOI] [PMC free article] [PubMed] [Google Scholar]
- Wienecke CFR, Leong JCS, Clandinin TR (2018) Linear summation underlies direction selectivity in Drosophila. Neuron 99:680–688. [DOI] [PMC free article] [PubMed] [Google Scholar]
- Yang HH, Clandinin TR (2018) Elementary motion detection in Drosophila: algorithms and mechanisms. Annu Rev Vis Sci 4:143–163. [DOI] [PMC free article] [PubMed] [Google Scholar]
- Yang HH, St-Pierre F, Sun X, Ding X, Lin MZ, Clandinin TR (2016) Subcellular imaging of voltage and calcium signals reveals neural processing in vivo. Cell 166:245–257. [DOI] [PMC free article] [PubMed] [Google Scholar]


