

Abstract
Background:
We conducted, to our knowledge, the first prospective study of particulate matter (PM) exposure and multiple sclerosis (MS) risk in two prospective cohorts: the Nurses Health Study (NHS) and the Nurses Health Study II (NHS II).
Methods:
Cumulative average exposure to different size fractions of PM up to the onset of MS was estimated using spatio-temporal models. We used multivariable Cox proportional hazards models to estimate the hazard ratios (HR) and 95% confidence intervals (CI) of MS associated with each size fraction of PM independently. We conducted additional sensitivity analyses stratified by smoking, region of the US, and age, as well as analyses restricted to women who did not move during the study. Analyses were adjusted for age, ancestry, smoking, body mass index at age 18, region, tract level population density, latitude at age 15, and UV index.
Results
We did not observe significant associations between air pollution and MS risk in our cohorts. Among women in the NHS II, the HR comparing the top vs. bottom quintile of PM was 1.11 (95% Confidence Intervals (CI): 0.74, 1.87), 1.04 (95% CI: 0.73, 1.50) and 1.09 (95% CI: 0.73, 1.62) for PM10 (≤10 microns in diameter), PM2.5 (≤2.5 microns in diameter), and PM2.5–10 (2.5 to 10 microns in diameter) respectively, and tests for linear trends were not statistically significant. No association between exposure to PM and risk of MS was observed in the NHS.
Conclusions:
In this study, exposure to PM air pollution was not related to MS risk.
Keywords: Epidemiology, Cohort Studies, Incidence Studies, Parkinson disease
INTRODUCTION
Chronic exposure to air pollution has detrimental effects on many aspects of human health,[1–5] but little is known about the effects of air pollution on risk of multiple sclerosis (MS). Previous studies have found 1) a clustering of MS cases in areas of high PM10 in Georgia [6] 2) a four-fold increase in MS relapse risk with acute pollution exposure in Finland [7] and 3) a higher risk of hospital admission for MS relapse related ambient PM10 concentrations in Italy [8] Cigarette smoking, a common air pollutant, is associated with an increase in MS risk,[9],[10, 11] suggesting that exposure to environmental chemicals, such as those found in air pollution could be an important factor. However, to our knowledge, no study to date has examined the impact of chronic exposure to air pollution and risk of MS onset.
Air pollution is a complex mixture of substances that are found in indoor and outdoor air. Air pollution includes particulate matter (PM), various gasses (such as ozone, carbon monoxide, sulfur and nitrogen oxides), airborne metals (e.g. lead, copper, manganese) and organic compounds (bacterial endotoxins and polycyclic aromatic hydrocarbons). PM is thought to be one of the more harmful components of air pollution.[12] PM is especially relevant for nervous system damage because some smaller components of PM can reach the brain and are associated with neurodegeneration.[12] Air pollution has also been associated with increased risk of other neurological diseases such as Parkinson’s disease,[13–17] autism,[18–21] Alzheimer’s disease, and reduced cognitive function.[22]
We used data from two large ongoing prospective cohort studies, the Nurses Health Study (NHS) and the Nurses Health Study II (NHS II) to prospectively examine the effects of exposure to PM on the risk of MS.
METHODS
Study Population:
The NHS was initiated in 1976 when 121,700 female registered nurses were recruited from 11 states and were between 30 and 55 years old at baseline. The NHS II was initiated in 1989 when 116,671 nurses between the ages of 25 and 42 were enrolled from 14 states. At present, there are at least ten nurses from each cohort in each of the contiguous states. In both cohorts, participants responded to a baseline questionnaire and biennial follow-up questionnaires regarding lifestyle factors and health outcomes. Residential street address for each nurse was collected at baseline and updated with every 2 year follow-up cycle. Over 90% of the participants have responded during each follow-up cycle. Detailed description of the study cohorts is provided elsewhere.[23] This study has been approved by the Institutional Review Board at the Brigham and Women’s Hospital.
MS Ascertainment:
The ascertainment of MS in the NHS and NHS II cohorts has been previously described.[24, 25] All cohort participants are asked on the biennial cohort follow-up questionnaire whether they were diagnosed with MS since the previous follow-up. Participants who report a new diagnosis are contacted for permission to request diagnostic confirmation from their treating neurologist. For cases reported prior to 2002, the certainty of diagnosis (“definite,” “probable,” “possible” or “other diagnosis”) was based on that provided by the treating neurologist. This approach had high validity relative to the Poser criteria for MS.[24] Starting in 2002, we further improved the ascertainment criteria and asked treating neurologists to provide copies of the participant’s medical record and relevant MRI reports, in addition to completing the diagnostic questionnaire. Our study MS specialist reviews all medical records sent in by the treating neurologists and determines whether each case meets the definition of MS based on the McDonald criteria for MS.[26]
Air Pollution assessment:
A detailed discussion of the assessment of exposure to PM10, PM2.5 and PM10–2.5 air pollution has been previously published.[27–29] Briefly, for PM10, generalized additive models were developed to estimate exposure for all residential addresses from 1988 through 2007[28] using monthly average PM10 data from USEPA’s Air Quality System (AQS), a nationwide network of continuous and filter-based monitors, combined with data from the Interagency Monitoring of Protected Visual Environments (IMPROVE) network, and several Harvard-based research studies. Model covariates, including population density, distance to nearest road, elevation, and urban land use, were derived using a geographic information system (GIS). For PM2.5, the approach was similar; although, because EPA AQS monitoring data for PM2.5 was not available prior to 1999, separate models were created for pre- and post-1999 PM2.5. The model for PM2.5 after 1999 was obtained in a way analogous to PM10, as described above. For the period prior to 1999, the model for PM2.5 was derived from a combination of the pre-1999 PM10 model with the spatio-temporal post-1999 PM2.5/PM10 ratio, and further refined using estimated extinction coefficients from airport visibility data. PM2.5–10 was estimated for the whole study period by subtracting model values for PM2.5 from those for PM10. In a cross-validation study that held out a sub-section of the monitors and compared predicted and observed values, the PM10, PM2.5 and PM2.5–10 models had little bias and a high degree of precision.[28, 29]
Statistical Analysis:
Participants contributed person time to the follow up period from 1988 (the date air pollution was first modeled in our cohorts) to the date of onset of the first symptoms of MS, death from any cause, or end of follow-up (31 May 2004 for NHS and 31 May 2007 for NHS II). Follow-up for MS was stopped in 2004 in NHS, due to the ageing of the cohort and MS occurring primarily earlier in life, and follow-up was stopped in 2007 because air pollution models were only available until then. We used the Cox proportional hazards model with time on a monthly scale to study the association between air pollution and risk of MS. We calculated hazard ratios (HRs) and 95% CIs for each quintile of PM exposure, as well as in a linear model for each 10 ug/m3 increase in PM. Quintiles of PM were determined on the initial dataset, and were the same for all analyses and sensitivity analyses; quintile ranges are listed in Table 1. For tests of trend, we used the median value of each quintile as a continuous variable to minimize the influence of outliers. We performed tests for trend by using the median value in each quintile as a continuous variable to allow for non-linear associations.
Table 1.
Age-Standardized Characteristics of the 102,583 participants in NHS II at baseline in 1989 and 112,595 participants in NHS at baseline in 1988 with respect to quintiles of PM2.5.
| NHS II | NHS | |||||||||
|---|---|---|---|---|---|---|---|---|---|---|
| Pollution quintile | Q1 Range: 1.4–12.1 |
Q2 Range: 12.1–14.0 |
Q3 Range: 14.0–15.7 |
Q4 Range: 15.7–17.4 |
Q5 Range: 17.4–74.6 |
Q1 Range: 0.8–11.9 |
Q2 Range: 11.9–13.8 |
Q3 Range: 13.8–15.7 |
Q4 Range: 15.7–17.6 |
Q5 Range: 17.6–61.3 |
| Age* | 34.1(4.6) | 33.8(4.7) | 33.7(4.7) | 33.6(4.7) | 33.8(4.7) | 56.2(7.3) | 54.5(7.3) | 54.7(7.2) | 54.9(7.1) | 55.5(7.1) |
| BMI at age 18 | 21.2(3.2) | 21.3(3.3) | 21.3(3.4) | 21.2(3.4) | 21.3(3.5) | 21.2(3.0) | 21.4(3.0) | 21.4(3.0) | 21.3(3.0) | 21.3(3.0) |
| Pack years smoking | 3.7(7.0) | 4.1(7.3) | 4.0(7.3) | 4.0(7.3) | 3.9(7.2) | 13.5(19.3) | 14.2(19.3) | 13.9(19.2) | 13.7(18.9) | 12.6(18.4) |
| Current Smoker % | 12.6 | 13.4 | 13.6 | 14.3 | 13.9 | 20.3 | 21.1 | 21.6 | 21.8 | 20.7 |
| Median Household Incom^ | 60,501 (20,884) | 62,628 (22,887) | 60,992 (22,713) | 59,402 (21,294) | 59,399 (24,6130) | 56202.7 (21901.1) | 67636.0 (25102.0) | 66939.3 (24684.3) | 67420.0 (26945.0) | 63887.2 (25987.9) |
| Population density (persons per tract) mean (sd)^ | 1,548 (3,186) | 3,022 (4,554) | 4,808 (9,405) | 5,241 (11,981) | 10,704 (25,823) | 2355.3 (3373.6) | 2010.8 (3033.1) | 2442.8 (3686.1) | 3028.8 (3971.3) | 6078.6 (12792.8) |
| Scandinavian Ancestry (%) | 7.1 | 4.6 | 3.7 | 3.1 | 3.5 | 4.9 | 4.2 | 3.4 | 2.7 | 3.1 |
| UV Index | 147.3 | 122.3 | 117.1 | 119.4 | 125.6 | 154.4 | 115.1 | 111.2 | 111.8 | 122.7 |
| (31.0) | (21.4) | (18.1) | (17.6) | (22.4) | (32.2) | (19.1) | (13.8) | (12.9) | (22.0) | |
| Latitude at age 15 (tier)* | ||||||||||
| North, % | 19.7 | 38.8 | 35.6 | 22.8 | 15.7 | 32.1 | 51.8 | 45.6 | 34.9 | 16.4 |
| ‘Middle’, % | 33.2 | 34.1 | 37.7 | 46.7 | 49.1 | 22.1 | 22.2 | 28.1 | 38.9 | 52.8 |
| ‘South’, % | 24.7 | 7.2 | 7.1 | 9.6 | 12.9 | 21.9 | 3.1 | 28.1 | 38.9 | 52.8 |
| Region | ||||||||||
| Northeast | 10.3 | 37.3 | 42.7 | 39.2 | 35.7 | 4.7 | 18.8 | 50.9 | 72.6 | 58.1 |
| Midwest | 29.5 | 35.5 | 34.8 | 32.2 | 26.8 | 8.8 | 5.2 | 9.2 | 12.5 | 23.9 |
| West | 17.6 | 18.0 | 6.2 | 5.8 | 24.9 | 23.4 | 18.8 | 25.5 | 11.1 | 10.3 |
| South | 42.1 | 8.8 | 15.7 | 22.4 | 12.2 | 63.1 | 57.1 | 14.4 | 3.8 | 7.6 |
Q - quintiles
census-tract level variables
some numbers do not sum to 100 because of missing data on latitude at age 18
Effect modification was assessed via the Wald test from multiplicative interaction terms. All models were adjusted for age in years and calendar period. Final analyses were additionally adjusted for smoking status (never/former/current smoker), pack years smoking, body mass index (BMI) at age 18, population density, region (northeast, midwest, west, south), tract-level household income, latitude tier at age 15: north/south/middle)[24] and state-level measures of UV index. Model covariates were chosen based on their role as known risk factors for MS (smoking, BMI at age 18, latitude at age 15) or on their association with quintile of air pollution in our datasets (median household income, population density, UV index, region of residence). Adjustment for dietary Vitamin D was not possible because of a large amount of missing data on dietary Vitamin D. We also conducted additional sensitivity analyses adjusted for season, median housing value, and Scandinavian ancestry, the addition of these covariates did not significantly impact the models. Because the relevant exposure period for MS is not well known, but is thought to extend many years, possibly into childhood or even gestation, in our primary analyses, we modeled air pollution as a time-varying cumulative average from 1988/1989 through date of MS diagnosis. We conducted additional sensitivity analyses restricted to women who did not move residences during the study, with the assumption that these women more likely to retain the same residential address prior to the study start, and their cumulative average exposure in our study is more likely to reflect their lifetime exposure. Because smoking is a known risk factor for MS, we conducted additional analyses stratified by smoking (never/ever). In the NHS, the older cohort in our study, we also conducted analyses stratified by age at baseline – this was done in an attempt to reconcile the differences in results between cohorts. Finally, because pollution composition, and thus its effect on MS risk, may differ across region of the US, we performed sensitivity analyses stratified by geographic region of the US. SAS version 9.4 (SAS Institute, Cary, NC, USA) was used in all analyses, except for pooling analyses, for which STATA (Stata Corp) was used.
RESULTS
Table 1 presents the baseline characteristics of the study participants in the two cohorts by quintile of PM2.5. The distributions of baseline characteristics across quintiles of PM10 and PM2.5–10 were similar to that for PM2.5.
The main results of the analyses in both cohorts are presented in Figure 1. The greater number of incident MS cases in NHS II (N = 408 in NHS II vs. N = 117 in NHS) was due to the younger age of the NHS II cohort at baseline and the relatively young age at which MS onsets. In NHS II, we observed an elevation in risk of MS associated with exposure to PM10, for all quintiles above the bottom quintile (Figure 1). However, the test for trend across quintiles was not statistically significant (p-trend = 0.81) and the model with PM10 modeled as a linear variable was also not significant: HR = 1.08 (95% CI: 0.89, 1.32) per 10 μg/m3 increase. No association with MS was observed for PM2.5 or PM2.5–10 (p-trend = 0.75 and 0.63 respectively) in the NHS II.
Figure 1.
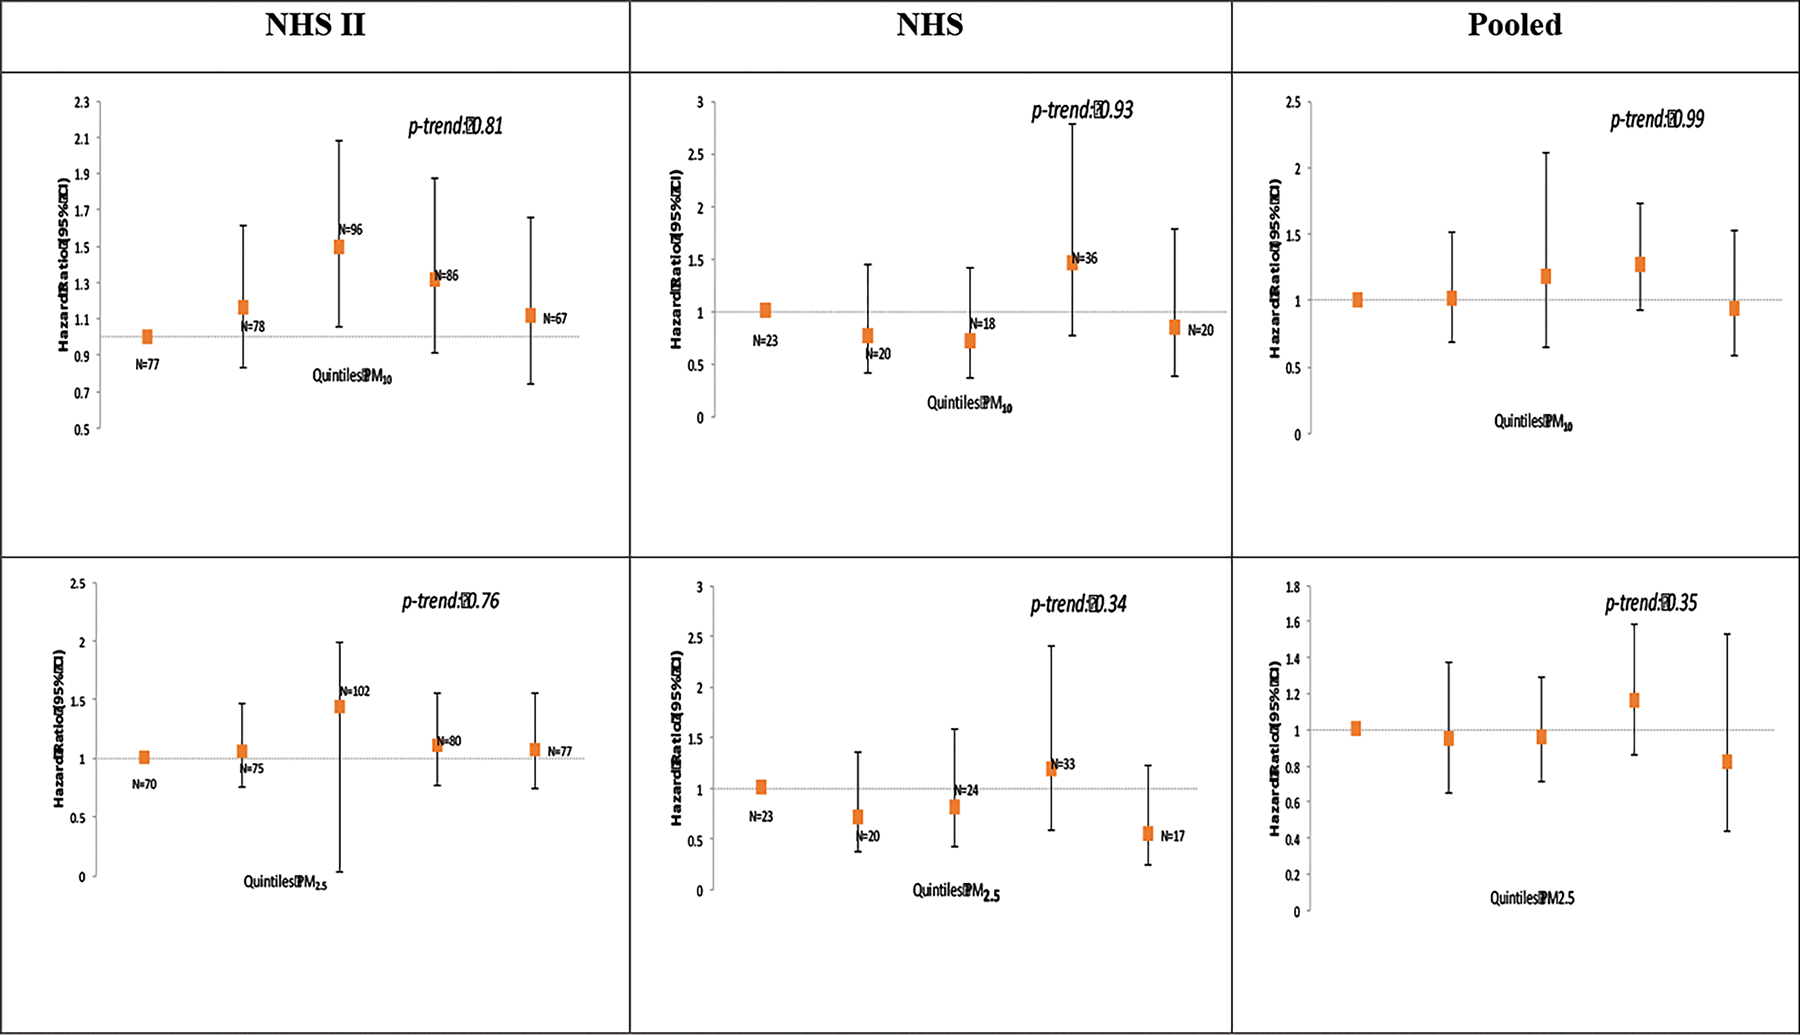
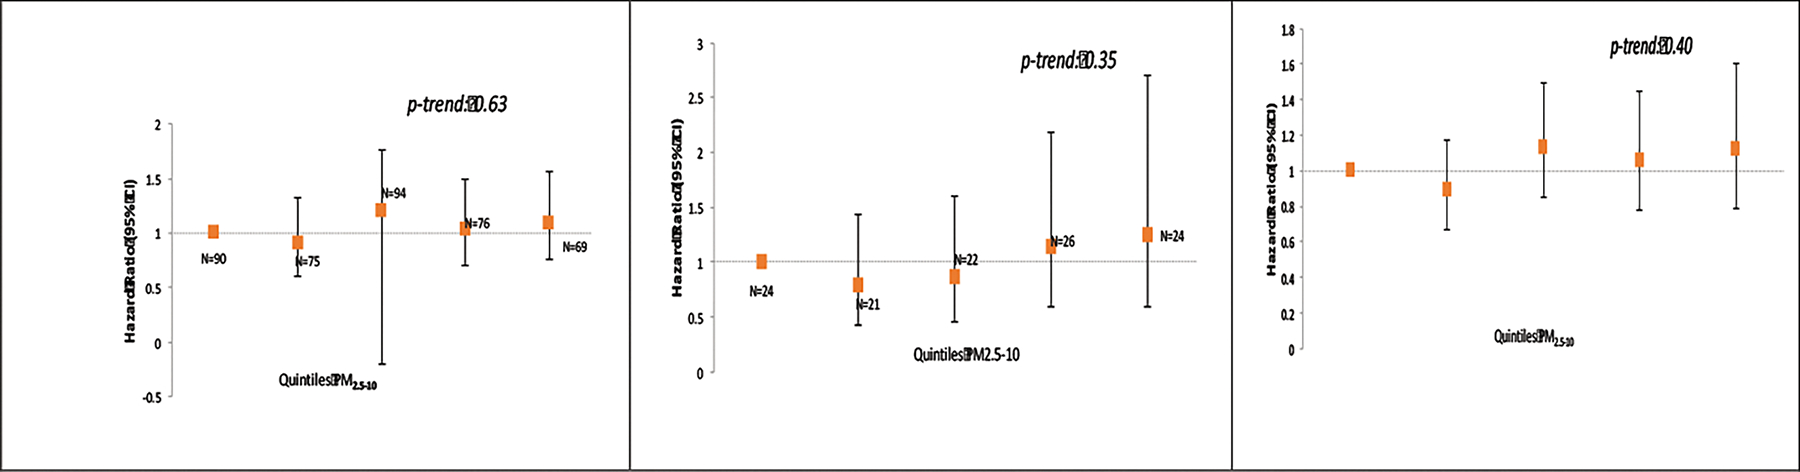
Exposure to PM10, PM2.5 and PM2.5–10, and risk of MS in the Nurses Health Study II (N = 102,583 women at baseline) and Nurses Health Study (N = 112,595 women at baseline).
Adjusted for age, smoking (never/past/current and pack years), body mass index (BMI) at age 18, population density, region (east, north, south, west), ethnicity (European Caucasian, Scandinavian, other Caucasian and non-white), latitude at age 15 tier (northern, middle, southern states), tract level income, and UV index.
In the NHS, we did not observe any association between exposure to any of the particulate fractions and risk of MS. The HR comparing the top category of exposure was 0.84 (95% CI: 0.39, 1.79; p-trend: 0.93) for PM10, 0.55 (95% CI: 0.25, 1.22; p-trend: 0.34) for PM2.5 and 1.25 (95% CI: 0.59, 2.70; p-trend: 0.35) for PM2.5–10.
In analyses stratified by smoking status (never vs. ever), we observed conflicting results between NHS II and NHS. In the NHS II, we observed elevated, although not significantly risk of MS associated with air pollution exposure, among ever smokers, and the p-interaction was significant for PM10 (p-int: 0.03) and PM2.5 (p-int: 0.01). However, in the NHS, we observed the opposite result, air pollution appeared to increase risk of MS somewhat in never smokers, but not in ever smokers, particularly for PM2.5 (p-int = 0.03) and PM2.5–10 (p-int: 0.008).
Results of sensitivity analyses restricted to nurses who did not move during the study were similar to the main analyses (Table 3). In the NHS II, the HR comparing women in the top to bottom quintiles of PM exposure was 1.11 (95%CI: 0.74, 1.66; p-trend: 0.81) for PM10, 1.07 (95% CI: 0.73, 1.54: p-trend: 0.75) for PM2.5 and 1.22 (95% CI: 0.83, 1.80; p-trend 0.72) for PM10–2.5. In the NHS, the corresponding HR’s were 0.56 (95% CI: 0.24, 1.29; p-trend: 0.52) for PM10, 0.40 (95% CI: 0.17, 0.90: p-trend: 0.16) for PM2.5 and 0.78 (95% CI: 0.33, 1.86; p-trend: 0.97) for PM2.5–10.
Table 3.
Exposure to PM10, PM2.5 and PM2.5–10, and risk of MS among women who did not move during follow-up in the Nurses Health Study II (N = 115,488 women) and Nurses Health Study (N = 117,291 women).
| NHS II | NHS | ||||||||||
|---|---|---|---|---|---|---|---|---|---|---|---|
|
| |||||||||||
| Exposure | Cases | PY | HR age-adj | HR multiv* | P-trend | Exposure | Cases | PY | HR age-adj | HR multiv* | P-trend |
|
| |||||||||||
| PM10 | PM10 | ||||||||||
| Q1 | 77 | 404541 | 1.00 (ref) | 1.00 (ref) | Q1 | 19 | 259095 | 1.00 (ref) | 1.00 (ref) | ||
| Q2 | 78 | 404545 | 0.99 (0.72, 1.36) | 1.16 (0.83, 1.61) | Q2 | 13 | 259103 | 0.61 (0.30, 1.23) | 0.59 (0.29, 1.22) | ||
| Q3 | 96 | 404545 | 1.21 (0.89, 1.63) | 1.49 (1.06, 2.08) | Q3 | 17 | 259120 | 0.73 (0.38, 1.41) | 0.72 (0.36, 1.47) | ||
| Q4 | 86 | 404550 | 1.07 (0.78, 1.45) | 1.31 (0.91, 1.87) | Q4 | 31 | 259136 | 1.22 (0.68, 2.17) | 1.23 (0.64, 2.44) | ||
| Q5 | 67 | 404554 | 0.83 (0.59, 1.16) | 1.11 (0.74, 1.66) | 0.81 | Q5 | 15 | 259142 | 0.56 (0.28, 1.10) | 0.56 (0.24, 1.29) | 0.52 |
|
| |||||||||||
| Linear | 404 | 4045715 | 0.92 (0.78, 1.07) | 1.08 (0.89, 1.32) | Linear | 95 | 2592940 | 0.84 (0.60, 1.18) | 0.80 (0.51, 1.27) | ||
|
| |||||||||||
| PM2.5 | PM2.5 | ||||||||||
| Q1 | 70 | 404543 | 1.00 (ref) | 1.00 (ref) | Q1 | 22 | 259094 | 1.00 (ref) | 1.00 (ref) | ||
| Q2 | 75 | 404542 | 1.05 (0.76, 1.45) | 1.05 (0.75, 1.46) | Q2 | 12 | 259104 | 0.49 (0.24, 0.99) | 0.41 (0.20, 0.85) | ||
| Q3 | 102 | 404543 | 1.42 (1.05, 1.92) | 1.44 (1.04, 1.98) | Q3 | 17 | 259119 | 0.65 (0.35, 1.23) | 0.52 (0.26, 1.06) | ||
| Q4 | 80 | 404549 | 1.09 (0.79, 1.51) | 1.10 (0.77, 1.55) | Q4 | 28 | 259130 | 1.01 (0.57, 1.77) | 0.80 (0.40, 1.62) | ||
| Q5 | 77 | 404558 | 1.05 (0.75, 1.46) | 1.07 (0.73, 1.54) | 0.75 | Q5 | 16 | 259151 | 0.49 (0.25, 0.94) | 0.40 (0.17, 0.90) | 0.16 |
|
| |||||||||||
| Linear | 404 | 4045715 | 1.10 (0.80, 1.50) | 1.15 (0.79, 1.66) | Linear | 95 | 2592939 | 0.72 (0.39, 1.33) | 0.58 (0.25, 1.33) | ||
|
| |||||||||||
| PM2.5–10 | PM2.5–10 | ||||||||||
| Q1 | 79 | 404541 | 1.00 (ref) | 1.00 (ref) | Q1 | 18 | 259096 | 1.00 (Ref) | 1.00 (Ref) | ||
| Q2 | 92 | 404543 | 1.13 (0.83, 1.53) | 1.23 (0.91, 1.68) | Q2 | 17 | 259118 | 0.82 (0.42, 1.59) | 0.75 (0.38, 1.47) | ||
| Q3 | 91 | 404549 | 1.10 (0.81, 1.49) | 1.25 (0.90, 1.72) | Q3 | 19 | 259128 | 0.84 (0.44, 1.60) | 0.79 (0.40, 1.55) | ||
| Q4 | 68 | 404549 | 0.83 (0.59, 1.45) | 1.00 (0.70, 1.44) | Q4 | 25 | 259126 | 1.12 (0.61, 2.07) | 1.15 (0.57, 2.30) | ||
| Q5 | 74 | 404553 | 0.90 (0.65, 1.24) | 1.22 (0.83, 1.80) | 0.72 | Q5 | 16 | 259128 | 0.72 (0.36, 1.41) | 0.78 (0.33, 1.86) | 0.97 |
|
| |||||||||||
| Linear | 404 | 4045715 | 0.81 (0.65, 1.01) | 1.07 (0.80, 1.43) | Linear | 95 | 2592939 | 0.85 (0.53, 1.37) | 0.85 (0.42, 1.74) | ||
adjusted for age, smoking (never/past/current and pack years), body mass index (BMI) at age 18, population density, region (east, north, south, west), ethnicity (European Caucasian, Scandinavian, other Caucasian and non-white), latitude at age 15 tier (northern, middle, southern states), tract level income, and UV index.
PM exposure is calculated as a cumulative average up to disease onset.
In analyses stratified by region (Northeast, Midwest, West, and South), shown in Figure 2, we did not observe significant associations between exposure to air pollution and risk of MS in any of the four regions in the study. There appeared to be modest evidence of somewhat elevated risk in the Midwest region in the NHS II, but this effect was not consistent across PM sizes and was not noted in the NHS.
Figure 2.
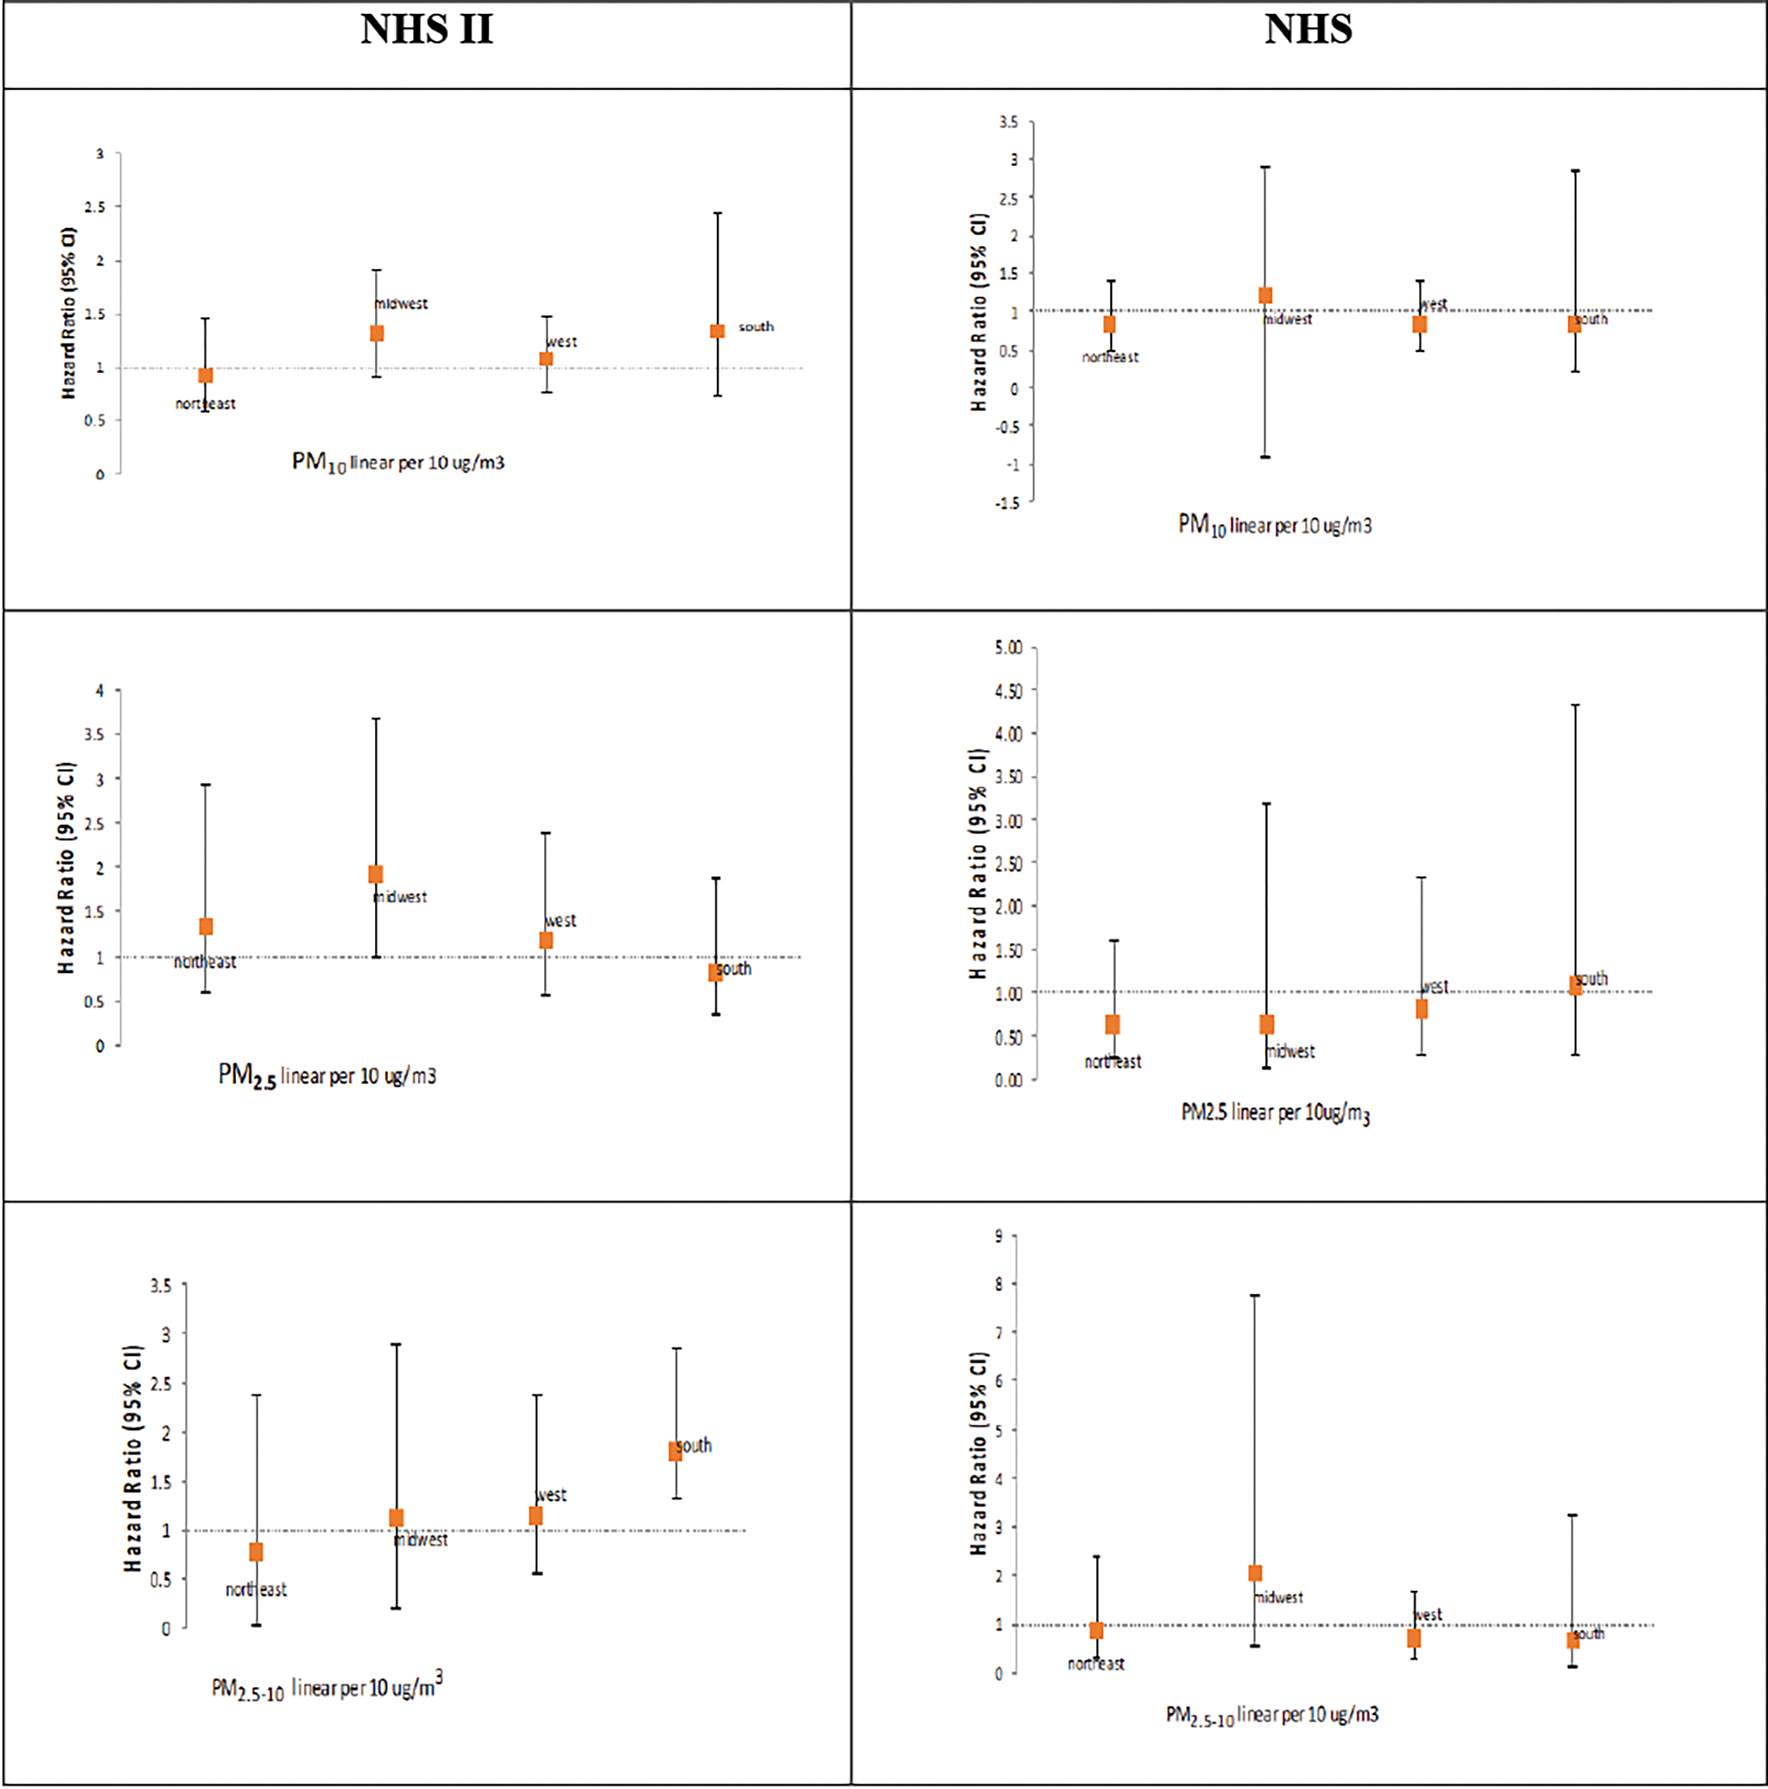
Risk of MS associated with 10ug/m3 increase in PM10, PM2.5 and PM2.5–10, stratified by region of the US in the NHS II and NHS.
*all models stratified by region are adjusted for smoking (ever/never and pack years), and population density, with the exception of the model for west region in NHS, which is adjusted for smoking only (as addition of population density in the model resulted in loss of convergence).
In an attempt to account for the baseline age difference between the two cohorts, we conducted additional analyses in NHS II, the younger cohort in the study, stratified by age (Table 4). We performed separate analyses among women younger than 34 years old (the median age at baseline in NHS II) and those 34 years old or older at baseline. In these analyses, we found some evidence for interaction between age and air pollution exposure, with higher HR estimates higher for all quintiles among participants older than 34, compared to those younger than 34 years at baseline (p-int = 0.002 for PM10, 0.001 for PM2.5 and 0.009 for PM2.5–10).
Table 4.
Exposure to PM10, PM2.5 and PM2.5–10, and risk of MS among women in NHS II, stratified by age at baseline in the NHS II (N = 49,554 women younger than 34 years old and N = 65,934 women older than 34) years old.
| OLDER than 34 at Baseline | YOUNGER THAN 34 at baseline | |||||||||
|---|---|---|---|---|---|---|---|---|---|---|
|
| ||||||||||
| Exposure | Cases | PY | HR age-adj | HR multiv* | Exposure | Cases | PY | HR age-adj | HR multiv* | p-int |
|
| ||||||||||
| PM10 | PM10 | |||||||||
| Q1 | 31 | 174747 | 1.00 (ref) | 1.00 (ref) | Q1 | 48 | 229793 | 1.00 (ref) | 1.00 (ref) | |
| Q2 | 38 | 174747 | 1.02 (0.67, 1.55) | 1.16 (0.75, 1.79) | Q2 | 53 | 229796 | 0.91 (0.56, 1.47) | 1.08 (0.65, 1.78) | |
| Q3 | 33 | 174749 | 1.40 (0.95, 2.07) | 1.68 (1.09, 2.60) | Q3 | 61 | 229800 | 0.88 (0.54, 1.43) | 1.11 (0.65, 1.89) | |
| Q4 | 26 | 174749 | 1.22 (0.82, 1.82) | 1.46 (0.92, 2.33) | Q4 | 45 | 229800 | 0.73 (0.44, 1.22) | 0.92 (0.51, 1.66) | |
| Q5 | 25 | 174752 | 0.83 (0.53, 1.28) | 1.09 (0.64, 1.84) | Q5 | 44 | 229799 | 0.68 (0.40, 1.16) | 0.94 (0.49, 1.81) | |
|
| ||||||||||
| Linear | 251 | 2298167 | 0.90 (0.74, 1.00) | 1.04 (0.81, 1.34) | Linear | 251 | 2298166 | 0.83 (0.63, 1.10) | 1.04 (0.73, 1.47) | 0.002 |
|
| ||||||||||
| PM2.5 | PM2.5 | |||||||||
| Q1 | 33 | 174747 | 1.00 (Ref) | 1.00 (Ref) | Q1 | 37 | 229796 | 1.00 (ref) | 1.00 (ref) | |
| Q2 | 30 | 174748 | 1.24 (0.80, 1.91) | 1.21 (0.78, 1.88) | Q2 | 45 | 229794 | 0.82 (0.49, 1.34) | 0.84 (0.50, 1.40) | |
| Q3 | 48 | 174748 | 1.44 (0.94, 1.18) | 1.41 (0.91, 2.18) | Q3 | 54 | 229794 | 1.31 (0.84, 2.05) | 1.39 (0.86, 2.24) | |
| Q4 | 22 | 174750 | 1.40 (0.92, 2.13) | 1.35 (0.86, 2.12) | Q4 | 58 | 229795 | 0.61 (0.35, 1.04) | 0.66 (0.37, 1.18) | |
| Q5 | 20 | 174752 | 1.30 (0.84, 2.00) | 1.28 (0.79, 2.07) | Q5 | 57 | 229806 | 0.52 (0.29, 0.93) | 0.57 (0.30, 1.09) | |
|
| ||||||||||
| Linear | 251 | 2298166 | 1.20 (0.82, 1.76) | 1.19 (0.75, 1.88) | Linear | 251 | 2298166 | 0.76 (0.45, 1.29) | 0.92 (0.49, 1.72) | 0.0001 |
|
| ||||||||||
| PM2.5–10 | PM2.5–10 | |||||||||
| Q1 | 32 | 174748 | 1.00 (ref) | 1.00 (ref) | Q1 | 48 | 229793 | 1.00 (Ref) | 1.00 (Ref) | |
| Q2 | 37 | 174747 | 0.91 (0.61, 1.34) | 1.00 (0.66, 1.49) | Q2 | 53 | 229796 | 0.65 (0.39, 1.07) | 0.74 (0.44, 1.24) | |
| Q3 | 31 | 174749 | 0.92 (0.78, 1.64) | 1.34 (0.89, 2.00) | Q3 | 61 | 229800 | 0.75 (0.47, 1.21) | 0.92 (0.55, 1.24) | |
| Q4 | 23 | 174749 | 1.13 (0.48, 1.10) | 0.90 (0.56, 1.43) | Q4 | 45 | 229799 | 0.86 ().54, 1.37) | 1.13 (0.66, 1.93) | |
| Q5 | 30 | 174751 | 0.88 (0.50, 1.12) | 1.10 (0.66, 1.84) | Q5 | 44 | 229803 | 0.61 (0.36, 1.03) | 0.88 (0.46, 1.71) | |
| Linear | 153 | 1747548 | 0.76 (0.57, 0.99) | 1.11 (0.68, 1.79) | Linear | 251 | 2592939 | 0.82 (0.56, 1.18) | 0.97 (0.67, 1.41) | 0.009 |
adjusted for age, smoking (never/past/current and pack years), body mass index (BMI) at age 18, population density, region (east, north, south, west), ethnicity (European Caucasian, Scandinavian, other Caucasian and non-white), latitude at age 15 tier (northern, middle, southern states), tract level income, and UV index.
PM exposure is calculated as a cumulative average up to two years prior to the disease onset.
DISCUSSION
In this study in two large prospective cohorts of female nurses, we did not find a consistent association between exposure to different types of particulate matter air pollution and risk of MS. Our sensitivity analyses suggested a potential interaction with smoking and with age, but those results were not consistent across the two cohorts.
Air pollution is thought to raise the risk of neurological disease by promoting neuroinflammation, oxidative stress, glial activation and cerebrovascular damage.[12] While some components of air pollution, such as black carbon, have been linked directly with increased pathology, the exact mechanism of how air pollution might cause Central Nervous System (CNS) damage has not yet been identified.[12, 30] The harmful processes are thought to result either directly by transport of (nanosized) particles into the CNS[31] or, indirectly, as a result of systemic inflammation and oxidative stress.[32, 33] Inflammation and oxidative stress are increasingly recognized as important contributors of CNS disease[34] and air pollution is one of the major environmental contributors to these processes. The harmful effects to the nervous system are thought to be caused by the physical damage from the particles themselves as well as by a variety of toxic compounds, including polyaromatic hydrocarbons and viruses that travel on the surface of the particles.[12] Smaller particles, PM2.5 and especially ultrafine PM are particularly relevant to the CNS, as they are more apt to cross the blood-air barrier of the lungs and potentially the blood-brain barrier (BBB) and cause direct damage to the CNS.[12] Specific to MS, exposure to air pollution may impact risk and progression of disease through several mechanisms, outlined below.
Pollution has been shown to have immuno-modulatory effects.[35] In prior studies, the levels of total immunoglobulin (Ig)E in children were significantly higher during episodes of high PM pollution exposure[36] and levels of alveolar macrophages, neutrophils and T-lymphocytes in the bronchoalveolar lavage fluid (BALF) were higher among participants exposed to increased levels of diesel exhaust particles.[37] Studies have related exposure to elevated levels of air pollution to autoimmune disorders such as systemic lupus erythematous[38] and inflammatory bowel disease[39] and have reported a relation between roadway proximity and rheumatoid arthritis[40] although much is left to learn about the effects of air pollution in autoimmune disease. Smaller components of air pollution, such as nano-sized particles, can potentially cross the BBB, where they can activate innate immune responses.[12, 30]
Pollution exposure could also predispose individuals to MS by disrupting the BBB, a potentially initiating event in the onset of MS.[41] In a study of children and young adults in Mexico city, exposure to high levels of air pollution was associated with significant disruption of the BBB[42] and in another study, exposure to diesel particles was linked to P-glycoprotein up-regulation indicative of impairment at the BBB.[43]
Components of air pollution could also have direct toxic effects on the CNS. Exposure to air pollution could raise MS risk by increasing the frequency and severity of respiratory infections.[44]
An ecologic study of MS in Georgia, found a clustering of MS cases in areas of high PM10. However, that study should be interpreted with caution due to its ecologic design.[6] In a retrospective study of PM10 and MS relapse in Finland, participants in the highest quartile of PM10 exposure were at over a 4-fold increased risk of MS relapse.[7] That study focused on MS relapse only, and to our knowledge, no study to date has examined the association between exposure to air pollution and MS incidence. Recently, a higher risk of hospital admission for MS relapse was reported by a study that related ambient PM10 concentrations from 53 monitoring cites to rates of MS hospitalization rates in Lombardy region, Italy.[8] However, that study was limited by it’s use of admissions records for MS relapse, use of ambient air pollution exposure and only studied PM10.
To our knowledge, ours is the first study to estimate MS risk with relation to air pollution exposure. In our study, we did not observe significant associations between exposure to PM air pollution and risk of MS in our main analyses. The pooled estimate combining NHS and NHS II for the main effect of air pollution comparing the top to bottom PM quintiles, was 0.94 (95% CI: 0.58–1.52) for PM10, 0.82 (95% CI: 0.44–1.53) for PM2.5 and 1.12 (95% CI: 0.79, 1.60) for PM2.5–10.
The finding of an increased MS risk associated with exposure to PM10 and PM2.5 among smokers in NHS II needs to be confirmed in future studies. It is possible that smokers may have an increased predisposition to the deleterious effects of air pollution. In a recent study by Hedstrom et al, passive smokers who never smoked themselves were at a 30% increased risk of MS as compared to never smokers who had never been exposed to passive smoking.[45] The increased risk grew with longer duration of exposure to passive smoking with an 80% increase in risk of MS among those exposed to passive smoking for 20 years or longer. Most of the proposed mechanisms that link smoking to MS risk operate through immune dysregulation. Leucocyte counts in peripheral blood are elevated in smokers[46], as are key markers of inflammation and autoimmune disease.[47] In prior work by Hedstrom et al, exposure to chewing tobacco, was not associated with MS risk.[48] Hedstrom thus postulated that the deleterious effects of smoke on MS risk occur through irritation of the lungs.[45] It is possible that the pro-inflammatory and lung irritating effects of air pollution on its own are not sufficient to raise MS risk, but when combined with smoking, the extent of inflammation becomes sufficient to raise MS risk. We observed an interaction with smoking and an increased risk among smokers only in NHS II, the younger cohort in our study with more MS cases. This interaction was observed in the opposite direction in NHS (air pollution associated with increased risk of MS among never smokers, but not among ever-smokers) and the reason for this difference between the two cohorts is unclear. However, stratified analyses in NHS were subject to very limited power due to the smaller sample size in that cohort. There was overlap in the confidence intervals of the results of the two studies.
Our study benefited from a large size, using data from two large prospective cohorts of women with long follow-up and a high response rate. Air pollution data used in the study was based on model-based predictions of PM10, PM2.5, and PM2.5–10 levels estimated at each participant’s residential address on a monthly basis. We used GIS-based covariates in our air pollution model to account for small-scale variations in pollution around each woman’s address, improving our estimate of air pollution. Because the nurses in these studies now live throughout the whole continental US, we had a good range of pollution levels that are representative of those commonly experienced by residents of the US.
In extensive validation studies, the pollution models used in this study have been shown to have high precision and little bias.[49, 50] However, our study has several limitations. The air pollution measures only cover the exposure that the cohort participants experienced during adulthood. To address this limitation, we performed sensitivity analyses among participants who did not move throughout the study, with the assumption that the relative air pollution exposure levels of these participants prior to study baseline paralleled those observed in this study. Also, the air pollution measures in this study were based on outdoor predictions, and we did not have information about the proportion of time that the participants spent in or out-of doors at their residential address. Some degree of misclassification of individual PM exposure is inevitable. Such misclassification could result in attenuation of the association between air pollution and MS risk. Furthermore, our study was based on a cohort of nurses, and the results thus potentially lack generalizability to men or participants with lower education or SES. Finally, our study focused on PM10, PM2.5 and PM2.5–10 due to availability of data on these PM sizes in our cohorts, and as noted above, perhaps a more relevant exposure of interest for a neurological disease like MS would be ultrafine or nano-sized particles.
In summary, in this large prospective study focused on two cohorts of US women, we did not find evidence for an association between exposure to any of the particulate matter sizes analyzed and risk of MS. We observed some suggestion, although not consistent on an interaction between PM exposure and smoking, and also potentially age. However, findings need to be reproduced in future studies.
Table 2.
Exposure to PM and risk of MS in the NHS II and NHS, by smoking status.
| NHS II | NHS | |||||||||||||||||
|---|---|---|---|---|---|---|---|---|---|---|---|---|---|---|---|---|---|---|
|
| ||||||||||||||||||
| Never Smokers | Ever Smokers | Never Smokers | Ever Smokers | |||||||||||||||
|
| ||||||||||||||||||
| PY | Cases | HR | 95% CI | PY | Case | HR | 95% CI | Pint | PY | Cases | HR | 95% CI | PY | Case | HR | 95% CI | ||
|
| ||||||||||||||||||
| PM10 | ||||||||||||||||||
| Q1 | 261380 | 40 | 1 | Ref | 140319 | 23 | 1.00 | Ref | 143993 | 6 | 1.00 | Ref | 186058 | 15 | 1.00 | Ref | ||
| Q2 | 261380 | 58 | 1.30 | (0.85, 2.00) | 140321 | 32 | 0.96 | (0.57, 1.61) | 143996 | 3 | 0.38 | (0.09, 1.59) | 186069 | 15 | 0.94 | (0.46, 1.88) | ||
| Q3 | 261382 | 48 | 1.40 | (0.89, 2.20) | 140322 | 36 | 1.57 | (0.95, 2.59) | 144002 | 4 | 0.61 | (0.17, 1.23) | 186082 | 17 | 0.74 | (0.34,1.63) | ||
| Q4 | 261386 | 42 | 1.27 | (0.78, 2.06) | 140324 | 47 | 1.33 | (1.78, 2.38) | 144009 | 13 | 1.39 | (0.41, 4.69) | 186096 | 25 | 1.41 | (0.66, 3.01) | ||
| Q5 | 261388 | 31 | 0.95 | (0.54, 1.67) | 140327 | 41 | 1.29 | (0.72, 2.30) | 0.03 | 144008 | 7 | 0.92 | (0.23, 3.68) | 186103 | 12 | 0.76 | (0.35, 1.68) | 0.36 |
| Linear | 2613953 | 219 | 0.92 | (0.69, 1.23) | 1403346 | 179 | 1.30 | (0.98, 1.73) | 1440739 | 33 | 1.12 | (0.58, 2.20) | 1862408 | 84 | 0.78 | (0.48, 1.27) | ||
|
| ||||||||||||||||||
| PM2.5 | ||||||||||||||||||
| Q1 | 261382 | 42 | 1 | Ref | 140320 | 27 | 1.00 | Ref | 143995 | 5 | 1.00 | Ref | 186059 | 20 | 1.00 | Ref | ||
| Q2 | 261380 | 47 | 1.12 | (0.73, 1.71) | 140321 | 27 | 0.96 | (0.56, 1.64) | 143994 | 5 | 0.86 | (0.19, 3.81) | 186065 | 15 | 0.70 | (0.34, 1.43) | ||
| Q3 | 261381 | 59 | 1.37 | (0.90, 2.09) | 140321 | 42 | 1.53 | (0.93, 2.52) | 144000 | 6 | 1.34 | (0.32, 5.53) | 186079 | 16 | 0.72 | (0.33, 1.55) | ||
| Q4 | 261384 | 36 | 0.86 | (0.53, 1.39) | 140321 | 42 | 1.43 | (0.85, 2.39) | 144007 | 8 | 2.11 | (0.50, 8.90) | 186079 | 20 | 1.01 | (0.44, 2.28) | ||
| Q5 | 261389 | 35 | 0.84 | (0.50, 1.39) | 140327 | 41 | 1.41 | (0.82, 2.43) | 0.01 | 149253 | 9 | 1.21 | (0.26, 5.63) | 186113 | 13 | 0.41 | (0.15, 1.08) | 0.03 |
| Linear | 2613954 | 219 | 0.92 | (0.56, 1.52) | 1403346 | 179 | 1.52 | (0.88, 2.61) | 1.01 | (0.27, 3.81) | 0.61 | (0.25, 1.50) | ||||||
|
| ||||||||||||||||||
| PM2.5–10 | ||||||||||||||||||
| Q1 | 261380 | 45 | 1 | Ref | 140320 | 33 | 1.00 | Ref | 143994 | 4 | 1.00 | Ref | 185262 | 17 | 1.00 | Ref | ||
| Q2 | 261381 | 55 | 0.85 | (0.55, 1.32) | 140321 | 33 | 0.97 | (0.61, 1.55) | 144000 | 5 | 0.47 | (0.13, 1.63) | 191711 | 12 | 0.94 | (0.47, 1.87) | ||
| Q3 | 261385 | 47 | 1.39 | (0.92, 2.11) | 140323 | 42 | 1.00 | (0.61, 0.62) | 144005 | 8 | 0.73 | (0.23, 2.32) | 190101 | 18 | 0.91 | (0.44, 1.89) | ||
| Q4 | 261385 | 39 | 1.02 | (0.63, 1.63) | 140324 | 27 | 1.07 | (0.64, 1.78) | 144004 | 10 | 1.23 | (0.40, 3.80) | 186869 | 21 | 1.06 | (0.48, 2.31) | ||
| Q5 | 61387 | 33 | 1.02 | (0.59, 1.78) | 140325 | 44 | 1.15 | (0.65, 2.06) | 0.21 | 44005 | 6 | 1.32 | (0.33, 5.19) | 179498 | 16 | 1.20 | (0.48, 2.98) | 0.008 |
| Linear | 2613954 | 219 | 0.89 | (0.59, 1.34) | 1403346 | 179 | 1.33 | (0.89, 1.99) | 1.31 | (0.48, 3.59) | 0.78 | (0.37, 1.68) | ||||||
adjusted for age, body mass index (BMI) at age 18^, population density, region (east, north, south, west), ethnicity (European Caucasian, Scandinavian, other Caucasian and non-white), latitude at age 15 tier (northern, middle, southern states), tract level income, and UV index. Analyses in smokers were additionally adjusted for smoking (past/current and pack years),
PM exposure is calculated as a cumulative average up to disease onset.
models in NHS among non-smokers were not adjusted for body mass index at age 18, because adjustment for this factor resulted in loss of convergence
REFERENCES
- 1.Lepeule J, et al. , Chronic Exposure to Fine Particles and Mortality: An Extended Follow-Up of the Harvard Six Cities Study from 1974 to 2009. Environ Health Perspect, 2012. [DOI] [PMC free article] [PubMed] [Google Scholar]
- 2.Laden F, et al. , Reduction in Fine Particulate Air Pollution and Mortality. American Journal of Respiratory and Critical Care Medicine, 2006. 173(6): p. 667–672. [DOI] [PMC free article] [PubMed] [Google Scholar]
- 3.Pope CA 3rd, et al. , Particulate air pollution as a predictor of mortality in a prospective study of U.S. adults. Am J Respir Crit Care Med, 1995. 151(3 Pt 1): p. 669–74. [DOI] [PubMed] [Google Scholar]
- 4.Dockery DW, et al. , An Association between Air Pollution and Mortality in Six U.S. Cities. New England Journal of Medicine, 1993. 329(24): p. 1753–1759. [DOI] [PubMed] [Google Scholar]
- 5.ASPEN model http://www.epa.gov/ttn/atw/nata1999/aspen99.html.
- 6.Gregory Ii AC, et al. , Multiple Sclerosis disease distribution and potential impact of environmental air pollutants in Georgia. Science of The Total Environment, 2008. 396(1): p. 42–51. [DOI] [PubMed] [Google Scholar]
- 7.Oikonen M, et al. , Ambient Air Quality and Occurrence of Multiple Sclerosis Relapse. Neuroepidemiology, 2003. 22(1): p. 95–99. [DOI] [PubMed] [Google Scholar]
- 8.Angelici L, et al. , Effects of particulate matter exposure on multiple sclerosis hospital admission in Lombardy region, Italy. Environ Res, 2016. 145: p. 68–73. [DOI] [PMC free article] [PubMed] [Google Scholar]
- 9.Ascherio A and Munger KL, Epidemiology of multiple sclerosis: environmental factors, in Multiple Sclerosis 3, Lucchinetti CF and Hohlfeld R, Editors. 2010, Saunders, Elsevier: Philadelphia. p. 57–82. [Google Scholar]
- 10.Hernan MA, et al. , Cigarette smoking and the progression of multiple sclerosis. Brain, 2005. 128(Pt 6): p. 1461–5. [DOI] [PubMed] [Google Scholar]
- 11.Hernán MA, Olek MJ, and Ascherio A, Cigarette smoking and incidence of multiple sclerosis. Am J Epidemiol, 2001. 154(1): p. 69–74. [DOI] [PubMed] [Google Scholar]
- 12.Block ML and Calderon-Garciduenas L, Air pollution: mechanisms of neuroinflammation and CNS disease. Trends Neurosci, 2009. 32(9): p. 506–16. [DOI] [PMC free article] [PubMed] [Google Scholar]
- 13.Finkelstein MM and Jerrett M, A study of the relationships between Parkinson’s disease and markers of traffic-derived and environmental manganese air pollution in two Canadian cities. Environ Res, 2007. 104(3): p. 420–32. [DOI] [PubMed] [Google Scholar]
- 14.Allen JL, et al. , Consequences of developmental exposure to concentrated ambient ultrafine particle air pollution combined with the adult paraquat and maneb model of the Parkinson’s disease phenotype in male mice. Neurotoxicology, 2014. 41: p. 80–8. [DOI] [PMC free article] [PubMed] [Google Scholar]
- 15.Ritz B, et al. , Traffic-Related Air Pollution and Parkinson’s Disease in Denmark: A Case-Control Study. Environ Health Perspect, 2015. [DOI] [PMC free article] [PubMed] [Google Scholar]
- 16.Palacios N, F.K., Hart JE, Weisskopf MG, Schwarzschild MA, Ascherio A, Laden F, Particulate matter and risk of parkinson disease in a large prospective study of women. Environmental Health, 2014. 13(80). [DOI] [PMC free article] [PubMed] [Google Scholar]
- 17.Palacios N FK, Roberts AL, Hart JE, Weisskopf MG, Schwarzschild MA, Ascherio A, Laden F, A Prospective Analysis of Airborne Metal Exposures and Risk of Parkinson Disease in the Nurses Health Study Cohort. Environ Health Perspect, 2014. 122(9): p. 933–938. [DOI] [PMC free article] [PubMed] [Google Scholar]
- 18.Weuve J, et al. , Exposure to particulate air pollution and cognitive decline in older women. Arch Intern Med, 2012. 172(3): p. 219–27. [DOI] [PMC free article] [PubMed] [Google Scholar]
- 19.Suades-Gonzalez E, et al. , Air Pollution and Neuropsychological Development: A Review of the Latest Evidence. Endocrinology, 2015. 156(10): p. 3473–82. [DOI] [PMC free article] [PubMed] [Google Scholar]
- 20.Roberts AL, et al. , Perinatal air pollutant exposures and autism spectrum disorder in the children of Nurses’ Health Study II participants. Environ Health Perspect, 2013. 121(8): p. 978–84. [DOI] [PMC free article] [PubMed] [Google Scholar]
- 21.Weisskopf MG, Kioumourtzoglou MA, and Roberts AL, Air Pollution and Autism Spectrum Disorders: Causal or Confounded? Curr Environ Health Rep, 2015. 2(4): p. 430–9. [DOI] [PMC free article] [PubMed] [Google Scholar]
- 22.Windham GC, et al. , Birth prevalence of autism spectrum disorders in the San Francisco Bay area by demographic and ascertainment source characteristics. J Autism Dev Disord, 2011. 41(10): p. 1362–72. [DOI] [PubMed] [Google Scholar]
- 23.Colditz GA, Manson JE, and Hankinson SE, The Nurses’ Health Study: 20-year contribution to the understanding of health among women. J Womens Health, 1997. 6(1): p. 49–62. [DOI] [PubMed] [Google Scholar]
- 24.Hernan MA, Olek MJ, and Ascherio A, Geographic variation of MS incidence in two prospective studies of US women. Neurology, 1999. 53(8): p. 1711–8. [DOI] [PubMed] [Google Scholar]
- 25.Ascherio A, et al. , Epstein-barr virus antibodies and risk of multiple sclerosis: A prospective study. JAMA, 2001. 286(24): p. 3083–3088. [DOI] [PubMed] [Google Scholar]
- 26.McDonald WI, et al. , Recommended diagnostic criteria for multiple sclerosis: guidelines from the International Panel on the diagnosis of multiple sclerosis. Ann Neurol, 2001. 50(1): p. 121–7. [DOI] [PubMed] [Google Scholar]
- 27.Puett RC, et al. , Chronic Particulate Exposure, Mortality, and Coronary Heart Disease in the Nurses’ Health Study. American Journal of Epidemiology, 2008. 168(10): p. 1161–1168. [DOI] [PMC free article] [PubMed] [Google Scholar]
- 28.Yanosky JD, et al. , Spatio-temporal modeling of chronic PM10 exposure for the Nurses’ Health Study. Atmospheric Environment, 2008. 42(18): p. 4047–4062. [DOI] [PMC free article] [PubMed] [Google Scholar]
- 29.Yanosky JD, et al. , Spatio-temporal modeling of particulate air pollution in the conterminous United States using geographic and meteorological predictors. Environ Health, 2014. 13: p. 63. [DOI] [PMC free article] [PubMed] [Google Scholar]
- 30.Sermin Genc ZZ, Fuss Stefan H., and Genc Kursad, The Adverse Effects of Air Pollution on the Nervous System. Journal of Toxicology, 2012. 2012. [DOI] [PMC free article] [PubMed] [Google Scholar]
- 31.Wellenius GA, et al. , Residential proximity to nearest major roadway and cognitive function in community-dwelling seniors: results from the MOBILIZE Boston Study. J Am Geriatr Soc, 2012. 60(11): p. 2075–80. [DOI] [PMC free article] [PubMed] [Google Scholar]
- 32.Wang Y, et al. , Ambient air pollution and depressive symptoms in older adults: results from the MOBILIZE Boston study. Environ Health Perspect, 2014. 122(6): p. 553–8. [DOI] [PMC free article] [PubMed] [Google Scholar]
- 33.Wang Y, et al. , Long-term exposure to ambient air pollution and serum leptin in older adults: results from the MOBILIZE Boston study. J Occup Environ Med, 2014. 56(9): p. e73–7. [DOI] [PMC free article] [PubMed] [Google Scholar]
- 34.Wellenius GA, et al. , Ambient particulate matter and the response to orthostatic challenge in the elderly: the Maintenance of Balance, Independent Living, Intellect, and Zest in the Elderly (MOBILIZE) of Boston study. Hypertension, 2012. 59(3): p. 558–63. [DOI] [PMC free article] [PubMed] [Google Scholar]
- 35.Korczyn AD, Comment: should we diagnose MCI in Parkinson disease? J Neural Transm, 2011. 118(8): p. 1177. [DOI] [PubMed] [Google Scholar]
- 36.Inzelberg R, et al. , Apolipoprotein E4 in Parkinson disease and dementia: new data and meta-analysis of published studies. Alzheimer Dis Assoc Disord, 1998. 12(1): p. 45–8. [DOI] [PubMed] [Google Scholar]
- 37.Diaz Heijtz R, et al. , Normal gut microbiota modulates brain development and behavior. Proc Natl Acad Sci U S A, 2011. 108(7): p. 3047–52. [DOI] [PMC free article] [PubMed] [Google Scholar]
- 38.Bernatsky S, et al. , Associations between Ambient Fine Particulate Levels and Disease Activity in Patients with Systemic Lupus Erythematosus (SLE). Environmental Health Perspectives, 2011. 119(1): p. 45–49. [DOI] [PMC free article] [PubMed] [Google Scholar]
- 39.Ananthakrishnan AN, et al. , Ambient air pollution correlates with hospitalizations for inflammatory bowel disease: An ecologic analysis. Inflammatory Bowel Diseases, 2011. 17(5): p. 1138–1145. [DOI] [PubMed] [Google Scholar]
- 40.Hart JE, et al. , Exposure to traffic pollution and increased risk of rheumatoid arthritis. Environmental Health Perspectives, 2009. 117(7): p. 1065–1069. [DOI] [PMC free article] [PubMed] [Google Scholar]
- 41.WGR M, Neuropathology and pathophyiology of the multiple sclerosis lesion., in Multiple Sclerosis. 1998, Davis Co: Philadelphia, PA. [Google Scholar]
- 42.Calderon-Garciduenas L, et al. , Long-term air pollution exposure is associated with neuroinflammation, an altered innate immune response, disruption of the blood-brain barrier, ultrafine particulate deposition, and accumulation of amyloid beta-42 and alpha-synuclein in children and young adults. Toxicol Pathol, 2008. 36(2): p. 289–310. [DOI] [PubMed] [Google Scholar]
- 43.Hartz AMS, et al. , Diesel exhaust particles induce oxidative stress, proinflammatory signaling, and P-glycoprotein up-regulation at the blood-brain barrier. The FASEB Journal, 2008. 22(8): p. 2723–2733. [DOI] [PMC free article] [PubMed] [Google Scholar]
- 44.Oikonen M, et al. , Temporal relationship between environmental influenza A and Epstein-Barr viral infections and high multiple sclerosis relapse occurrence. Mult Scler, 2011. 17(6): p. 672–80. [DOI] [PubMed] [Google Scholar]
- 45.Hedstrom A, et al. , Exposure to environmental tobacco smoke is associated with increased risk for multiple sclerosis. Mult Scler, 2011. 17(7): p. 788–93. [DOI] [PubMed] [Google Scholar]
- 46.PETITTI DB and KIPP H, THE LEUKOCYTE COUNT: ASSOCIATIONS WITH INTENSITY OF SMOKING AND PERSISTENCE OF EFFECT AFTER QUITTING. American Journal of Epidemiology, 1986. 123(1): p. 89–95. [DOI] [PubMed] [Google Scholar]
- 47.Bermudez EA, et al. , Relation between markers of systemic vascular inflammation and smoking in women. The American Journal of Cardiology, 2002. 89(9): p. 1117–1119. [DOI] [PubMed] [Google Scholar]
- 48.Hedstrom AK, et al. , Tobacco smoking, but not Swedish snuff use, increases the risk of multiple sclerosis. Neurology, 2009. 73: p. 696–701. [DOI] [PubMed] [Google Scholar]
- 49.Weuve J, P.R.C.S.J.Y.J.D.L.F.G.F., EXposure to particulate air pollution and cognitive decline in older women. Archives of Internal Medicine, 2012. 172(3): p. 219–227. [DOI] [PMC free article] [PubMed] [Google Scholar]
- 50.NATA data sources http://www.epa.gov/ttn/atw/nata/natsa1.html - sources.