Abstract
Cardiac CT is a useful tool for cardiovascular diagnostics that offers different acquisition modes, each with its advantages. The development of direct converting detector technology has resulted in the clinical translation of dual-source photon-counting CT. This takes advantage of the improved image quality at high heart rates from dual-source CT while making available spectral results for more precise material characterization and quantification. To evaluate the stability of spectral results among different acquisition modes and heart rates, a cardiac motion phantom with a rod mimicking a 50% coronary stenosis was scanned with a dual-source photon-counting CT in three different acquisition modes (retrospective dual-source spiral, prospective dual-source step-and-shoot, dual-source flash spiral) and at different heart rates (60, 80, 100 bpm). Dice scores of stenosed regions relative to a static scan, eccentricity of non-stenosed regions, full width half max, and normalized area under the curve of line profiles were calculated for iodine density maps, and virtual mono-energetic images at 40 and 70 keV. Dice scores and eccentricity were consistent and not significantly affected by acquisition mode or heart rate for spectral results. Full width half max and normalized area under the curve similarly illustrated minor differences between acquisition modes and heart rates. The consistency in these metrics demonstrate preserved image structure and allows for the use of spectral results with high confidence. Dual-source photon-counting CT will enable cardiovascular diagnostics with better material characterization and differentiation.
Keywords: Photon-counting CT, Cardiac CT, Spectral CT
I. Introduction
Cardiac computed tomography (CT) plays an important role in evaluation of heart disease [1]–[3]. These scans acquire high temporal resolution images in one of two ways: spiral, i.e. helical mode, or step-and-shoot. In the spiral/helical mode, images are reconstructed based on a retrospective selection of the phase of the cardiac cycle. This presents more control in time and image quality but comes at the cost of higher radiation exposure [4]. In comparison, step-and-shoot acquisition is a prospectively triggered process that results in reduced radiation doses [5], [6]. However, it has limited use at higher heart rates due to the inability to accurately select the phase of the cardiac cycle with minimal motion [7].
With the development of newer technologies, cardiac CT has further improved with dual-source CT. Dual-source CT adds an additional detector and x-ray tube at almost 90 degrees offset from the other detector and x-ray tube [8]. While a total of 180 degrees and fan angle of rotation are required to acquire images with a single source CT, dual source reduces the required rotation to 90 degrees. This effectively doubles the temporal resolution [8], which reduces motion artifacts to decrease the influence of heart rate on image quality [9], [10]. A third mode utilizes a high pitch dual source helical acquisition; this results in reduced radiation dose compared to spiral/helical mode [11], [12].
Another technology development, spectral CT, improves upon quantification, material characterization, and material differentiation by acquiring attenuation maps from two or more distinct x-ray spectra and generating spectral results, such as iodine density maps and virtual mono-energetic images (VMI) [13], [14]. The newest realization of spectral CT, photon-counting CT (PCCT) [15], in combination with dual-source CT not only has all three acquisition modes for cardiac CT but also allows for the acquisition of spectral results during cardiac CT [16], which was not previously available in cardiac CT. The addition of spectral results to cardiac CT presents an opportunity to advance characterization of heart disease with improved quantification and material differentiation but may be affected by the different acquisition modes and limited by heart rate.
II. Methods
To evaluate the effect of acquisition mode and heart rate on coronary material quantifications using different spectral results, a cardiac motion phantom with a three-dimensional motion simulator was utilized (QRM-Sim4D-Cardio, Quality Assurance in Radiology and Medicine, Möehrendorf, Germany). The phantom included rods submerged in a water tank. Analysis was performed on a rod that mimics a coronary artery filled with contrast and a fibro-fatty plaque that fills half the lumen, resulting in 50% stenosis. Programmed motion combined with a synthetic ECG signal simulated heart rates of 60, 80, and 100 beats per minutes (bpm).
The phantom was imaged on a first-generation dual-source PCCT (NAEOTOM Alpha, Siemens Healthineers, Erlangen, Germany) (Figure 1). The scanner offers three cardiac acquisition modes: retrospective dual source helical (DS spiral), prospective dual source step-and-shoot (DS sequence), and prospective high pitch dual source helical (flash spiral). In all modes, a standard clinical protocol (Table I) was utilized to obtain images at 120 kVp for each heart rate: 60, 80, 100 bpm. In addition to dynamic scans, a static scan (motion-free) was acquired with a standard clinical protocol. Spectral results, including iodine density maps and VMI at 40 and 70 keV, were generated for each scan.
Fig. 1.
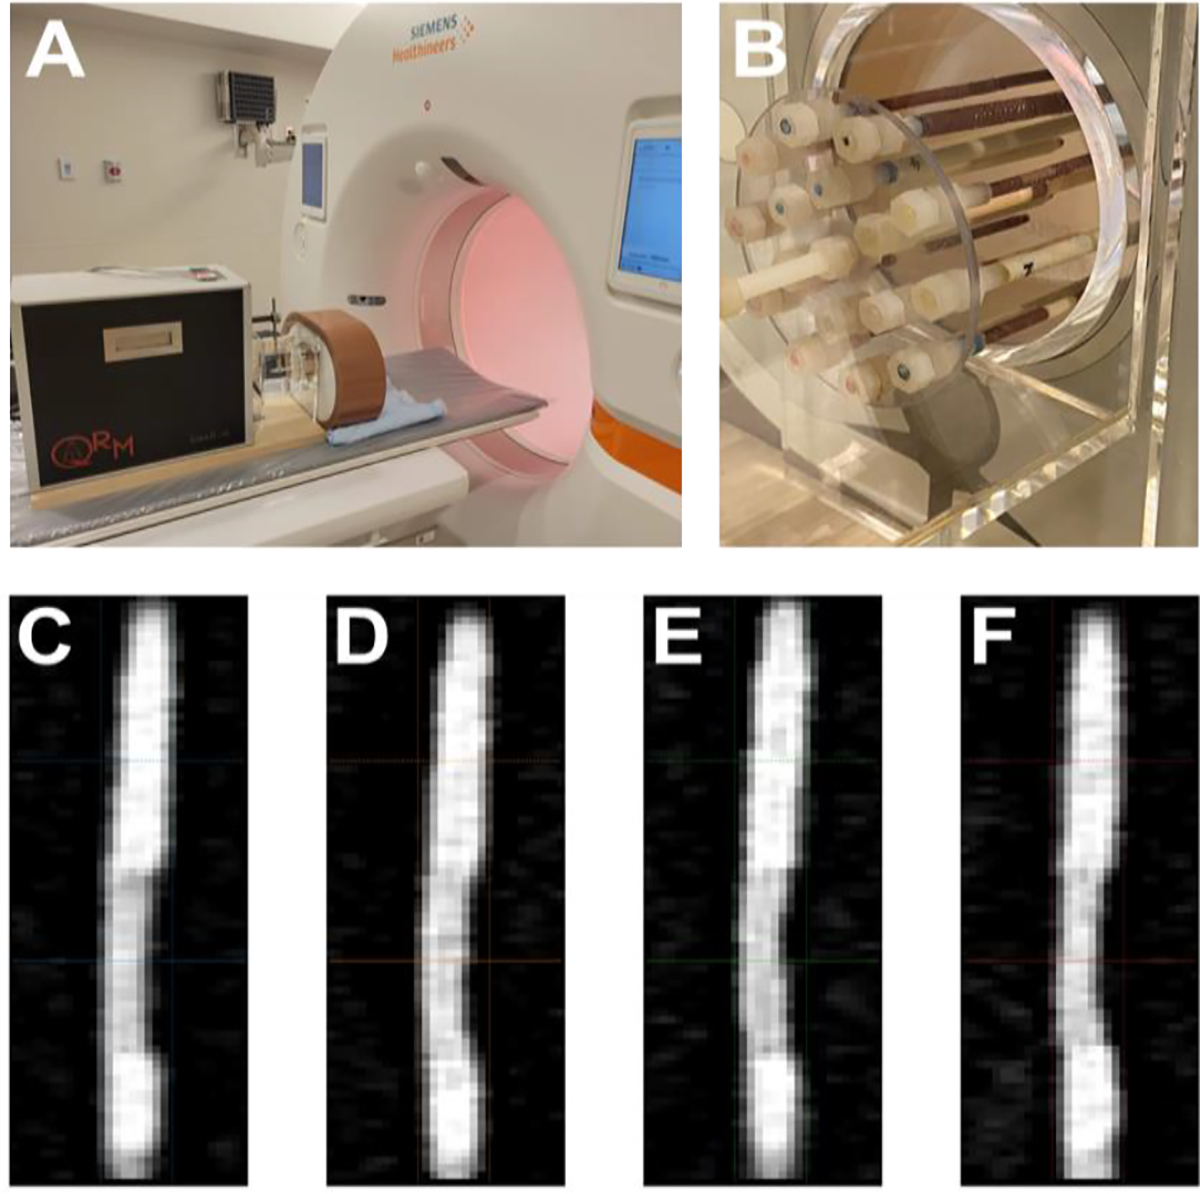
Experimental setup. (A) A cardiac motion phantom coupled with a 3D motion simulator was scanned with a dual-source photon-counting CT. It contained a variety of artificial coronary arteries containing stenoses of different materials and extents (B). 70 keV VMI images (C-F) illustrate a fibro-fat stenosis within the rod scanned at different heart rates (0, 60, 80, 100 bpm).
TABLE I.
Acquisition Parameters for Cardiac Motion Phantom
| Static | DS spiral | DS sequence | Flash spiral | |
|---|---|---|---|---|
| Tube voltage | 120 kVp | |||
| Exposure time [s] | 0.25 | 1.388 | 0.34 | 0.078 |
| Spiral pitch factor | 1 | 0.23 | N/A | 3.2 |
| Exposure [mAs] | 250 | 62 | 51 | 48 |
| CTDIvol [mGy] | 10 | 8 | 8 | 6 |
| Collimation width | 0/4 / 57.6 mm (single/total) | |||
| Slice thickness | 0.4 mm | |||
| Convolution kernel | Bv36f | |||
| Field of view | 200 mm | |||
| Matrix size | 512 × 512 | |||
| Pixel spacing | 0.390625 mm | |||
To determine consistency of lumen extent in images with different heart rates and acquisition modes, axial slices of non-stenosed and stenosed regions were extracted from scans. Adaptive thresholding with a Gaussian filter was applied to axial slices to generate a mask of the stenosed region. Using the mask from the static scan as reference, Dice similarity coefficients were calculated for 5 consecutive slices from each acquisition mode and heart rate combination. Dice scores were represented in a scatter plot as mean ± standard deviation. The eccentricity of non-stenosed regions of the rod were also examined. After adaptive thresholding of the non-stenosed region, an ellipse was fit to the contour (Figure 2). Eccentricity was calculated as
| (1) |
where a is the semi-minor axis and b is the semi-major axis. Values were represented in a scatter plot as mean ± standard deviation.
Fig. 2.
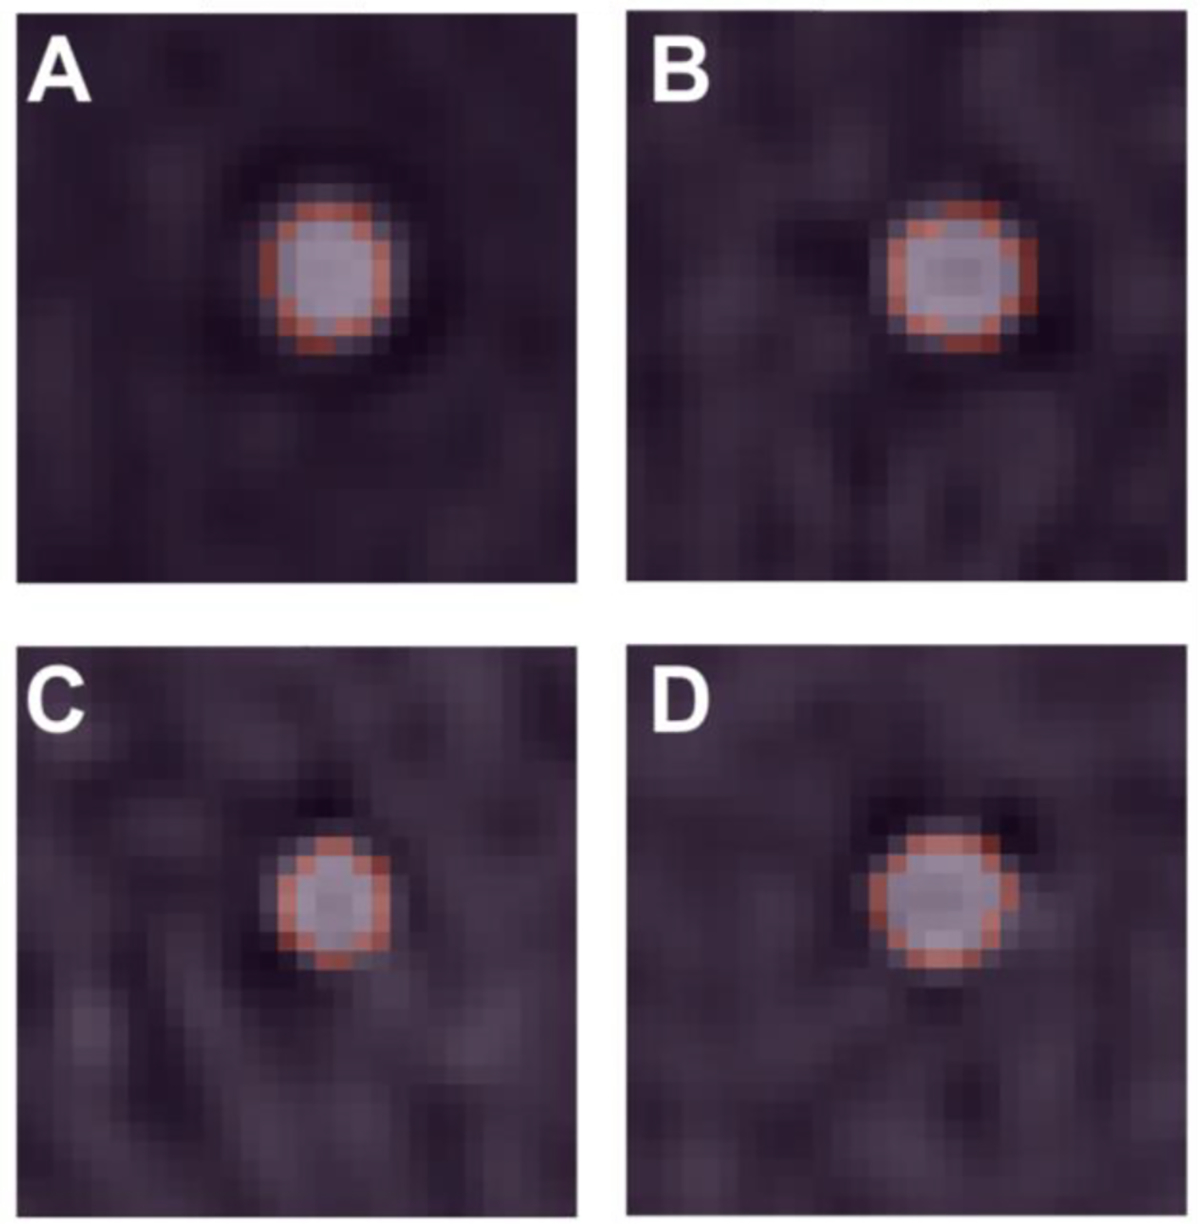
Fitted ellipses of non-stenosed lumen. Ellipses (pink) matched rods on axial VMI 70 keV images for 0 (A), 60 (B), 80 (C), and 100 (D) bpm. Size and shape of the lumen were similar between the different heart rates with some slight distortion in shape that was reflected in eccentricity.
Line profiles were extracted from coronal slices at the stenosed region to further assess the consistency between acquisition modes and heart rates. A threshold was applied to the line profile to isolate the peak associated with the rod from the background signal. The value of this threshold was calculated as the average + standard deviation of the first and last 5 pixels of the line profile. The full width half max (FWHM) from this peak was calculated to describe the spread in points. Additionally, the normalized area under the curve (AUC) for the peak was determined by evaluating the AUC and normalizing by the maximum value of the peak. Values for both FWHM and normalized AUC were averaged across 5 slices and reported as mean ± standard deviation. For all four metrics, a 2-way ANOVA was implemented to evaluate the effect of acquisition mode and heart rate (60, 80, 100 bpm). A p-value of less than 0.05 was considered significant.
III. Results
Dice scores (Figure 3) were similar between 60, 80, and 100 bpm for each of the acquisition modes and spectral results. The maximum average difference in Dice score between the three heart rates was 0.11, 0.20, and 0.19 for iodine density maps, VMI 40 keV, and VMI 70 keV, respectively. Of note, Dice scores from high-pitch spiral scans deviated less than Dice scores from other acquisition modes. There was no significant effect of acquisition mode or heart rate on the Dice score for iodine density maps (0.79, 0.69) and VMI 40 keV (0.67, 0.10) but not for the Dice score for VMI 70 keV (0.039, 0.002). In general, the high level of similarity illustrated image consistency of stenosed regions of the coronary artery phantom.
Fig. 3.
Dice similarity coefficient of stenosed areas of coronary phantoms at different spectral results, acquisition modes, and heart rates. High similarity between Dice scores of different heart rates and acquisition modes demonstrates consistency.
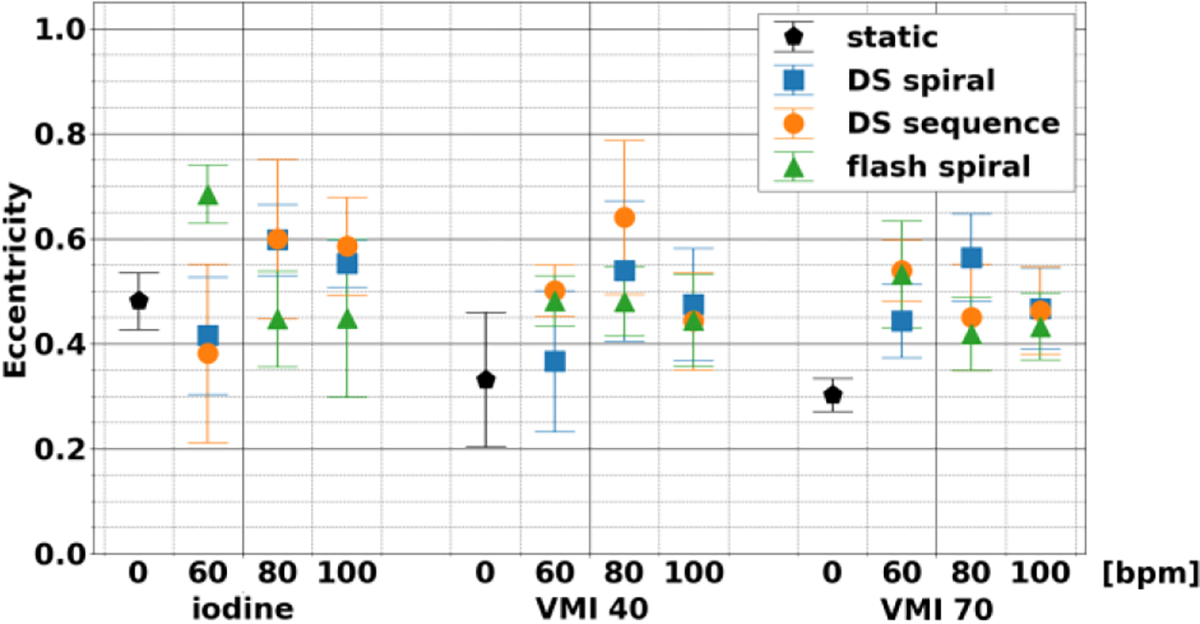
Eccentricity (Figure 4) was independent of heart rate and acquisition mode across the different spectral results. The shape of the non-stenosed area in dynamic scans demonstrated similar properties to those observed in static scans, with maximum magnitude of the average difference relative to the static scan of 0.05, 0.20, and 0.19 for iodine density maps, VMI 40 keV, and VMI 70 keV, respectively. These deviations correspond to small changes related to motion blurring. Even so, for the three different acquisition modes, eccentricity was not significantly different for different heart rates and acquisition modes for each of the three spectral results. This highlights that consistency was present at both nonstenosed and stenosed regions of the rod.
Fig. 4.
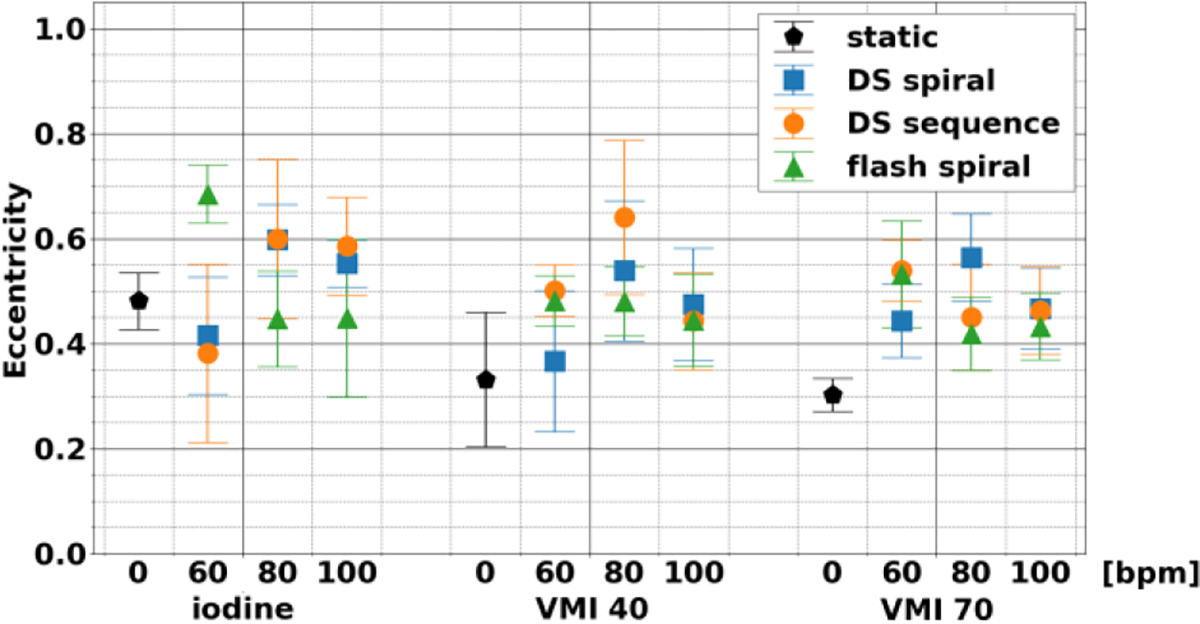
Eccentricity of non-stenosed lumen between different spectral results, acquisition modes, and heart rates. Shape of non-stenosed lumen was not affected by acquisition modes or heart rates. The stability applied to all three spectral results examined: iodine, VMI 40 keV, and VMI 70 keV.
FWHM (Figure 5) at different acquisition modes and heart rates for iodine density maps, VMI 40 keV, and VMI 70 keV illustrated the stability in the sharpness of rod in comparison to its background. This stability was apparent with the maximum magnitude of the average difference relative to the static scan, which amounted to 0.30, 0.24, and 0.23 for iodine density maps, VMI 40 keV, and VMI 70 keV. Moreover, acquisition modes and heart rates did not significantly affect FWHM with the exception of acquisition mode for iodine density maps. Similarly, normalized AUC (Figure 6) was only significantly affected by acquisition mode or heart rate for iodine density maps, thus demonstrating stability between heart rates for each acquisition mode and most spectral results.
Fig. 5.
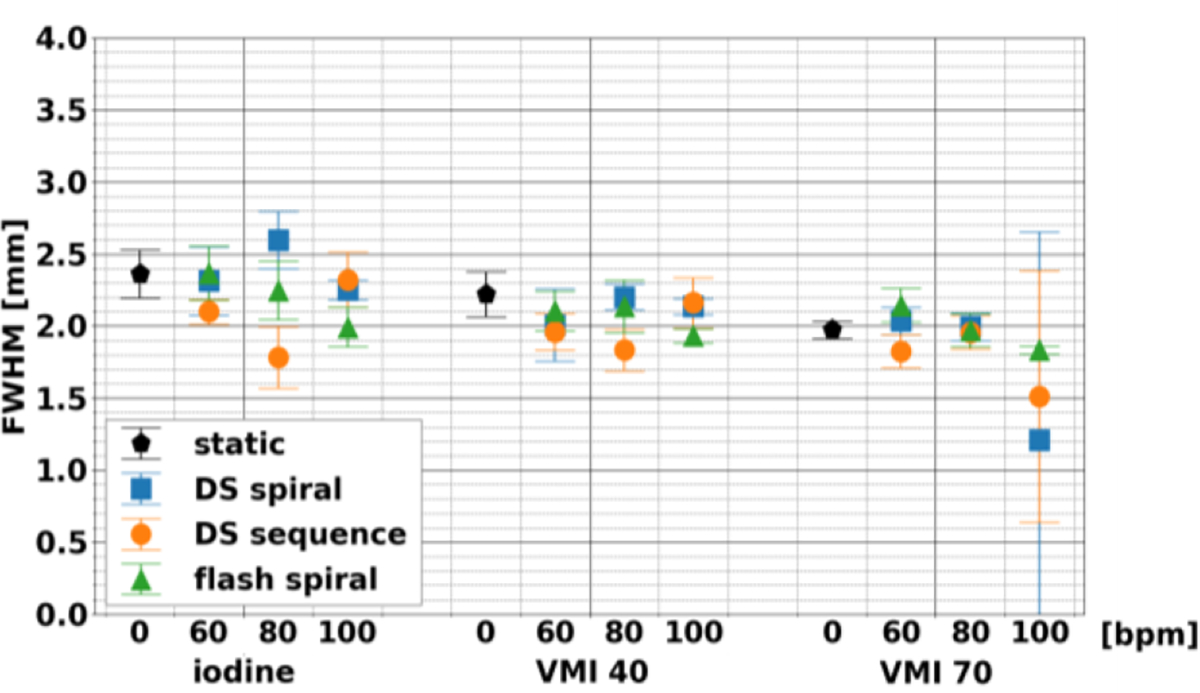
Effect of acquisition modes and heart rates on full width half max of line profiles of coronary phantom. Between acquisition modes and heart rates, results were stable and did not vary for each spectral result.
Figure 6.
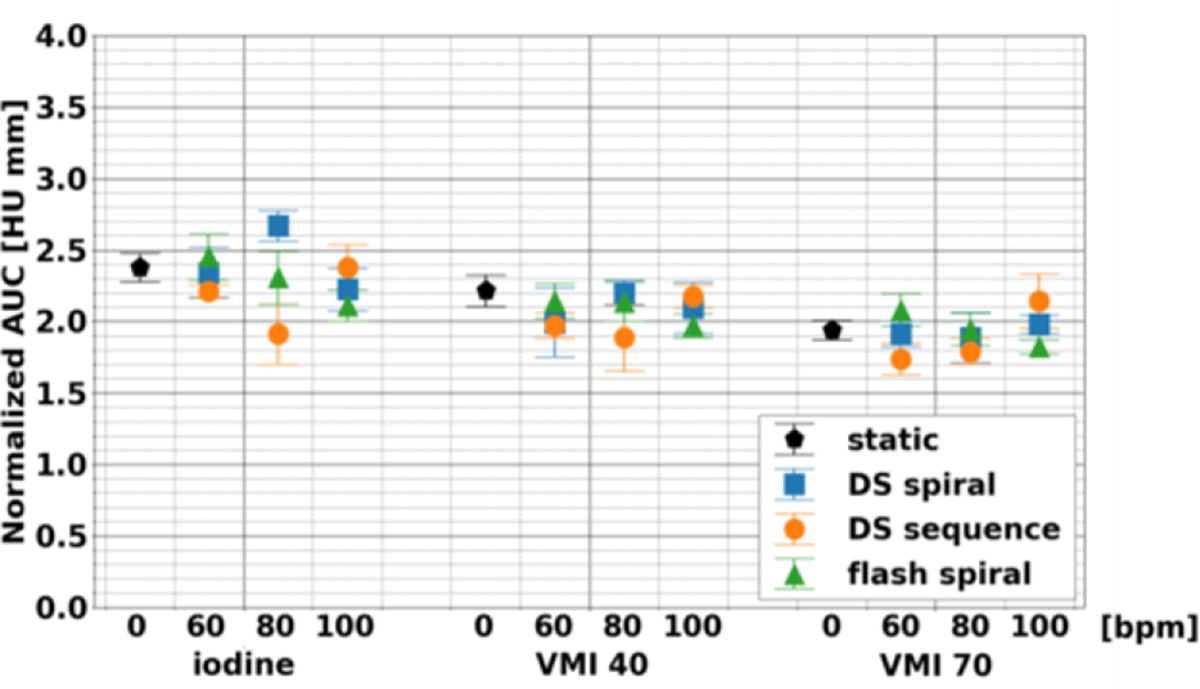
Comparison of normalized area under of the curve of line profiles of stenosed lumen in coronary artery phantom. Normalized area under of the curve varied little across heart rates and acquisition modes for each spectral result.
IV. Discussion
This systematic evaluation of the three acquisition modes for cardiac CT demonstrated stability at different heart rates and acquisition modes for iodine density maps, VMI 40 keV, and VMI 70 keV. This stability can be extended to other spectral results that were not examined here, and the minimal effect of acquisition mode and heart rate provides confidence in visualization and quantification of these spectral results. Moreover, this is the first-time spectral results are available for a wide range of heart rates with dual-source CT. One of the main applications for these spectral results is examining and characterizing coronary artery plaque, which can be composed of different materials, i.e. calcium, fibro-fatty, or fatty tissue. As demonstrated in dual-energy CT, each spectral result plays a different role in material differentiation: iodine density maps isolate contrast from other materials, while virtual mono-energetic images at different keVs have specific advantages, such as increased contrast, reduced beam hardening, and metal artifact reduction. As a result, the stability of spectral results in dual-source PCCT augurs well for their utility in material quantification and characterization.
V. Conclusion
This initial study of dual-source photon-counting CT in cardiac mode illustrates potential for improved cardiovascular diagnostics. Clinical studies are an essential next step to establish PCCT in the clinical routine.
Acknowledgments
This study was funded by the National Institutes of Health (R01EB030494) and Siemens Healthineers.
Contributor Information
Leening P. Liu, Department of Bioengineering and Department of Radiology, Perelman School of Medicine, Philadelphia, PA, USA.
Nadav Shapira, Noël are with the Department of Radiology, Perelman School of Medicine, Philadelphia, PA, USA..
Pooyan Sahbaee, Siemens Medical Solutions, Malvern, PA, USA..
Harold I. Litt, Noël are with the Department of Radiology, Perelman School of Medicine, Philadelphia, PA, USA.
Marcus Y. Chen, National Heart, Lung, and Blood Institute, National Institutes of Health, Bethesda, MD, USA.
Peter B. Noël, Noël are with the Department of Radiology, Perelman School of Medicine, Philadelphia, PA, USA.
References
- [1].Ulzheimer S and Kalender WA, “Assessment of calcium scoring performance in cardiac computed tomography,” European radiology, vol. 13, no. 3, pp. 484–497, Mar. 2003, doi: 10.1007/S00330-002-1746-Y. [DOI] [PubMed] [Google Scholar]
- [2].Budoff MJ et al. , “Assessment of coronary artery disease by cardiac computed tomography: A scientific statement from the American Heart Association Committee on Cardiovascular Imaging and Intervention, Council on Cardiovascular Radiology and Intervention, and Committee on Cardiac Imaging, Council on Clinical Cardiology,” Circulation, vol. 114, no. 16, pp. 1761–1791, Oct. 2006, doi: 10.1161/CIRCULATIONAHA.106.178458. [DOI] [PubMed] [Google Scholar]
- [3].Raff GL, Gallagher MJ, O’Neill WW, and Goldstein JA, “Diagnostic Accuracy of Noninvasive Coronary Angiography Using 64-Slice Spiral Computed Tomography,” Journal of the American College of Cardiology, vol. 46, no. 3, pp. 552–557, Aug. 2005, doi: 10.1016/J.JACC.2005.05.056. [DOI] [PubMed] [Google Scholar]
- [4].Hausleiter J et al. , “Estimated radiation dose associated with cardiac CT angiography,” JAMA, vol. 301, no. 5, pp. 500–507, Feb. 2009, doi: 10.1001/JAMA.2009.54. [DOI] [PubMed] [Google Scholar]
- [5].Earls JP et al. , “Prospectively Gated Transverse Coronary CT Angiography versus Retrospectively Gated Helical Technique: Improved Image Quality and Reduced Radiation Dose1,” 10.1148/radiol.2463070989, vol. 246, no. 3, pp. 742–753, Mar. 2008, doi: . [DOI] [PubMed] [Google Scholar]
- [6].Stolzmann P et al. , “Dual-source CT in step-and-shoot mode: Noninvasive coronary angiography with low radiation dose,” Radiology, vol. 249, no. 1, pp. 71–80, Oct. 2008, doi: 10.1148/RADIOL.2483072032/ASSET/IMAGES/LARGE/R08SE22T04X.JPEG. [DOI] [PubMed] [Google Scholar]
- [7].Hsieh J, Londt J, Vass M, Li J, Tang X, and Okerlund D, “Step-and-shoot data acquisition and reconstruction for cardiac x-ray computed tomography,” Medical Physics, vol. 33, no. 11, pp. 4236–4248, Nov. 2006, doi: 10.1118/1.2361078. [DOI] [PubMed] [Google Scholar]
- [8].Flohr TG Cynthia H McCollough Herbert Bruder Martin Petersilka Klaus Gruber Christoph Süβ Michael Grasruck Karl Stierstorfer Bernhard Krauss Rainer Raupach Andrew N Primak Axel Küttner Stefan Achenbach Christoph Becker Andreas Kopp Bernd M Ohnesorge et al. , “COMPUTER TOMOGRAPHY First performance evaluation of a dual-source CT (DSCT) system,” Eur Radiol, vol. 16, pp. 256–268, 2006, doi: 10.1007/s00330-005-2919-2. [DOI] [PubMed] [Google Scholar]
- [9].Achenbach S et al. , “Contrast-enhanced coronary artery visualization by dual-source computed tomography—Initial experience,” European Journal of Radiology, vol. 57, no. 3, pp. 331–335, Mar. 2006, doi: 10.1016/J.EJRAD.2005.12.017. [DOI] [PubMed] [Google Scholar]
- [10].Ropers U et al. , “Influence of Heart Rate on the Diagnostic Accuracy of Dual-Source Computed Tomography Coronary Angiography,” Journal of the American College of Cardiology, vol. 50, no. 25, pp. 2393–2398, Dec. 2007, doi: 10.1016/J.JACC.2007.09.017. [DOI] [PubMed] [Google Scholar]
- [11].Morsbach F et al. , “Performance of turbo high-pitch dual-source CT for coronary CT angiography: First ex vivo and patient experience,” European Radiology, vol. 24, no. 8, pp. 1889–1895, May 2014, doi: 10.1007/S00330-014-3209-7/FIGURES/5. [DOI] [PubMed] [Google Scholar]
- [12].Achenbach S et al. , “High-pitch spiral acquisition: A new scan mode for coronary CT angiography,” Journal of Cardiovascular Computed Tomography, vol. 3, no. 2, pp. 117–121, Mar. 2009, doi: 10.1016/J.JCCT.2009.02.008. [DOI] [PubMed] [Google Scholar]
- [13].Caruso D et al. , “Can dual-energy computed tomography improve visualization of hypoenhancing liver lesions in portal venous phase? Assessment of advanced image-based virtual monoenergetic images,” Clinical Imaging, vol. 41, pp. 118–124, Jan. 2017, doi: 10.1016/J.CLINIMAG.2016.10.015. [DOI] [PubMed] [Google Scholar]
- [14].Ehn S et al. , “Assessment of quantification accuracy and image quality of a full-body dual-layer spectral CT system,” Journal of Applied Clinical Medical Physics, vol. 19, no. 1, pp. 204–217, 2018, doi: 10.1002/acm2.12243. [DOI] [PMC free article] [PubMed] [Google Scholar]
- [15].Liu LP, Shapira N, Sahbaee P, Schnall M, Litt HI, and Noël PB, “First-generation clinical dual-source photon-counting CT: ultra-low dose quantitative spectral imaging,” medRxiv, p. 2021.11.17.21266432, Dec. 2021, doi: 10.1101/2021.11.17.21266432. [DOI] [PMC free article] [PubMed] [Google Scholar]
- [16].van der Werf NR et al. , “Dose Reduction in Coronary Artery Calcium Scoring Using Mono-Energetic Images from Reduced Tube Voltage Dual-Source Photon-Counting CT Data: A Dynamic Phantom Study,” Diagnostics 2021, Vol. 11, Page 2192, vol. 11, no. 12, p. 2192, Nov. 2021, doi: 10.3390/DIAGNOSTICS11122192. [DOI] [PMC free article] [PubMed] [Google Scholar]


