

Abstract
Background:
Wrist-worn transdermal alcohol sensors have the potential to change how alcohol consumption is measured. However, hardware and data analytic challenges associated with transdermal sensor data have kept these devices from widespread use. Given recent technological and analytic advances, this study provides an updated account of the performance of a new generation wrist-worn transdermal sensor in both laboratory and field settings.
Methods:
This work leverages machine learning models to convert transdermal alcohol concentration (TAC) data into estimates of Breath Alcohol Concertation (BrAC) in a large-scale laboratory (N=256, study 1) and pilot field sample (N=27, study 2). Specifically, in both studies, the accuracy of this translation is evaluated by comparing BAC estimates yielded from BACtrack Skyn to real-time breathalyzer measurements collected in the lab and in the field.
Results:
The newest version of the Skyn device demonstrates a substantially lower error rate compared to older hand-assembled prototypes (0%-7% vs 29%-53%). On average, real-time estimates of BrAC yielded from these transdermal sensors are within 0.007 of true BAC readings in the laboratory context and within 0.019 of true BrAC readings in the field. In both contexts, distance between true and estimated BrAC was larger when only alcohol episodes were examined (0.017 lab; 0.041 field). Lastly, results of power-law-curve projections indicate the accuracy of transdermal BrAC estimates in real-world contexts has the potential to improve markedly (>25%) given adequately sized datasets for model training.
Conclusion:
Findings from this study indicate the latest version of transdermal wrist sensor holds promise for the assessment of alcohol consumption in field contexts. A great deal of additional work is left to be done before we have a full picture of the utility of these devices, including research with large participant samples in field contexts.
Keywords: Alcohol, Biosensor, Transdermal, Blood Alcohol Concentration, Machine Leaning
Transdermal alcohol biosensors have received increasing attention from researchers as a promising method for continuous, objective assessment of alcohol consumption (Fairbairn & Kang, 2020). Designed to detect traces of alcohol expelled through the skin in the form of water vapor and sweat, these non-invasive sensors have the potential to overcome many of the limitations associated with traditional measures of intoxication (Nyman & Palmlöv, 1936; Swift, 2003; Swift & Swette, 1992). Specifically, self-reports of alcohol consumption can be impacted by self-presentational concern and alcohol-related cognitive disruptions (Cherpitel et al., 2018; Ernhart et al., 1988; White, 2003), improperly used breathalyzers can produce readings biased by mouth alcohol (Caddy et al., 1978; Gullberg, 1992), and blood draws are impractical for use in the field. In light of their ability to objectively and unobtrusively assess consumption patterns in naturalistic environments, transdermal sensors have the potential to help users gain insight into their drinking patterns and by extension minimize alcohol-related morbidity and mortality (Fairbairn & Kang, 2020; Fridberg et al., 2022; Luczak et al., 2018; Piasecki, 2019).
Despite the potential of these sensors, challenges have emerged surrounding the transdermal measurement of alcohol consumption that have precluded more widespread application (Luczak & Ramchandani, 2019; Wang et al., 2019). The first of these challenges pertains to the devices themselves, particularly in their earlier iterations. The Secure Continuous Remote Alcohol Monitor (SCRAM™; AMS, Littleton) is an early-generation transdermal ankle bracelet that currently represents the most widely researched, validated, and utilized device on the market (Dougherty et al., 2012; Fairbairn et al., 2019). SCRAM devices have been used in the justice system as abstinence monitors (Leffingwell et al., 2013), in treatment settings to help improve care (Dougherty et al., 2014), and in research studies to approximate blood alcohol concentration (BAC) in the field (Fairbairn et al., 2018; Russell et al., 2022) . However, several design elements of these ankle monitors prevent more widespread application beyond these more specialized settings including a relatively bulky design, which causes embarrassment and skin irritation in some users, and an active, pump-based method for assessing TAC that constrains sampling to a relatively sparse 30-minute interval (Alessi et al., 2017; Caluzzi et al., 2019). The second of these challenges pertains to the interpretation of the data yielded from these devices. Several decades of research exploring transdermal alcohol sensor output has revealed that the translation of transdermal alcohol concentration (TAC) data into estimates of BAC is not a straightforward task (Fairbairn & Kang, 2020). Studies reveal that the relationship between TAC and BAC can vary across individuals and also settings (Luczak et al., 2018; Saldich et al., 2021; Wang et al., 2019), and further that TAC can lag behind BAC by variable intervals (Fairbairn & Kang, 2019; Luczak & Ramchandani, 2019; Luczak & Rosen, 2014; Marques & McKnight, 2009; Sakai et al., 2006).
In recent years, advances in wireless communication, miniaturization, and big data analytics have emerged with the potential to help overcome some of the challenges associated with transdermal alcohol measurement (Fairbairn & Bosch, 2021). Such advances have facilitated the development of a significantly smaller and lighter generation of transdermal alcohol sensor, comparable in size to widely-available fitness smartwatches (Fairbairn & Kang, 2019; Wang et al., 2019). These new-generation sensors offer enhanced data storage capacity facilitated by smartphone integration, thus permitting substantially more rapid TAC sampling (20 seconds) and a shorter lag time for the transdermal detection of alcohol (Fairbairn et al., 2020; Wang et al., 2019). These new devices allow for more unobtrusive and immediate examination of drinking behaviors, thus introducing novel applications for transdermal technology including for widespread health monitoring and prevention in everyday drinkers (Barnett, 2015; Dougherty et al., 2014; Fairbairn & Bosch, 2021). Recent years have also yielded advances in analytic approaches for processing transdermal sensor data (Fairbairn & Bosch, 2021). Specifically, the past decade has given rise to major progress in a family of computational approaches known as machine-learning. Machine-learning algorithms are unique in their ability to model complex relationships between variables, learning the shape of these associations directly from the data itself rather than confining these relationships to a pre-determined set of forms (e.g., linear, quadratic, logarithmic; Mjolsness & DeCoste, 2001). Thus, under optimal training conditions, machine learning algorithms can model relationships between variables that take on an infinite number of shapes, making these models uniquely successful in solving specific complex translation problems including those involved in speech recognition and climate forecasting. Importantly, the accuracy of machine learning output hinges on the nature of the data available for training, with the potential complexity and sophistication of the model that can be applied increasing as the size of the dataset increases (Frey & Fisher, 1999). Thus, larger datasets are often necessary for machine learning applications. Nonetheless, given adequate data for model training, the flexible approach offered within a machine learning framework has the potential to address some of the challenges of TAC-BAC translation.
Although these device and analytic tools show promise, they are as yet quite new and thus little is known of how they might impact the broader viability of transdermal alcohol measurement. Specifically, regarding these novel tools, several major gaps remain in our knowledge of their feasibility for implementation as well as the validity of the alcohol use estimates they yield. First, although early hand-assembled prototypes of new-generation transdermal sensors showed high failure rates (Ash et al., 2022; Fairbairn & Kang, 2019) —with sensor failure rate ranging from 18% to 38%—relatively little is known of the performance of these sensors beyond the prototype phase. Three studies to date have reported on error rates of (non-prototype) new-generation sensors, one of which featured expert users rather than community samples (Wang et al., 2021), and two others that recruited a relatively small number of community participants (Ash et al., 2022; Merrill et al., 2022). Additional information on error rates in more recent new-generation sensor device builds is critical in determining the feasibility of applications for these sensors. Second, studies to date have featured extremely small sample sizes (Fairbairn & Kang, 2019; Wang et al., 2019) and a select few have sought to validate new-generation sensors in field settings (Ash et al., 2022; Merrill et al., 2022; Wang et al., 2021). We thus have little sense for how the accuracy of transdermal BAC estimates might be impacted given larger datasets available for model training. Data from larger participant samples will be necessary to establish the reliability, feasibility, and validity of these new-generation devices, with special attention allotted to the recruitment of diverse community samples across both laboratory and real-world settings.
The present study examines transdermal alcohol sensor accuracy using a multimodal design and is among the first studies to examine TAC-BAC translation for new-generation sensors in a field setting. Specifically, we combine a large-scale laboratory investigation of community recruits (N=256) with a pilot field sample (N=27), applying machine learning models to explore the accuracy of transdermal BAC estimates in datasets that vary both in their size as well as the conditions of sampling. Of note, a subset of the laboratory sample was included in previous publications assessing hand-assembled prototypes of new-generation sensors (see Fairbairn & Kang, 2019; Fairbairn et al., 2020 N = 72); the current study more that triples the sample size of this study while also now integrating the newest build of new-generation sensor. With the view to identify research designs suitable to TAC-BAC translation and to glimpse future potential for transdermal sensors upon accrual of additional data, the current study also integrates power-law-curve based projections predicting increases in field sensor accuracy given larger datasets available for training. The aims of the current study are as follows: 1) Offer (updated) error rates of machine-made new-generation sensors in a large community sample; 2) Provide preliminary accuracy levels for BAC estimates from new-generation transdermal alcohol sensors in field settings; 3) Explore the relationship between sample size and both actual (laboratory) and projected (field) increases in accuracy given larger datasets available for model training,
Study 1
Method
Participants
Participants in the study were young healthy social drinkers (ages 21-30). Participants were recruited via advertisements posted in the local community as well as through social media. Exclusion criteria were in line with guidelines for the administration of alcohol in human subjects (National Advisory Council on Alcohol Abuse and Alcoholism, 1989; see also Fairbairn & Kang, 2019). A total of 256 individuals underwent experimental procedures. Due to equipment issues with early Skyn prototype devices (see “Device Failure” section of the results), the final sample consisted of the 195 individuals for whom we were able to obtain Skyn readings. Of this final sample, 110 were randomly assigned to the alcohol condition and 85 to the no-alcohol condition. Regarding biological sex, 55% of participants identified as female and 45% male. Fifty-six percent of participants identified as White, 21% Asian, 6% African-American, and 17% as multiracial or other racial category.
Procedure
A complete description of procedures can be found elsewhere (Fairbairn et al., 2020; Fairbairn & Kang, 2019). Upon arriving at the laboratory, participants were breathalyzed (Intoximeters Alco-Sensor IV) to verify a 0.00% breath alcohol concentration (BrAC). After a baseline period (1-2 hours), beverages were administered in 3 equal parts over 36 minutes. Participants assigned to receive alcohol received a dose intended to achieve a peak BAC approximately equal to the legal driving limit (0.08%), with the exact dose adjusted according to formulas accounting for participants’ approximate body water (see Curtin & Fairchild, 2003). Participants in the no-alcohol condition were administered a non-alcoholic beverage.
Following beverage administration, participants in the alcohol condition provided breathalyzer readings at approximately 30-minute intervals until they left the lab. Participants in the no-alcohol condition were breathalyzed upon arriving in the lab and then again immediately post-drink. No-alcohol participants were allowed to leave after study tasks were completed (5-6 hours a sessions). Alcohol participants were required to remain until BrACs dropped below 0.025% and also SCRAM output registered at least one descending value (6-9 hour sessions).1
Apparatus
The project involved multiple versions or “builds” of the Skyn device. These included two builds representing early hand-assembled Skyn prototypes (referred to here as “Build 1” and “Build 2”) shipped in 2018, and a third machine-made version shipped in 2019 (“Build 3”). Of the 256 participants assigned a Skyn device in this research, 66 were assigned a Build 1 device, 51 a Build 2 device, and 131 a Build 3 device (device Build information missing from 8 participants).
Data Analysis Plan
Data analysis followed procedures employed in our previous research (Fairbairn et al., 2020). We estimated BrAC for a precise time point using TAC time series features (e.g., mean, trends, periodicity) extracted from Skyn during the immediately preceding 30-minute time interval. Time series features were extracted using the Python software package TSFRESH (Christ et al., 2018). To enable our model to learn across both alcohol and no-alcohol conditions we inserted 0.00% BrAC readings for control participants. Given that participants in both conditions were closely monitored during their laboratory visits and were not permitted to bring any personal belongings with them, it was conceivable to infer a 0.00% BrAC during sessions when no alcoholic beverage was administered. Thus, in order to simulate instances for the consumption of non-alcoholic beverages, we added synthetic 0.00% BrAC values every 10 minutes. These additions ensured that predictions could also be produced for individuals who did not drink alcohol, and thus that model accuracy could also be examined for these scenarios. Further, across all experimental conditions, we added a single synthetic 0.00% baseline reading 1 minute before drinking began in each session (see Fairbairn et al., 2020).
In total these procedures formed a set of 3,268 instances (input/output pairs). Importantly, to produce a model that might be applied for real-time BrAC estimation, we only included TAC time series preceding (not following) BrAC readings. Time series features were then entered into Extra-Trees machine learning algorithms (Geurts et al., 2006). We employed 4-fold, participant-independent cross-validation to ensure that predictions were not over-fit to specific data points or participants. In this 4-fold procedure, we created a training set by randomly grouping participants into four groups and a model was trained using data from three of those groups. During training, we tuned hyperparameters for the Extra-Trees algorithm (e.g., tree size, diversity of trees) using nested 4-fold cross-validation within training data only, to avoid overfitting hyperparameters to test data. Once the training phase was complete, the model was subsequently tested on the fourth group. This process was then repeated three more times to ensure that each participant was in the testing set once.
Our primary evaluation metric is mean absolute error (MAE; i.e., L1 distance)—the average absolute difference between actual BrAC values and estimates of BrAC from transdermal data (eBrAC). We report the mean of participant-level MAE values, calculating 95% confidence intervals for the means via bootstrapping with 10,000 iterations (Efron, 1987). To provide additional information, we also evaluate models through the following supplemental metrics: 1) Root mean squared error (RMSE; i.e., L2 distance); 2) Pearson’s r between BrAC and eBrAC across all observations, provided as a standardized effect size metric in line with effects presented in prior transdermal publications (Davidson et al., 1997; Sakai et al., 2006); 3) Standardized coefficients derived from mixed models, which assess the association between eBrAC, entered as the predictor, and BrAC, entered as the outcome, while accounting for participant-level clustering via random effects estimation (Raudenbush & Bryk, 2002).
Results
Descriptives
An average of 10 BrAC readings were collected from alcohol participants after beverage administration. Average maximum BrAC was 0.083% (SD=0.016), and average (post-baseline) minimum was 0.028% (SD=0.015). Of post-baseline alcohol condition BrAC values, 13% were <0.03%, 22% were between 0.03%-0.05%, 30% were between 0.05%-0.07%, 28% were between .07-0.09%, and 7% were ≥0.09%. Refer to Table 1 for detailed descriptive statistics for Skyn TAC values.
Table 1.
Skyn TAC values descriptive statistics
| Study 1 | Study 2 | |
|---|---|---|
| Skyn 5th percentile: | 342.0 | 417.0 |
| Skyn 50th percentile: | 465.0 | 436.67 |
| Skyn 95th percentile: | 1970.28 | 1051.02 |
Note. The Skyn units represent a measure of raw current defined at the sensor.
Device Failures
In total, this research produced 61 missing Skyn files. Failure rates were attributable to a host of software and hardware-related issues. Specifically, 27 Skyn data files were either incomplete, severely truncated, entirely blank, or simply unusable due to device battery issues or failure to record data. There were also 15 instances in which our team experienced data transfer issues causing data loss, and an additional 19 lost files during the initial stages of this project as our team learned to work with the early delicate Skyn Builds (see Fairbairn, Kang, & Bosch, 2020). Device failures were significantly more common in early hand-assembled Skyn prototypes (Builds 1 and 2) and became less common with later machine-made versions of Skyn (Build 3), χ2 (1, N = 256) = 37.70, p < 0.001. Failure rates for Builds 1 and 2 were 29% and 53% respectively. In contrast, the failure rate for the later machine-made Build 3 was 7% (9 device failures yielded from 131 participants run). All participants for whom we had useable Skyn data were included in our final sample.
Model Evaluation
Across all participants and both alcohol and no-alcohol conditions, the average difference between actual BrAC and eBrAC (i.e., MAE) was 0.009, 95%CI [0.008, 0.010]. The average correlation between BrAC and eBrAC was r=0.913, 95%CI [0.907, 0.919] and RMSE was 0.012, 95%CI [0.010, 0.013]. As in prior research (Fairbairn et al., 2020), here we found model accuracy to be lower (i.e., MAE higher) in the alcohol condition [M=0.016, SD=0.013] vs. the no-alcohol condition [M=0.001, SD=0.004], b=0.015, SE=0.001, t=27.57, p<0.001. Of note, model accuracy did not differ significantly as a function of Skyn device build—a single model based on data from three distinct versions of the Skyn device yielded high accuracy irrespective of specific Skyn device build (see table 2). MAE also did not differ significantly as a function of participant gender, age, or drinking patterns. Minor discrepancies emerged across racial categories, although relatively small sample sizes in specific racial categories indicate a need for replication of such effects (see Table 2 for full results). Follow-up model comparisons indicated that the combination of machine learning and time series methods outperformed more parsimonious models: a basic linear regression model produced an error that was more than double that of the final machine learning model, MAE=0.021, 95%CI [0.019, 0.023], while a model employing machine learning methods but no time series analysis produced an error that was 56% higher than our final model, MAE=0.014 95%CI [0.012, 0.016]. Graphs for “average” prediction cases produced by our final model appear in Figure 1.
Table 2.
MAE as a function of participant and device characteristics in Study 1
| b | SE | t | p | |
|---|---|---|---|---|
| Gender | −0.0009 | 0.0005 | −1.60 | 0.1113 |
| Age | 0.0002 | 0.0002 | 0.81 | 0.4211 |
| Days Drink/30 | −0.0001 | 0.0001 | −1.74 | 0.0833 |
| Race | ||||
| White | 0.0009 | 0.0008 | 1.20 | 0.2331 |
| Black | 0.0013 | 0.0011 | 1.23 | 0.2184 |
| Asian | 0.0020 | 0.0010 | 1.98 | 0.0492 |
| Skyn Version | ||||
| Build 1 | −0.0006 | 0.0007 | −0.80 | 0.4227 |
| Build 2 | 0.0003 | 0.0010 | 0.30 | 0.7626 |
Note. The above represent coefficients derived from multilevel models predicting MAE (average absolute distance between measured BrAC and eBrAC) while accounting for clustering of observations within participants. All variables were entered into separate models. All models control for beverage condition assignment.
Gender was coded such that Female=1 and Male=0. “Days Drink/30”=number of days reported drinking at baseline out of past 30; Race was coded as a set of dummy codes, with “Other/Multiracial” as the reference group; Skyn Version was coded as a set of dummy codes, with Build 3 as the reference group.
Figure 1. Graphs for participants with average (Median MAE) prediction accuracy from both alcohol and no-alcohol conditions in Study 1.
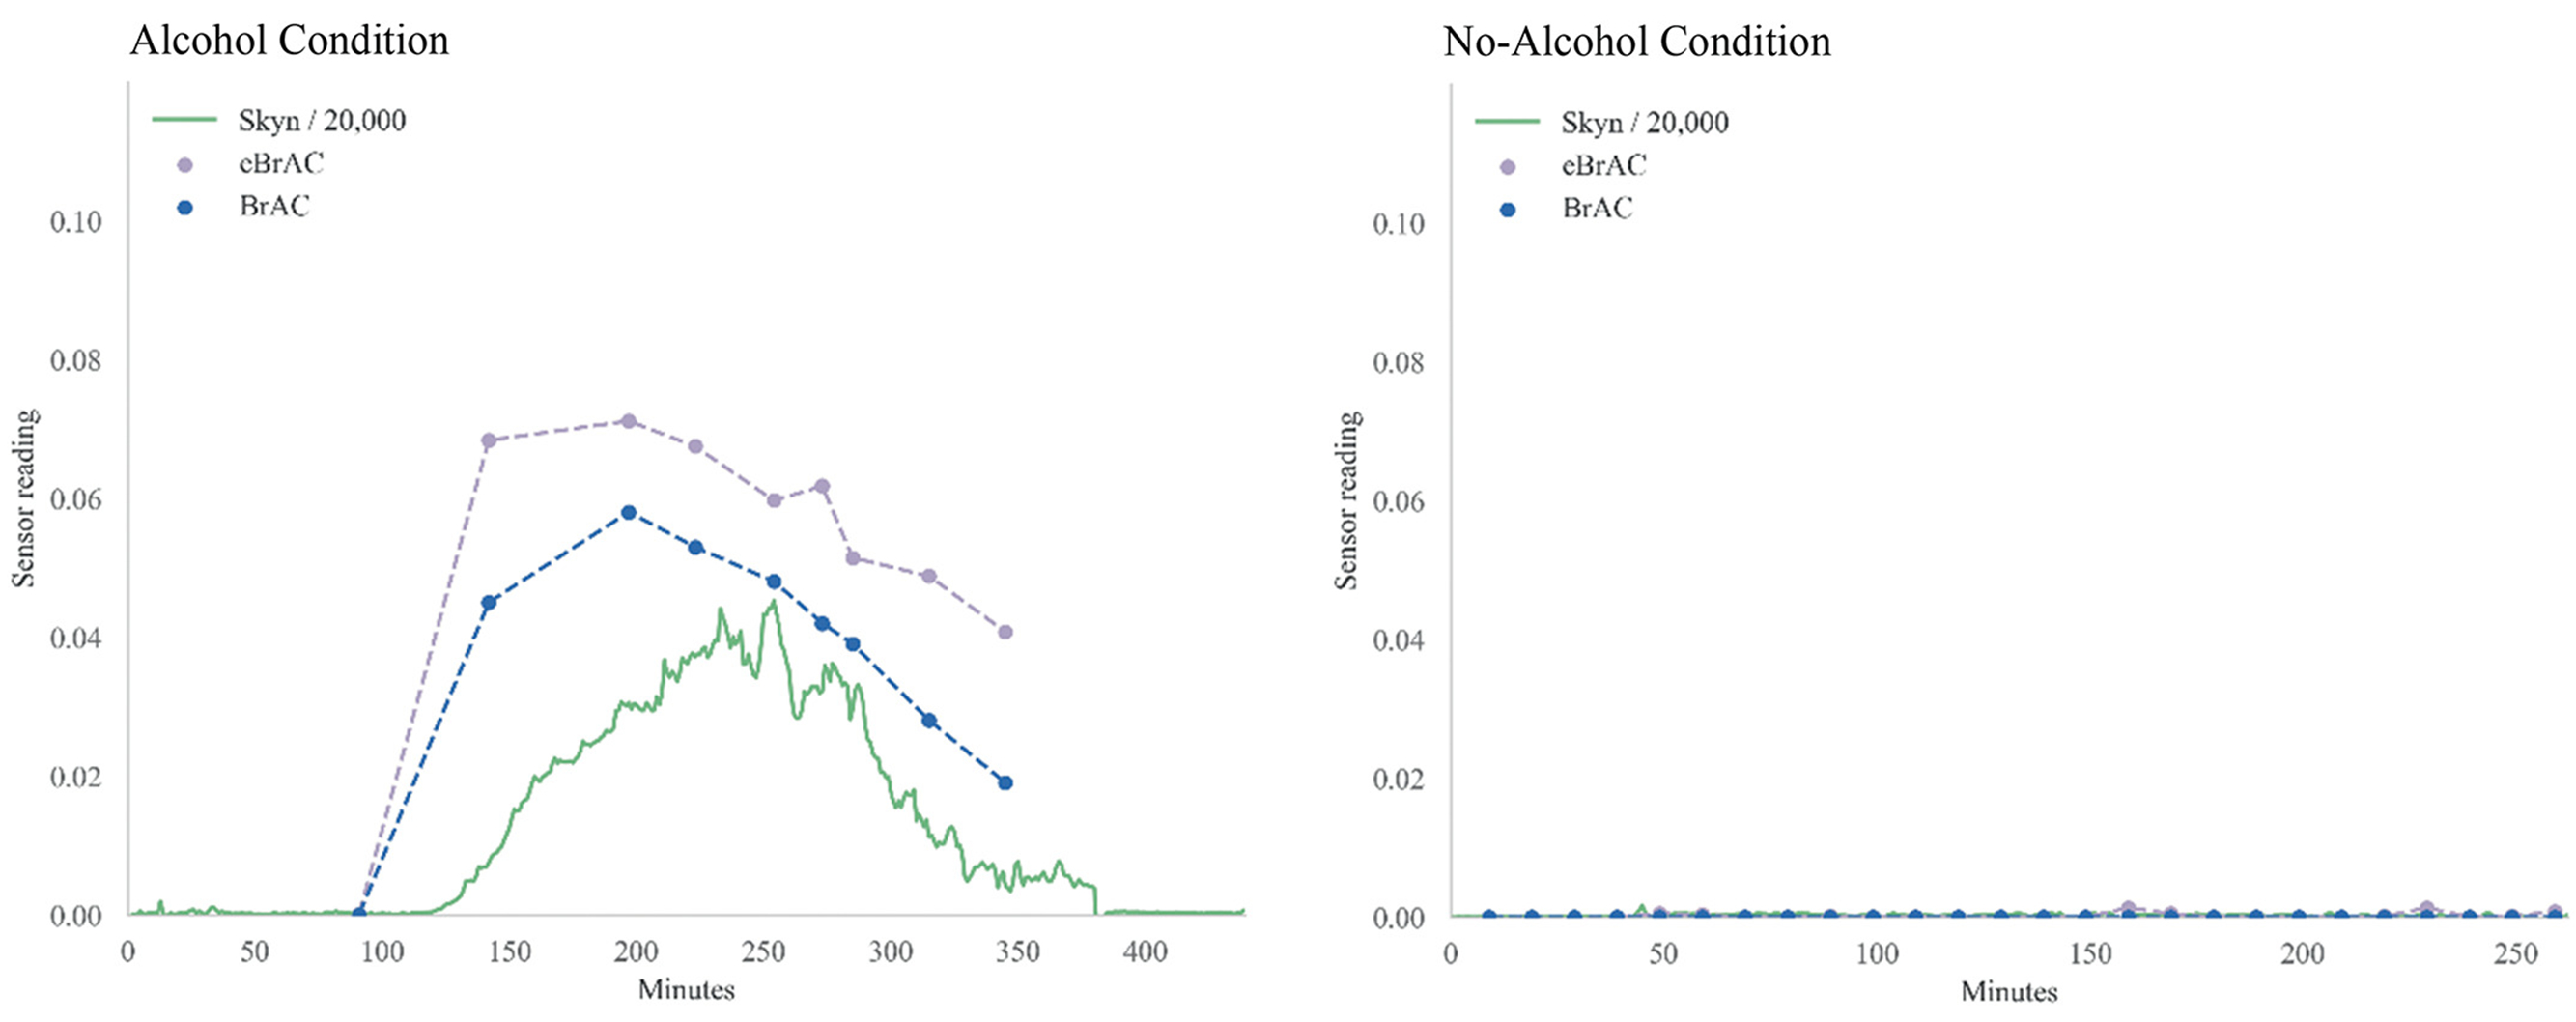
Note. For the purposes of graphs displayed here, data from Skyn was transformed (divided by 20,000) such that it could be visualized on approximately the same scale as eBrAC and BrAC.
Study 1 Discussion
This laboratory trial represents the largest study conducted to date validating transdermal sensors using objective alcohol measures (Fairbairn & Bosch, 2021). Results of this study indicate that error rates for more recent versions of new-generation transdermal sensors have improved markedly since earlier hand-made prototypes of these devices (Fairbairn et al., 2020; Fairbairn & Kang, 2019). It is important to note that while the device failure rates were somewhat higher for Build 2 compared to the earlier Build 1, the build dates were proximal and, further, our sample size for determining failure rates for Build 2 was substantially smaller (k=2 devices). Thus, failure rates for this slightly later version are less well approximated in the current research.
In addition, results provide further support for the notion that it is possible to create highly accurate real-time estimates of BrAC from transdermal data under controlled conditions, and further that BrAC estimates based on machine learning outperform estimates based on traditional regression-based approaches. However, and importantly, this study featured a single fixed dose of alcohol and the laboratory context held constant many environmental factors (e.g., temperature, physical exertion, environmental alcohol) likely to impact the TAC-BAC link in everyday contexts. As a result, although other performance indicators can be derived from such laboratory studies, specific accuracy estimates based on this research carry little utility in predicting transdermal sensor accuracy in real-world settings. Research exploring the performance of these sensors in field contexts is key.
Study 2
Methods
Participants
Participants in the study consisted of young regular drinkers. Participants were recruited from the psychology undergraduate subject pool at the University of Illinois. To ensure sufficient frequency of drinking for ambulatory assessment, participants were required to consume alcohol at least 3 times weekly in order to meet inclusion criteria for the study. A total of 26 individuals underwent study procedures. The final sample consisted of the 23 individuals who complied with experimental procedures and for whom we were able to obtain useable breathalyzer and Skyn readings. The average age of participants in this study was 19 (SD=1.5). Regarding biological sex, participants identified as 65% female and 35% male. Seventy four percent of participants identified as White, 22% Asian, and 4% as multiracial.
Procedures
Participants in this study wore the Skyn transdermal sensor for 5 days while breathing into a breathalyzer in response to prompted assessments on their smartphones as they went about their everyday lives. Devices employed in this study included only a single version of the Skyn device—the more recent machine-made version shipped in 2019 (“Build 3”). At study initiation, participants attended a laboratory visit during which they were trained to use the ambulatory survey platform (Metricwire Software; Trafford, 2016), the mobile breathalyzer, and the Skyn device. The BACtrack Mobile breathalyzer was chosen as a device with a compact/portable design that has proven to have strong correspondence with blood alcohol levels (Delgado et al., 2017). In order to reduce the chances that breathalyzer readings captured in everyday life would be biased by residual mouth alcohol, participants were instructed to wait before breathing into the breathalyzer if they had recently consumed an alcoholic beverage, and were also provided with a demonstration of the impact of mouth alcohol at their study initiation visit (i.e., Listerine mouth rinse followed by breathalyzer reading). Once Skyn was activated for a participant, the researchers trained them on how to use it. Specifically, participants were shown how to double check that the device was powered “on” and paired with their phone, as well as how to ensure that the Skyn data was syncing to the accompanying Skyn phone application. Of note, the ambulatory assessment period was scheduled to coincide with a weekend, to enhance the probability of capturing multiple drinking episodes during the 5-day study period.
During the ambulatory monitoring period, a schedule of assessments was employed intended to oversample moments of intoxication. More specifically, in line with procedures used in prior research (Piasecki et al., 2011, 2012), participants provided breathalyzer readings in response to three types of prompts: a) Random Prompts—these prompts sounded 6X/day during participants’ waking hours; b) User-Initiated Drinking Reports—participants were trained to log a user-initiated drinking report before taking the first sip of an alcoholic beverage in a drinking episode; and c) Drinking Follow-Ups—once participants initiated a drinking report, they were prompted to provide a breathalyzer reading every 30 minutes until three hours had passed.2 Further, in these surveys, participants had the option to indicate whether they believed a breathalyzer reading they took was affected by mouth alcohol.
Data analysis followed the same procedures as in Study 1.
Results
Descriptives
Participants provided a total of 545 breathalyzer readings during engagement with the study (an average of 24 readings/participant), with 245 of these readings provided while participants were actively consuming alcohol. Over the course of the 5 days, participants reported positive BAC readings on half of these days with an average of 2.3 days of drinking across participants. For readings taken during drinking episodes, average BrAC was 0.094 (SD=0.061; range 0.007 to >.2%). Descriptive statistics for the Skyn TAC values collected over the course of the study are provided in Table 1.
Data Loss and Device Failures
Of our original sample of 26 participants, two were excluded from analyses because they did not follow study procedures. Specifically, two participants failed to provide more than a single verified breathalyzer reading and also failed to activate the Skyn device. Data from one additional participant was lost for unknown reasons—it was unclear whether the issue was Skyn device error or rather incorrect data transfer on the part of study personnel. The overall error rate for the machine-made Skyn devices (“Build 3”) employed in this study was 0%-4%. Of note, we also excluded BAC readings that were impacted by mouth alcohol. Two criteria were used to identify these readings including 1) any reading with a BAC>.25, and 2) any reading flagged as being affected by mouth alcohol by the participant.
Model Evaluation
Across all readings captured in this research, the average difference between actual BrAC and eBrAC (MAE) was 0.019, 95%CI [0.015, 0.025]. The average correlation between BrAC and eBrAC was 0.816, 95%CI [0.786, 0.842] and RMSE was 0.030, 95%CI [0.023, 0.036] Note that, even when sober instances (BrAC=0.00%) were excluded outright from the model, BrAC and eBrAC were significantly correlated, r=0.575, 95%CI [0.485, 0.655]. However, here as in our laboratory research, we found model accuracy to be significantly lower (i.e., MAE higher) when participants were consuming alcohol [M=0.041, SD=0.031] vs. when they were sober [M=0.006, SD=0.012], b=0.033, SE=0.003, t=11.59, p<0.001. MAE did not differ significantly as a function of participant gender, age, race, or drinking patterns (see Table 3 for full results). Follow-up model comparisons indicated that the combination of machine learning and time series methods outperformed more parsimonious models: a basic linear regression model produced an error that was approximately 80% higher than that of the final machine learning model, MAE=0.034, 95%CI [0.028, 0.040].
Table 3.
MAE as a function of participant and device characteristics in Study 2
| b | SE | t | p | |
|---|---|---|---|---|
| Gender | −0.004 | 0.006 | −0.71 | 0.483 |
| Age | 0.001 | 0.002 | 0.43 | 0.672 |
| Days Drink/30 | 0.0002 | 0.0004 | 0.46 | 0.649 |
| Race | ||||
| White | 0.007 | 0.003 | 2.03 | 0.056 |
| Asian | −0.004 | 0.003 | −1.51 | 0.145 |
Note. The above represent coefficients derived from multilevel models predicting MAE (average absolute distance between measured BrAC and eBrAC) while accounting for clustering of observations within participants. All variables were entered into separate models.
Gender was coded such that Female=1 and Male=0. “Days Drink/30”=number of days reported drinking at baseline out of past 30; Race was coded as a set of dummy codes, with “Other/Multiracial” as the reference group.
Integrative Analysis and Power Law Curve Projections
In this section, we leveraged the combined strengths of Study 1 and Study 2 to offer a projection of the accuracy-level of transdermal alcohol sensors in future given adequately sized datasets for model training. Although Study 2 examined transdermal sensors in real-world conditions, the sample size of this study is extremely small for the purposes of machine learning and thus results of Study 2 are unlikely to provide a clear picture of transdermal sensor performance in future given appropriately sized datasets. In contrast, although Study 1 examined transdermal sensors only in controlled laboratory contexts, the dataset has the advantage of being more optimally sized for data-driven model types (>3,000 BrAC readings used as outcomes in analysis), thus offering a clearer picture of potential increases in model accuracy given adequate data.
Here, leveraging data yielded by both studies, we provided a Power Law Curve projection—a function that offers predictions surrounding potential changes in model accuracy as the size of the training dataset increases (Cortes et al., 1994; Figueroa et al., 2012). Specifically, a power law curve was constructed by building machine learning models on the basis of data sub-divisions (e.g., 20%-90% of the final N) and estimating how model accuracy changes as the sample size increases. To construct a power law curve projection, we leveraged data from both laboratory and ambulatory samples, estimating the curve’s “starting value” through data yielded from the preliminary ambulatory sample (MAE=0.019, for all datapoints; MAE=0.041 for alcohol episodes), and estimating the power law curve “shape” through examining the extent to which accuracy increased with more data in the context of our larger laboratory study.
Based on projections that integrated all datapoints, including sober and intoxicated moments, we estimate MAE would reduce to <0.0137 given N = 200 (see Figure 2). In other words, if this projection were accurate, given access to larger ambulatory training datasets, transdermal estimates of BAC might ultimately be estimated to an accuracy level of 0.014% of true BAC. Given that, across both studies, the error of eBrAC values during drinking episodes exceeded error during non-drinking episodes, we repeated this projection excluding sober moments (eBrAC>0.00), yielding a projected MAE of 0.026% given N = 200. This value suggests that, given access to larger ambulatory training datasets, transdermal estimates of BAC during moments of intoxication might ultimately be estimated to an accuracy level of 0.026% of true BAC.
Figure 2.
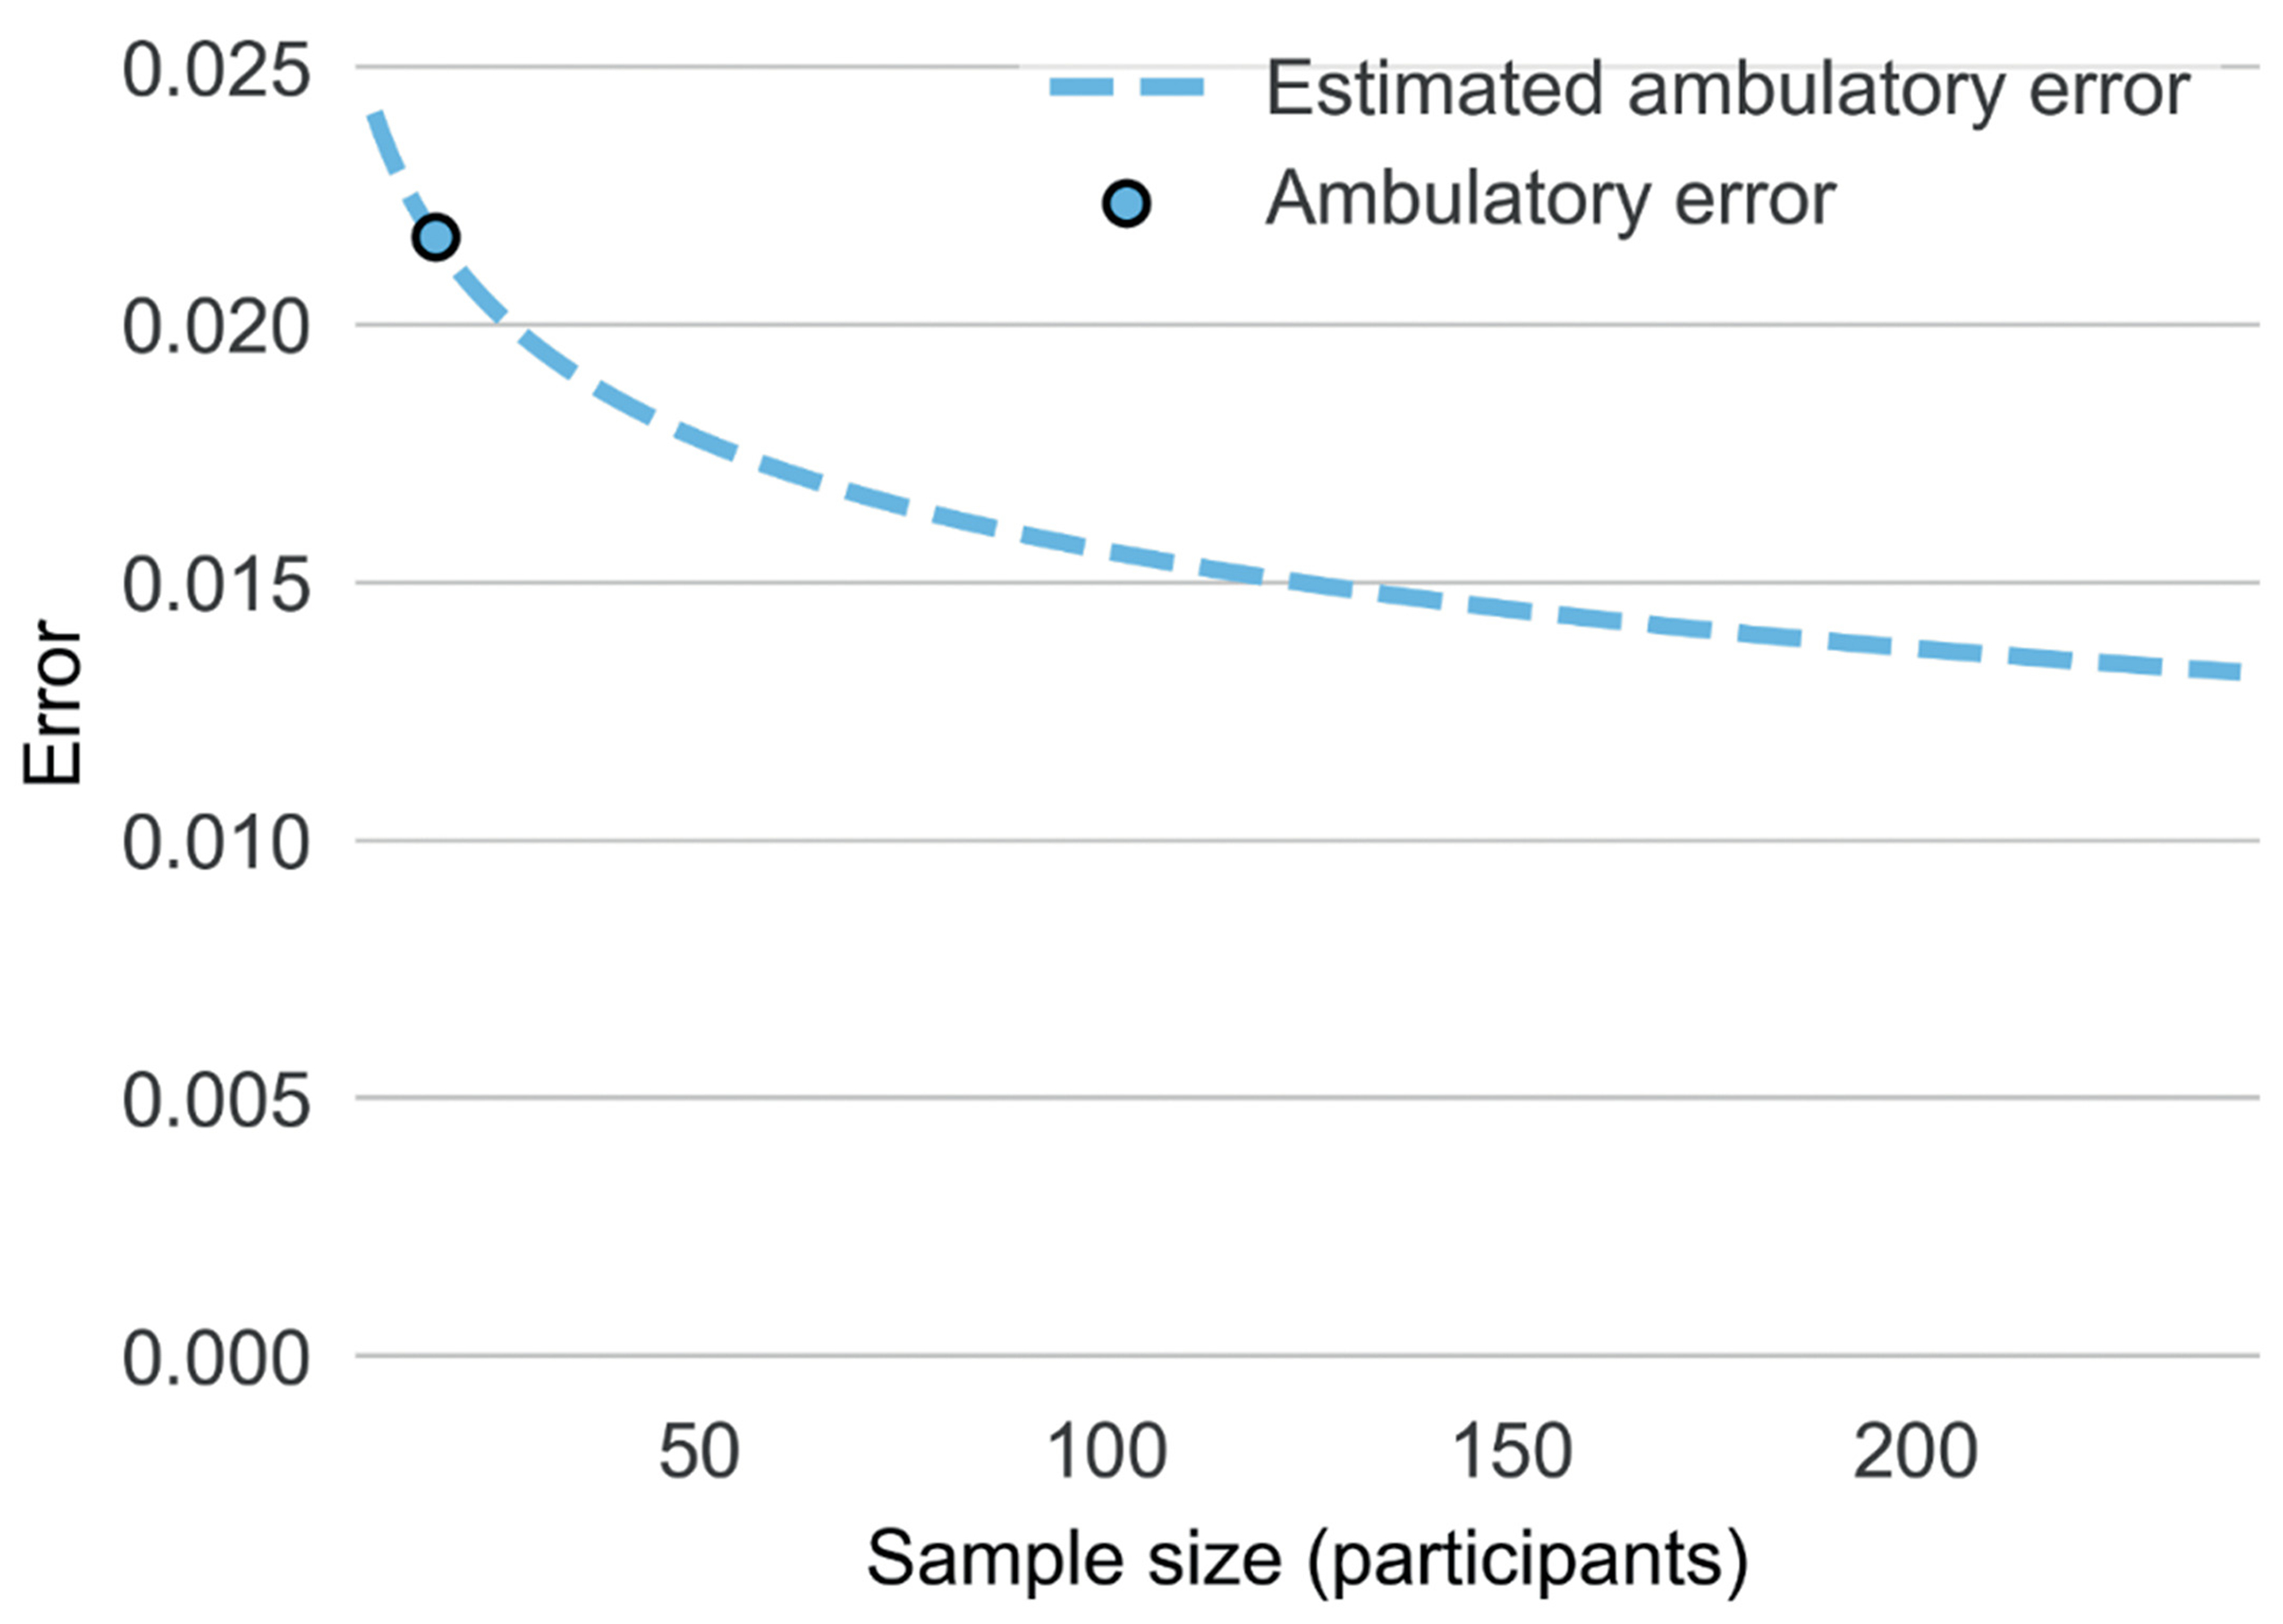
Power law curve projections of potential increases in the accuracy of transdermal BAC estimates in real-world contexts as sample size available for model training increase. Of note the figure above denotes estimates for overall level BrAC (and not participant-level eBAC).
Discussion
The current study offers an updated account of the performance of new-generation transdermal sensors, providing what is to our knowledge among the first report of the accuracy of BAC estimates from new-generation transdermal devices in field contexts. Results of this study indicate that the most recent build of new-generation transdermal sensors demonstrates a substantially lower error rate compared to older hand-assembled prototypes of this sensor (0%-7% vs 29%-53%). Findings from our pilot ambulatory study indicate that, even given a small sample for model training (N=23) and large BrAC range (0.007%->0.2%), real-time estimates of BrAC yielded by transdermal sensors are on average within 0.019% of true BrAC readings taken in field contexts (0.041% for alcohol episodes). In addition, data from both laboratory and ambulatory studies indicate that machine learning models for translating TAC data yield significantly more accurate estimates of BAC compared to traditional analytic approaches, such as linear regression. Finally, results of power law curve analyses suggest that the accuracy of transdermal BAC estimates in field contexts have the potential to improve substantially given larger datasets for model training.
Results of this study indicate promise for this new generation of wrist-worn transdermal sensor. Note that prior iterations of wrist-worn transdermal sensors were plagued by high device failure rates (Marques & McKnight, 2009) and, when early hand-assembled prototypes of new-generation sensors were first examined, it appeared possible these new devices would be prone to similar problems (Fairbairn & Kang, 2019). Thus, our report of low error rates for the latest build of new-generation sensors, including in field contexts, represents an auspicious result. In addition, results of this study provide the first BrAC estimates for new-generation transdermal sensors in a field context, indicating that, even in a severely underpowered pilot dataset, transdermal estimates of BrAC emerge as accurate to within 1-2 standard drinks (0.019-0.041%) of true BrAC. Importantly, all predictions yielded by this research represent “real-time” BrAC estimates—produced for a given time point based only on BrAC readings collected prior to that moment in time. Note that, in light of delays between the time alcohol is present in the blood and when it can be detected at the skin’s surface, many researchers have expressed doubt as to whether real-time estimation of intoxication from transdermal sensors would be feasible (Marques & McKnight, 2009). In this context, these preliminary findings are noteworthy. Finally, in the context of a transdermal sensor validation literature characterized by extremely small sample sizes (average N<20; Fairbairn & Bosch, 2021), results of power law curve projections point to the importance of conducting transdermal sensor research featuring larger samples of participants. Specifically, projections suggest that underpowered studies are unlikely to yield accurate information on the capabilities for such sensors to predict alcohol use across individuals and contexts.
In addition, this work offers a glimpse at some of the challenges that lie ahead for the transdermal measurement of alcohol consumption. Results of this study indicate that the accuracy of transdermal estimates of BAC decreases as consumption level increases, with error emerging as larger during episodes of alcohol consumption vs. during sobriety. Thus, producing accurate transdermal estimates of BAC during intoxicated moments, including at higher BAC levels, represents a challenge for future research. Of note, although the 0.041% average error yielded by this pilot field study is non-optimal for some applications, it is worth noting that even this accuracy level may be sufficient for many transdermal alcohol sensor functions. More specifically, beyond the precise quantification of BAC, a transdermal device capable of categorizing drinking levels into broader, category-focused drinking measures (e.g., abstinence, low risk, or high-risk drinking), and/or the identification of drinking episodes in near real time might have a range of potential applications, including in prevention, intervention, and research. In addition, power law curves indicate that the accuracy of machine learning estimates of BrAC from transdermal data is likely to increase markedly given access to larger datasets for model training. Future research should continue to explore the validity of new-generation sensor data using objective drinking indicators in large samples under field conditions.
While it is unlikely that transdermal biosensors will replace traditional methods of BAC measurement, they nonetheless represent a useful addition to our measurement toolkit. This new tracking technology can potentially help researchers better understand the proximal and distal factors driving alcohol use disorder risk and maintenance in naturalistic environments, thereby enabling more targeted prevention efforts (Luczak et al., 2018; Piasecki, 2019). In therapeutic contexts, the integration of such devices might provide fertile ground for conversation between patients and their providers to create more individualized treatment plans as part of a harm reduction approach (Barnett et al., 2015; Dougherty et al., 2014). Lastly, in the public health domain the commercialization of such alcohol monitoring devices may allow consumers to gain valuable insights into their drinking patterns and by extension minimize alcohol-related morbidity and mortality (Fairbairn & Kang, 2020).
Additional limitations of this work should be noted. Prior research indicates that factors varying within individuals across contexts can impact the TAC-BAC relationship. While we were able to determine how our BAC estimations change as a function of demographic variables (e.g., gender and race), we were not able to isolate the influence of context-level variables such as sweating levels or rate of consumption (Piasecki, 2019; Saldich et al., 2021). Future research may choose to consider how such moderators affect the TAC-BAC relationship. Further, it is important to note that while we chose to analyze the data using a machine learning approach, other frameworks beyond linear regression exist that can be well suited for the modelling of complex relationships (Kryshchenko et al., 2021; Oszkinat et al., 2022; Sirlanci et al., 2018, 2019). Specifically, first principles models require less data because they leverage expert knowledge to model for TAC-BAC translation; whereas machine learning approaches are more data-driven and can potentially uncover previously unknown associations between variables given enough data. Future work may aim to directly compare (and combine) these two modeling approaches. Finally, the need for additional field research incorporating larger samples has been indicated. It is worth noting, however, that the myriad factors that can interact to influence the TAC-BAC link may be difficult to parse using field methods alone. Well-powered laboratory studies with the potential to isolate metabolic and environmental influences on TAC (e.g., drinking rate, sweating level, environmental alcohol) could be useful in isolating variable influences on the TAC-BAC relationship, thus training models to recognize distinct patterns associated with specific contextual factors and ultimately applying these to data collected in field contexts.
In summary, the current study offers updated information on the performance of the newest generation of transdermal alcohol biosensor. Findings indicate the latest version of these devices exhibit relatively low failure rates and hold promise for the assessment of alcohol consumption in field contexts. A great deal of additional work is left to be done before we have a full picture of the utility of these devices. Nonetheless, with additional research, such passive, objective sensors hold potential for having a lasting impact on the manner in which researchers, clinicians, and consumers might approach alcohol consumption assessment into the future.
Acknowledgments
This research was supported by National Institutes of Health Grants R01AA028488 and R01AA025969 to Catharine E. Fairbairn. Our thanks to Brynne Velia, Laura Gurrieri, Dahyeon Kang, and Zoe Lee for their support with data collection for this study. C.E.F. received transdermal devices at discounted rates from BACtrack for the purposes of performing validation research. BACtrack did not have a role in conducting, evaluating, or disseminating the research. We have no known conflicts of interest to disclose.
Footnotes
Given the relatively substantial dose of alcohol administered in the current study, and the time required for alcohol metabolism, it was not feasible to keep participants in the lab to 0.00% BrAC. However, using the current procedures, we were able to capture the majority of the descending BAC limb for all participants.
In the final weeks of this research, we had to modify procedures in response to COVID-19. Thus, of the original sample of 26 participants, one participant engaged in a slightly modified version of study procedures. Modifications included: 1) All experimental visits were conducted online vs. in the laboratory; 2) Rather than completing user-initiated and follow-up assessments via Metricwire, an increased frequency of random assessments was employed (13X/day) and assessments were completed via the ambulatory survey platform Expiwell. All other study procedures were identical for this final participant vs the other 25 participants in the study.
References
- Alessi SM, Barnett NP, & Petry NM (2017). Experiences with SCRAMx alcohol monitoring technology in 100 alcohol treatment outpatients. Drug and Alcohol Dependence, 178, 417–424. [DOI] [PMC free article] [PubMed] [Google Scholar]
- Ash GI, Gueorguieva R, Barnett NP, Wang W, Robledo DS, DeMartini KS, Pittman B, Redeker NS, O’Malley SS, & Fucito LM (2022). Sensitivity, specificity, and tolerability of the BACTrack Skyn compared to other alcohol monitoring approaches among young adults in a field-based setting. Alcoholism: Clinical and Experimental Research, 46(5), 783–796. 10.1111/acer.14804 [DOI] [PMC free article] [PubMed] [Google Scholar]
- Barnett NP (2015). Alcohol sensors and their potential for improving clinical care. Addiction, 110(1), 1–3. [DOI] [PubMed] [Google Scholar]
- Barnett NP, Souza T, Glynn TR, Luczak SE, Swift R, & Rosen IG (2015). The Transdermal Alcohol Sensor Macro (TASMAC): A rapid data processing tool for use with the SCRAMx alcohol sensor. Alcoholism: Clinical & Experimental Research, 39, 192A. [Google Scholar]
- Caddy GR, Sobell MB, & Sobell LC (1978). Alcohol breath tests: Criterion times for avoiding contamination by “mouth alcohol.” Behavior Research Methods & Instrumentation, 10(6), 814–818. 10.3758/BF03205406 [DOI] [Google Scholar]
- Caluzzi G, Pennay A, Cook M, Wright C, Norman T, & Kuntsche E (2019). Transdermal monitors to assess alcohol consumption in real-time and real-life—A qualitative study on user-experience. Addiction Research and Theory, 27(4), 354–361. [Google Scholar]
- Cherpitel CJ, Ye Y, Stockwell T, Vallance K, & Chow C (2018). Recall bias across 7 days in self-reported alcohol consumption prior to injury among emergency department patients. Drug and Alcohol Review, 37(3), 382–388. 10.1111/dar.12558 [DOI] [PMC free article] [PubMed] [Google Scholar]
- Christ M, Braun N, Neuffer J, & Kempa-Liehr AW (2018). Time series feature extraction on basis of scalable hypothesis tests (tsfresh–a python package). Neurocomputing, 307, 72–77. [Google Scholar]
- Cortes C, Jackel LD, Solla SA, Vapnik V, & Denker JS (1994). Learning curves: Asymptotic values and rate of convergence. Advances in Neural Information Processing Systems, 327–334. [Google Scholar]
- Curtin JJ, & Fairchild BA (2003). Alcohol and cognitive control: Implications for regulation of behavior during response conflict. Journal of Abnormal Psychology, 112(3), 424–436. 10.1037/0021-843X.112.3.424 [DOI] [PubMed] [Google Scholar]
- Davidson D, Camara P, & Swift R (1997). Behavioral effects and pharmacokinetics of low-dose intravenous alcohol in humans. Alcoholism: Clinical and Experimental Research, 21(7), 1294–1299. [PubMed] [Google Scholar]
- Delgado MK, Huang Y, Wanner K, Goldberg E, Hemmons J, Spencer E, & Wetherill R (2017). Test accuracy of smartphone-paired breathalysers: A validation study. Injury Prevention, 23. [Google Scholar]
- Dougherty DM, Charles NE, Acheson A, John S, Furr RM, & Hill-Kapturczak N (2012). Comparing the detection of transdermal and breath alcohol concentrations during periods of alcohol consumption ranging from moderate drinking to binge drinking. Experimental and Clinical Psychopharmacology, 20(5), 373–381. [DOI] [PMC free article] [PubMed] [Google Scholar]
- Dougherty DM, Hill-Kapturczak N, Liang Y, Karns TE, Cates SE, Lake SL, Mullen J, & Roache JD (2014). Use of continuous transdermal alcohol monitoring during a contingency management procedure to reduce excessive alcohol use. Drug & Alcohol Dependence, 142, 301–306. [DOI] [PMC free article] [PubMed] [Google Scholar]
- Efron B. (1987). Better bootstrap confidence intervals. Journal of the American Statistical Association, 82(397), 171–185. [Google Scholar]
- Ernhart CB, Morrow-Tlucak M, Sokol RJ, & Martier S (1988). Underreporting of alcohol use in pregnancy. Alcoholism: Clinical and Experimental Research, 12(4), 506–511. [DOI] [PubMed] [Google Scholar]
- Fairbairn CE, & Bosch N (2021). A new generation of transdermal alcohol biosensing technology: Practical applications, machine learning analytics, and questions for future research. Addiction, 116(10), 2912–2920. [DOI] [PMC free article] [PubMed] [Google Scholar]
- Fairbairn CE, Bresin K, Kang D, Rosen IG, Ariss T, Luczak SE, Barnett NP, & Eckland NS (2018). A multimodal investigation of contextual effects on alcohol’s emotional rewards. Journal of Abnormal Psychology, 127(4), 359–373. 10.1037/abn0000346 [DOI] [PMC free article] [PubMed] [Google Scholar]
- Fairbairn CE, & Kang D (2019). Temporal dynamics of transdermal alcohol concentration measured via new-generation wrist-worn biosensor. Alcoholism: Clinical and Experimental Research, 43(10), 2060–2069. 10.1111/acer.14172 [DOI] [PMC free article] [PubMed] [Google Scholar]
- Fairbairn CE, & Kang D (2020). Transdermal alcohol monitors: Research, applications, and future directions. In Frings D & Albery I (Eds.), The Handbook of Alcohol Use and Abuse. Elsevier. [Google Scholar]
- Fairbairn CE, Kang D, & Bosch N (2020). Using machine learning for real-time BAC estimation from a new-generation transdermal biosensor in the laboratory. Drug and Alcohol Dependence, 216, 108205. 10.1016/j.drugalcdep.2020.108205 [DOI] [PMC free article] [PubMed] [Google Scholar]
- Fairbairn CE, Rosen IG, Luczak SE, & Venerable WJ (2019). Estimating the quantity and time course of alcohol consumption from transdermal alcohol sensor data: A combined laboratory-ambulatory study. Alcohol, 81, 111–116. 10.1016/j.alcohol.2018.08.015 [DOI] [PMC free article] [PubMed] [Google Scholar]
- Figueroa RL, Zeng-Treitler Q, Kandula S, & Ngo LH (2012). Predicting sample size required for classification performance. BMC Medical Informatics and Decision Making, 12(1), 8. [DOI] [PMC free article] [PubMed] [Google Scholar]
- Frey LJ, & Fisher DH (1999, January 3). Modeling decision tree performance with the power law. Seventh International Workshop on Artificial Intelligence and Statistics. Seventh International Workshop on Artificial Intelligence and Statistics. https://proceedings.mlr.press/r2/frey99a.html [Google Scholar]
- Fridberg DJ, Wang Y, & Porges E (2022). Examining features of transdermal alcohol biosensor readings: A promising approach with implications for research and intervention. Alcoholism: Clinical and Experimental Research, 46(4), 514–516. [DOI] [PMC free article] [PubMed] [Google Scholar]
- Geurts P, Ernst D, & Wehenkel L (2006). Extremely randomized trees. Machine Learning, 63(1), 3–42. [Google Scholar]
- Gullberg RG (1992). The elimination rate of mouth alcohol: Mathematical modeling and implications in breath alcohol analysis. Journal of Forensic Science, 37(5), 1363–1372. [PubMed] [Google Scholar]
- Kryshchenko A, Sirlanci M, & Vader B (2021). Nonparametric Estimation of Blood Alcohol Concentration from Transdermal Alcohol Measurements Using Alcohol Biosensor Devices. In Advances in Data Science (pp. 329–360). Springer. [Google Scholar]
- Leffingwell TR, Cooney NJ, Murphy JG, Luczak S, Rosen G, Dougherty DM, & Barnett NP (2013). Continuous objective monitoring of alcohol use: Twenty-first century measurement using transdermal sensors. Alcoholism: Clinical and Experimental Research, 37(1), 16–22. 10.1111/j.1530-0277.2012.01869.x [DOI] [PMC free article] [PubMed] [Google Scholar]
- Luczak SE, Hawkins AL, Dai Z, Wichmann R, Wang C, & Rosen IG (2018). Obtaining continuous BrAC/BAC estimates in the field: A hybrid system integrating transdermal alcohol biosensor, Intellidrink smartphone app, and BrAC Estimator software tools. Addictive Behaviors, 83, 48–55. [DOI] [PMC free article] [PubMed] [Google Scholar]
- Luczak SE, & Ramchandani VA (2019). Special issue on alcohol biosensors: Development, use, and state of the field. Alcohol, 81, 161–165. [DOI] [PubMed] [Google Scholar]
- Luczak SE, & Rosen IG (2014). Estimating BrAC from transdermal alcohol concentration data using the BrAC estimator software program. Alcoholism: Clinical and Experimental Research, 38(8), 2243–2252. 10.1111/acer.12478 [DOI] [PMC free article] [PubMed] [Google Scholar]
- Marques PR, & McKnight AS (2009). Field and laboratory alcohol detection with 2 types of transdermal devices. Alcoholism: Clinical and Experimental Research, 33(4), 703–711. [DOI] [PubMed] [Google Scholar]
- Merrill J, Gunn R, Neary A, Souza T, & Barnett N (2022). Feasibility and Acceptability of a Wrist-worn Transdermal Alcohol Biosensor to Collect Data in the Field. Proceedings of the 55th Hawaii International Conference on System Sciences. [Google Scholar]
- Mjolsness E, & DeCoste D (2001). Machine learning for science: State of the art and future prospects. Science, 293(5537), 2051–2055. [DOI] [PubMed] [Google Scholar]
- National Advisory Council on Alcohol Abuse and Alcoholism. (1989). Recommended Council Guidelines on Ethyl Alcohol Administration on Human Experimentation. [Google Scholar]
- Nyman E, & Palmlöv A (1936). The Elimination of Ethyl Alcohol in Sweat. Skandinavisches Archiv Für Physiologie, 74(2), 155–159. 10.1111/j.1748-1716.1936.tb01150.x [DOI] [Google Scholar]
- Oszkinat C, Luczak SE, & Rosen IG (2022). Uncertainty Quantification in Estimating Blood Alcohol Concentration From Transdermal Alcohol Level With Physics-Informed Neural Networks. IEEE Transactions on Neural Networks and Learning Systems, 1–8. 10.1109/TNNLS.2022.3140726 [DOI] [PMC free article] [PubMed] [Google Scholar]
- Piasecki TM (2019). Assessment of alcohol use in the natural environment. Alcoholism: Clinical and Experimental Research, 43(4), 564–577. 10.1111/acer.13975 [DOI] [PMC free article] [PubMed] [Google Scholar]
- Piasecki TM, Jahng S, Wood PK, Robertson BM, Epler AJ, Cronk NJ, Rohrbaugh JW, Heath AC, Shiffman S, & Sher KJ (2011). The subjective effects of alcohol–tobacco co-use: An ecological momentary assessment investigation. Journal of Abnormal Psychology, 120(3), 557–571. 10.1037/a0023033 [DOI] [PMC free article] [PubMed] [Google Scholar]
- Piasecki TM, Wood PK, Shiffman S, Sher KJ, & Heath AC (2012). Responses to alcohol and cigarette use during ecologically assessed drinking episodes. Psychopharmacology, 223(3), 331–344. 10.1007/s00213-012-2721-1 [DOI] [PMC free article] [PubMed] [Google Scholar]
- Raudenbush SW, & Bryk AS (2002). Hierarchical linear models: Applications and data analysis methods (Vol. 2). Sage Publications. [Google Scholar]
- Russell MA, Turrisi RJ, & Smyth JM (2022). Transdermal sensor features correlate with ecological momentary assessment drinking reports and predict alcohol-related consequences in young adults’ natural settings. Alcoholism: Clinical and Experimental Research, 46(1), 100–113. [DOI] [PMC free article] [PubMed] [Google Scholar]
- Sakai JT, Mikulich-Gilbertson SK, Long RJ, & Crowley TJ (2006). Validity of transdermal alcohol monitoring: Fixed and self-regulated dosing. Alcoholism: Clinical and Experimental Research, 30(1), 26–33. [DOI] [PubMed] [Google Scholar]
- Saldich EB, Wang C, Rosen IG, Bartroff J, & Luczak SE (2021). Effects of stomach content on the breath alcohol concentration-transdermal alcohol concentration relationship. Drug and Alcohol Review, 40(7), 1131–1142. [DOI] [PMC free article] [PubMed] [Google Scholar]
- Sirlanci M, Luczak SE, Fairbairn CE, Kang D, Pan R, Yu X, & Rosen IG (2019). Estimating the distribution of random parameters in a diffusion equation forward model for a transdermal alcohol biosensor. Automatica, 106, 101–109. 10.1016/j.automatica.2019.04.026 [DOI] [PMC free article] [PubMed] [Google Scholar]
- Sirlanci M, Rosen IG, Luczak SE, Fairbairn CE, Bresin K, & Kang D (2018). Deconvolving the input to random abstract parabolic systems: A population model-based approach to estimating blood/breath alcohol concentration from transdermal alcohol biosensor data. Inverse Problems, 34(12), 125006. [DOI] [PMC free article] [PubMed] [Google Scholar]
- Swift RM (2003). Direct measurement of alcohol and its metabolites. Addiction, 98(s2), 73–80. [DOI] [PubMed] [Google Scholar]
- Swift RM, & Swette L (1992). Assessment of ethanol consumption with a wearable, electronic ethanol sensor/recorder. In Litten RZ & Allen JP (Eds.), Measuring alcohol consumption: Psychosocial and biochemical methods. (pp. 189–202). Humana Press. [Google Scholar]
- Trafford E. (2016). MetricWire (Version 2.2.10) [Mobile application software]. [Google Scholar]
- Wang Y, Fridberg DJ, Leeman RF, Cook RL, & Porges EC (2019). Wrist-worn alcohol biosensors: Strengths, limitations, and future directions. Alcohol: A Biomedical Journal, 81, 83–92. [DOI] [PMC free article] [PubMed] [Google Scholar]
- Wang Y, Fridberg DJ, Shortell DD, Leeman RF, Barnett NP, Cook RL, & Porges EC (2021). Wrist-worn alcohol biosensors: Applications and usability in behavioral research. Alcohol: A Biomedical Journal, 92, 25–34. [DOI] [PMC free article] [PubMed] [Google Scholar]
- White AM (2003). What happened? Alcohol, memory blackouts, and the brain. Alcohol Research and Health, 27(2), 186–196. [PMC free article] [PubMed] [Google Scholar]