

Abstract
Understanding why sports and energy drinks remain increasingly popular among adolescents despite declines in other sugar sweetened beverages is critical. This study points to memory for advertising exposure and adolescent athletic identity as two aspects that together help to explain consumption. An online survey of U.S. adolescents aged 14–18 (n = 503) was combined with Nielsen data for television and social media advertising expenditures by sports and energy drink brands in participants’ designated market areas (DMAs). Advertisement recall mediates the relationship between social media DMA expenditures and sports and energy drink consumption. Recall for television advertisements is related to consumption but is unrelated to television DMA expenditures. Athletic identity moderated the relationship between recall and consumption such that consumption increased as both recall and athletic identity increased, suggesting a role for motivated memory and motivated processing of ad messages based on athletic identity consistent with the limited capacity model of motivated media message processing. Based on these results, we conclude that effectiveness of expenditures in influencing behavior is dependent upon both ad recall and ad relevance, and that athletic identity is an important factor in ad effectiveness in the context of sports and energy drinks advertising.
Sugar-sweetened beverages (SSBs, defined as non-diet sodas, sports drinks, energy drinks, fruit drinks, and flavored milk products) play a significant role in obesity and Type 2 diabetes (Malik et al., 2010). They also cause of dental erosion and dental caries (Marshall, 2013). Overall SSB consumption has decreased since the early 2000s (Vercammen et al., 2020). However, sports and energy drinks as a specific category of SSB have not seen such decreases. The majority of adolescents report drinking sports drinks at least once per week − 56% in 2010 to 57.6% in 2015 (Cordrey et al., 2018). In addition, adolescent energy drink consumption has increased in the same time period, with energy drinks comprising a major source of caffeine for those who drink them (Vercammen et al., 2019). A sports drink is a noncarbonated, flavored beverage with added sugars, minerals, and electrolytes (e.g., Gatorade, Powerade, Vitamin Water). An energy drink often includes caffeine as well (e.g., Monster, Red Bull, 5-hour Energy).
Adolescents view hundreds of advertisements for sugary beverages in a year of prime time television viewing, averaging out to at least one exposure per day (Elsey & Harris, 2016), and these advertisements have a demonstrated influence on consumption (Arcan et al., 2013). Both sports and energy drinks advertisements are heavily targeted to adolescents (Harris et al., 2020). An analysis of energy drink advertisements found that the majority of channels that were vehicles for such ads had a primary target audience of youth ages 12–17 years (Emond et al., 2015). TV advertisements for sports, energy drinks, and sugar-sweetened iced tea accounted for nearly half of the ads for sugary drinks viewed by adolescents in 2018 (Harris et al., 2020). In addition, although beverage companies spend the most money on television ads, social media advertising is gaining popularity (Potvin Kent et al., 2019).
Crucially, food and beverage companies are specifically targeting Black and Hispanic youth, furthering existing health disparities (Harris et al., 2019), and adolescents’ unique psychological and neurobiological stages make it difficult for them to resist advertising based heavily on rewarding outcomes (Harris et al., 2021). Additionally, adolescents’ exposure to digital marketing efforts on social media is extensive (Potvin Kent et al., 2019), and they are actively engaged with sugary drinks and other food and beverage brands (Harris et al., 2021).
Perceptions that sports drinks provide health benefits like hydration, athletic performance, and athletic recovery are reinforced by sports drink advertisements (Shirreffs, 2009). Athletic activity is also featured in energy drink advertising, but while sports drink ads tend to showcase mainstream sports such as football and basketball, energy drink ads tend to include extreme sports such as BMX, car racing, and snowboarding (Bleakley et al., 2022). Professional athletes are commonly used as celebrity endorsements for both sports and energy drinks, further cementing the relationship between athletics and these beverages (Bleakley et al., 2022; Bragg et al., 2018; Harris & Munsell, 2015). Data suggests these marketing strategies are largely successful; for example, among a sample of collegiate athletes, 52% agreed that “Sports drinks are better than water because they restore glycogen in muscles” (Nichols et al., 2005). Among adolescents, drinking sports drinks is associated with higher levels of physical activity and participation in organized sports (Larson et al., 2014), suggesting a close tie between consumption of these beverages and athletic behaviors. However, despite these persistent beliefs, there is little evidence that sports or energy drinks are any better than water for hydration and recovery from physical activity, especially among youth and amateur athletes (Heneghan et al., 2012). And in fact, the added sugars from such drinks contribute to young athletes often consuming more calories than are expended during sports activities (Bennion et al., 2020).
Advertising for sports and energy drinks may therefore be part of the process by which adolescents create and maintain beliefs and preferences for consumption, including the relevance of these products for their personal identities. The present study will explore this possibility using a combination of advertising expenditure data, adolescent recall of advertising exposure, and adolescent self-reported consumption of sports and energy drinks. We will also explore the personal identity differences of athletic identity. The present study also incorporates a measure of actual advertising expenditure in participants’ Designated Market Areas (DMAs) together with self-reported exposure to gain a fuller picture of the role of advertising saturation in adolescents’ environments. It is necessary to investigate whether adolescents’ recall for advertising exposure is associated with the amount of advertising messages where they live (DMAs) and whether recall is independent of actual environmental advertising patterns. Much of the research on the influence of advertising on health behavior is based in self-reported media use and ad exposure, which can have problems with accuracy due to faulty memory and desirability effects. Previous research has found small but significant relationships between advertising expenditures and recall (van den Putte, 2009), as well as between expenditures and other advertising outcomes such as children’s brand affinity (Kim et al., 2016). There is also evidence that in the digital context expenditures are related to brand outcomes such as purchase intention even under conditions of low ad attention (Santoso et al., 2020). We therefore aim to investigate:
RQ1: Will advertising expenditure in participants’ DMAs be associated with their recall for advertising messages for a) energy drinks and/or b) sports drinks?
If advertising expenditure is associated with ad recall, advertising recall should mediate the relationship between DMA advertising expenditure and product consumption because research suggests that recall is more important than exposure or attitudes in predicting the effect of advertising on behavior (Higie & Sewall, 1991).
H1: Recall for exposure to advertising messages for a) energy drinks and b) sports drinks will mediate the relationship between advertising expenditure in participants’ DMAs and product consumption.
The role of motivated message processing
The limited capacity model of motivated media message processing (LC4MP) posits that cognitive resources are limited and resources must be allocated at all stages of message encoding, storage in memory, and retrieval (Lang, 2009). An individual may not have enough resources to process the message fully, or they might have the resources but choose not to allocate them. Therefore, for message processing to occur through all three stages the individual must have both the ability (resources available) and the motivation to allocate the resources required to the message (Lang, 2009). The LC4MP has been applied and tested many times in advertising contexts across video games, online advertising, and television advertising. Some have focused on message encoding, such as studies that look at the ways online ads can orient attention using techniques such as animation and other attention-grabbing sensory cues (Simmonds et al., 2020; Sundar & Kalyanaraman, 2004). Others, which are more relevant to the present work, focused on advertisement recall under varying conditions in online and gaming environments (Lee & Faber, 2007; Siemens et al., 2015).
As previously mentioned, motivation is a crucial component of thorough message processing according to the LC4MP (Lang, 2009). Motivation can come from a variety of sources. For example, fear of invalidity or responsibility for the content will usually motivate people to allocate resources to a message (Kruglanski, 1990). Another study on television advertising found that program involvement, or a “motivated state” (p. 26) defined as how actively interested people are in what they are watching, was associated with increased attention and recall of advertising messages (Moorman et al., 2012). In addition to these kinds of motivation, personal relevance of the message topic can also influence motivation to allocate resources (Petty et al., 1981). For example, a study on online advertising found that personalization was associated with increased attention paid to the ad, including when the person was under cognitive load (Bang & Wojdynski, 2016). One way that messages can be personally relevant and therefore increase likelihood of processing under the LC4MP is by pertaining to a group or role identity (Read, 2020). In the present study, we propose that athletic identity will be associated with message processing. Athletic identity is defined for the purposes of the present study as how important athletics are to a person’s self-concept.
The proposed importance of athletic identity is due to the fact that advertising messages for both sports and energy drinks commonly associate the products with sports participation, athletic performance, and hydration (Bragg et al., 2018; Folta et al., 2006; Jenkin et al., 2014; Shirreffs, 2009). If athletic identity does moderate the relationship between ad exposure and product consumption, it would indicate that adolescents are both likely to allocate resources to messages relevant to athletic identity and also are accepting of advertisement claims that these products are helpful for athletes, particularly among those who are athletes themselves. Athletic imagery and messaging in advertisements for sports and energy drinks would therefore act as cues for attention and recall based in the LC4MP among those who identity as athletes. Therefore:
H2: Athletic identity will be associated with memory for advertisements for a) energy drinks and b) sports drinks, such that as athletic identity increases so will memory.
H3: Athletic identity will moderate the relationship between advertisement recall and product consumption for a) energy drinks and b) sports drinks, such that advertising recall will be more strongly associated with increased product consumption the more strongly participants report identifying as an athlete.
Method
Participants
Participants were 503 adolescents aged 14 to 18 years recruited through survey company SSRS, from a combination of the probability-based SSRS Opinion Panel (n = 100) and a non-probability volunteer panel (n = 403) in October 2020 (https://ssrs.com/about/). Of those, 250 (49.70%) identified as male, 247 (49.11%) as female, four (0.80%) as “prefer to self-describe,” and two (0.40%) “prefer not to say;” 359 (71.37%) identified as non-Hispanic White, 39 (7.75%) as non-Hispanic Black, 57 (11.33%) as Hispanic/Latino, and 48 (9.54%) as another race or ethnicity. Mother’s education was included as a proxy for socioeconomic status; 69 (13.72%) reported less than a high school diploma, 72 (14.31%) reported high school or GED, 117 (23.26%) reported some college or associates/trade degree, 152 (30.02%) reported a four-year degree, and 94 (18.69%) reported an advanced degree (MA, JD, MD, PhD, etc.).
Procedure
Parents were invited to an online survey where they were asked to confirm that they had a child between the ages of 14–18 years. If they had more than one eligible child, the program randomly selected one child to participate and then asked if the parent consented to their child’s participation. Parents provided demographic information for themselves. If the child was available at the time of this screening process, the program asked for the child to come to the computer or other device and automatically routed to the survey for the adolescent to complete. If the child was not available, the program asked for an e-mail address to send a link for the child to complete the survey later. These procedures were approved by the sponsoring institution’s Institutional Review Board. Adolescent participants then provided demographic information about themselves, as well as information about their consumption of various sugar-sweetened beverages including the target beverages for this analysis of sports drinks and energy drinks. They answered questions about their beliefs regarding sports and energy drinks (these items reported elsewhere: Hennessy et al., 2021; Pfender et al., 2022), as well as their media use and advertising exposure.
Measures
DMA-based advertising exposure
Participants indicated their residence zip code in the survey. Zip codes were matched with Designated Market Area (DMA) as compiled by the Nielsen Company. There are 210 DMAs in the United States according Nielsen, which tend to include a major metropolitan area and the surrounding counties; 131 DMAs were represented in the survey. Participant DMAs were then matched with Nielsen reports for advertising expenditure in the past year by sports and energy drink brands in units (number of spots) on television and in dollars in digital advertising (sports drink TV units M = 338.72, SD = 224.58; sports drink digital dollars M=$14,096.10, SD=$23,809.31; energy drink TV units M = 1,869.60, SD = 1,598.05; energy drink digital dollars M=$1,030.35, SD=$1,598.05).
Recall for advertising exposure
Participants were asked (on a scale from 1=never, 2=a little, 3=some, 4=a lot) how often they recall seeing advertisements for sports drinks when they watch television (M = 2.47, SD = 0.86) and when they are on social media (M = 2.25, SD = 0.94). They were asked the same about energy drinks advertisements when they watch television (M = 2.29, SD = 0.91) and when they are on social media (M = 2.23, SD = 0.91). The measure was based on a similar measure that was originally developed for alcohol advertising (Unger et al., 2003).
Frequency of consumption
Participants reported for 10 beverages (e.g., juice, coffee with sugar, milk), with the focal responses being for sports drinks and energy drinks, “how often, if at all, do you drink each of these” on the following scale: 1=never during the past 7 days, 2=one to three times during the past 7 days, 3=four to six times during the past 7 days, 4=one time per day or more (sports drinks M = 2.10, SD = 0.98; energy drinks M = 1.59, SD = 0.88). This measure was based on the BEVQ-15 for habitual beverage intake (Hedrick et al., 2012).
Athletic identity
Participants were asked how much they agreed or disagreed with the statement, “I consider myself an athlete,” on a scale of 1=strongly disagree to 7=strongly agree (M = 4.17, SD = 2.11).
Statistical analysis
Analyses were conducted using sem and gsem in Stata 14.0. See Figure 1 for a conceptual model. Robust standard errors were clustered by DMA to account for non-independence of observations within each DMA. Models were run separately for energy and sports drinks due to multicollinearity when they are combined. Each model included the focal predictors of television and digital advertising expenditures in participants’ DMAs, recall for television and digital advertising as mediators, and drink consumption frequency as the outcome. Athletic identity was included at first as a covariate, and then as a moderator of the relationships between ad recall and drink consumption. The interactions between athletic identity and ad recall were included separately for television and digital ad recall due to multicollinearity when both interactions are present (VIF = 8.46). Demographics of age, sex, racial and ethnic identity, and mother’s education level were included as covariates due to their associations with consumption behavior (Azagba et al., 2014; Cordrey et al., 2018).
Figure 1.
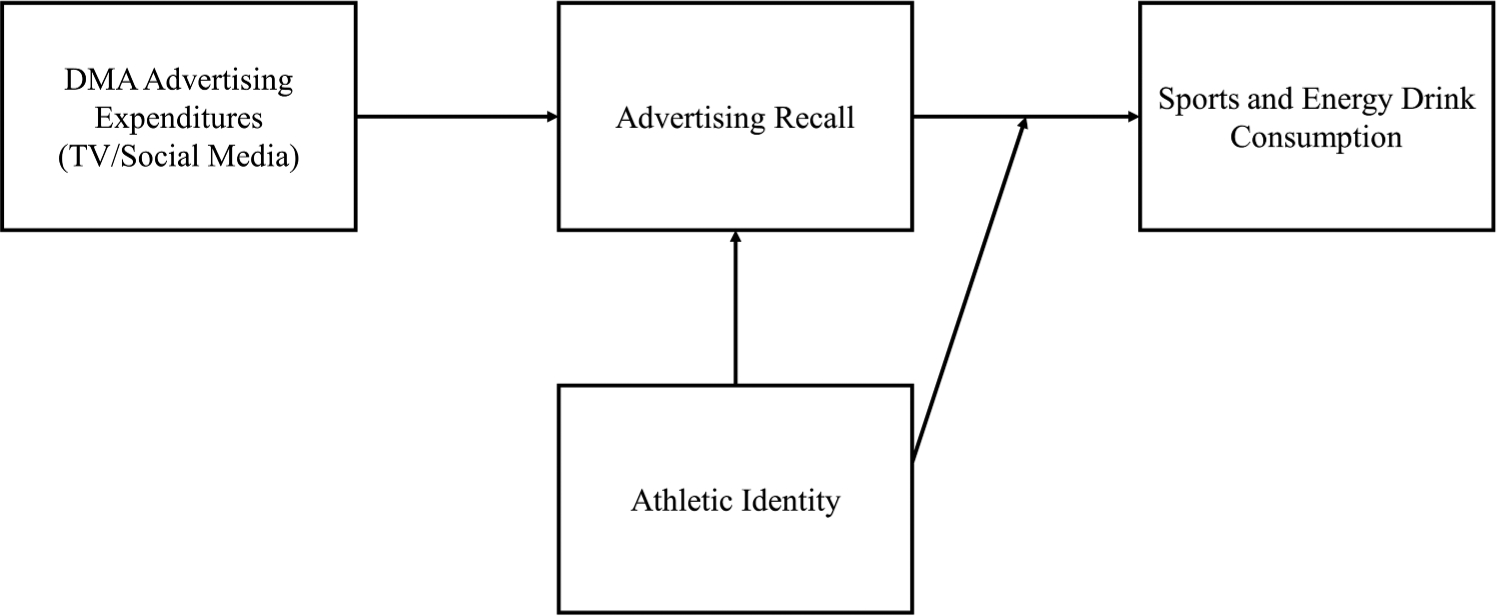
Conceptual model.
Results
Full statistical results can be found in Tables 1 and 2. Expenditure (TV and digital), recall (TV and digital), and athletic identity were standardized using z-scores (0 as the mean) to allow for meaningful interpretation of simple main effects in the presence of the interaction.
Table 1.
Path results from gsem for energy drinks. Bolded coefficients are significant at p < .05.
| TV Ad Recall | Digital Ad Recall | ED Consumption | ||||
|---|---|---|---|---|---|---|
| b | 95% CI | b | 95% CI | b | 95% CI | |
| Model 1: Mediation | ||||||
| DMA TV expenditure | 0.05 | −0.03, 0.13 | 0.02 | −0.06, 0.10 | −0.04 | −0.10, 0.02 |
| DMA digital expenditure | 0.05 | −0.01, 0.12 | 0.06 | 0.02, 0.10 | −0.00 | −0.05, 0.04 |
| Athletic identity | 0.28 | 0.20, 0.36 | 0.23 | 0.15, 0.31 | 0.08 | 0.01, 0.14 |
| TV ad recall | – | – | – | – | 0.19 | 0.10, 0.29 |
| Digital ad recall | – | – | – | – | 0.18 | 0.10, 0.27 |
| Sex | 0.20 | 0.01, 0.39 | 0.13 | −0.02, 0.29 | 0.04 | −0.10, 0.18 |
| Age | −0.06 | −0.12, −0.00 | −0.05 | −0.11, 0.01 | −0.01 | −0.06, 0.04 |
| Mother’s education | −0.03 | −0.08, 0.02 | −0.02 | −0.07, 0.03 | −0.04 | −0.09, 0.01 |
| Racial/ethnic identity (White=comparison) | ||||||
| Black | 0.32 | −0.02, 0.66 | 0.26 | −0.12, 0.63 | −0.05 | −0.35, 0.26 |
| Hispanic | 0.04 | −0.18, 0.26 | 0.14 | −0.12, 0.41 | 0.00 | −0.22, 0.23 |
| Other | −0.17 | −0.36, 0.02 | −0.13 | −0.37, 0.11 | −0.26 | −0.45, −0.06 |
| Model 2: Moderated Mediation for TV | ||||||
| DMA TV expenditure | – | – | – | – | −0.03 | −0.09, 0.03 |
| DMA digital expenditure | – | – | – | – | −0.01 | −0.06, 0.04 |
| Athletic identity | – | – | – | – | 0.10 | 0.03, 0.17 |
| TV ad recall | – | – | – | – | 0.18 | 0.07, 0.28 |
| Digital ad recall | – | – | – | – | 0.17 | 0.08, 0.26 |
| TV ad recall*Athletic | – | – | – | – | 0.14 | 0.05, 0.23 |
| Sex | – | – | – | – | 0.05 | −0.09, 0.18 |
| Age | – | – | – | – | −0.01 | −0.06, 0.04 |
| Mother’s education | – | – | – | – | −0.04 | −0.09, 0.01 |
| Racial/ethnic identity (White=comparison) | ||||||
| Black | – | – | – | – | −0.03 | −0.33, 0.28 |
| Hispanic | – | – | – | – | −0.00 | −0.21, 0.21 |
| Other | – | – | – | – | −0.28 | −0.47, −0.08 |
| Model 3: Moderated Mediation for digital | ||||||
| DMA TV expenditure | – | – | – | – | −0.04 | −0.09, 0.02 |
| DMA digital expenditure | – | – | – | – | −0.01 | −0.06, 0.03 |
| Athletic identity | – | – | – | – | 0.10 | 0.03, 0.17 |
| TV ad recall | – | – | – | – | 0.19 | 0.08, 0.29 |
| Digital ad recall | – | – | – | – | 0.16 | 0.07, 0.25 |
| Digital ad recall*Athletic | – | – | – | – | 0.13 | 0.03, 0.22 |
| Sex | – | – | – | – | 0.06 | −0.08, 0.20 |
| Age | – | – | – | – | −0.01 | −0.06, 0.04 |
| Mother’s education | – | – | – | – | −0.04 | −0.09, 0.01 |
| Racial/ethnic identity (White=comparison) | ||||||
| Black | – | – | – | – | −0.05 | −0.37, 0.26 |
| Hispanic | – | – | – | – | −0.01 | −0.22, 0.21 |
| Other | – | – | – | – | −0.28 | −0.47, 0.09 |
Results predicting recall are the same in all models so are only reported under model 1.
Table 2.
Path results from gsem for sports drinks. Bolded coefficients are significant at p < .05.
| TV Ad Recall | Digital Ad Recall | SD Consumption | ||||
|---|---|---|---|---|---|---|
| b | 95% CI | b | 95% CI | b | 95% CI | |
| Model 1: Mediation | ||||||
| DMA TV expenditure | −0.00 | −0.12, 0.12 | −0.10 | −0.28, 0.07 | 0.05 | −0.04, 0.14 |
| DMA digital expenditure | 0.02 | −0.08, 0.12 | 0.13 | −0.08, 0.34 | −0.11 | −0.18, −0.03 |
| Athletic identity | 0.28 | 0.20, 0.36 | 0.06 | 0.03, 0.09 | 0.28 | 0.19, 0.38 |
| TV ad recall | – | – | – | – | 0.08 | −0.01, 0.18 |
| Digital ad recall | – | – | – | – | −0.00 | −0.03, 0.02 |
| Sex | 0.11 | −0.06, 0.27 | 0.11 | −0.01, 0.24 | 0.19 | 0.01, 0.37 |
| Age | −0.09 | −0.15, −0.02 | −0.04 | −0.11, 0.02 | 0.01 | −0.07, 0.08 |
| Mother’s education | −0.03 | −0.08, 0.02 | −0.06 | −0.19, 0.06 | −0.04 | −0.10, 0.02 |
| Racial/ethnic identity (White=comparison) | ||||||
| Black | 0.44 | 0.12, 0.76 | 0.09 | 0.02, 0.17 | −0.05 | −0.41, 0.31 |
| Hispanic | 0.06 | −0.16, 0.29 | 0.43 | −0.22, 1.0S | 0.06 | −0.22, 0.34 |
| Other | −0.20 | −0.41, 0.01 | −0.09 | −0.22, 0.04 | −0.25 | −0.50, −0.00 |
| Model 2: Moderated Mediation for TV | ||||||
| DMA TV expenditure | – | – | – | – | 0.06 | −0.03, 0.14 |
| DMA digital expenditure | – | – | – | – | −0.12 | −0.20, −0.04 |
| Athletic identity | – | – | – | – | 0.30 | 0.21, 0.39 |
| TV ad recall | – | – | – | – | 0.07 | −0.02, 0.16 |
| Digital ad recall | – | – | – | – | −0.00 | −0.02, 0.02 |
| TV ad recall*Athletic | – | – | – | – | 0.10 | 0.00, 0.20 |
| Sex | – | – | – | – | 0.20 | 0.02, 0.38 |
| Age | – | – | – | – | 0.01 | −0.07, 0.08 |
| Mother’s education | – | – | – | – | −0.04 | −0.10, 0.02 |
| Racial/ethnic identity (White=comparison) | ||||||
| Black | – | – | – | – | −0.05 | −0.41, 0.31 |
| Hispanic | – | – | – | – | 0.04 | −0.24, 0.32 |
| Other | – | – | – | – | −0.27 | −0.52, −0.02 |
| Model 3: Moderated Mediation for digital | ||||||
| DMA TV expenditure | – | – | – | – | 0.05 | −0.04, 0.14 |
| DMA digital expenditure | – | – | – | – | −0.11 | −0.19, −0.03 |
| Athletic identity | – | – | – | – | 0.29 | 0.20, 0.39 |
| TV ad recall | – | – | – | – | 0.09 | −0.01, 0.18 |
| Digital ad recall | – | – | – | – | −0.04 | −0.23, 0.14 |
| Digital ad recall*Athletic | – | – | – | – | 0.10 | −0.35, 0.56 |
| Sex | – | – | – | – | 0.19 | 0.01, 0.37 |
| Age | – | – | – | – | 0.01 | −0.06, 0.08 |
| Mother’s education | – | – | – | – | −0.04 | −0.09, 0.03 |
| Racial/ethnic identity (White=comparison) | ||||||
| Black | – | – | – | – | −0.05 | −0.39, 0.30 |
| Hispanic | – | – | – | – | 0.06 | −0.25, 0.31 |
| Other | – | – | – | – | −0.25 | −0.53, −0.03 |
Results predicting recall are the same in all models so are only reported under model 1.
Energy drinks
Mediation only
Digital ad expenditure for energy drinks, but not television ad expenditure, was significantly and positively associated with increased ad recall – specifically for social media ads. Recall for both social media and television ads for energy drinks were significantly and positively associated with energy drink consumption. Athletic identity was a significant predictor of both television and digital ad recall and of consumption.
Moderated mediation
There is a significant interaction between recall for television ads and athletic identity on energy drink consumption, such that the more recall participants report and the more they consider themselves an athlete, the more energy drinks they consume (Figure 2). Specifically, when athletic identity is one standard deviation below the mean there is no significant relationship between recall for TV ads and energy drink consumption, b = 0.02, 95% CI (−0.12, 0.16). However, there is a significant and positive relationship between recall for TV ads and energy drink consumption when athletic identity is at the mean, b = 0.17, 95% CI (0.07, 0.27) and when athletic identity is one standard deviation above the mean, b = 0.31, 95% CI (0.19, 0.44). There was also a significant interaction between recall for social media ads and athletic identity on energy drink consumption, such that the more recall participants report and the more they consider themselves an athlete, the more energy drinks they consume (Figure 3). Specifically, when athletic identity is one standard deviation below the mean there is no significant relationship between recall for social media ads and energy drink consumption, b = 0.02, 95% CI (−0.12, 0.16). However, there is a significant and positive relationship between recall for social media ads and energy drink consumption when athletic identity is at the mean, b = 0.16, 95% CI (0.07, 0.25) and when athletic identity is one standard deviation above the mean, b = 0.29, 95% CI (0.17, 0.41). Therefore, athletic identity is key in the relationship between advertising and energy drink consumption, where athletic identity is associated with more recall of advertising, and a stronger association between ad recall and consumption.
Figure 2.
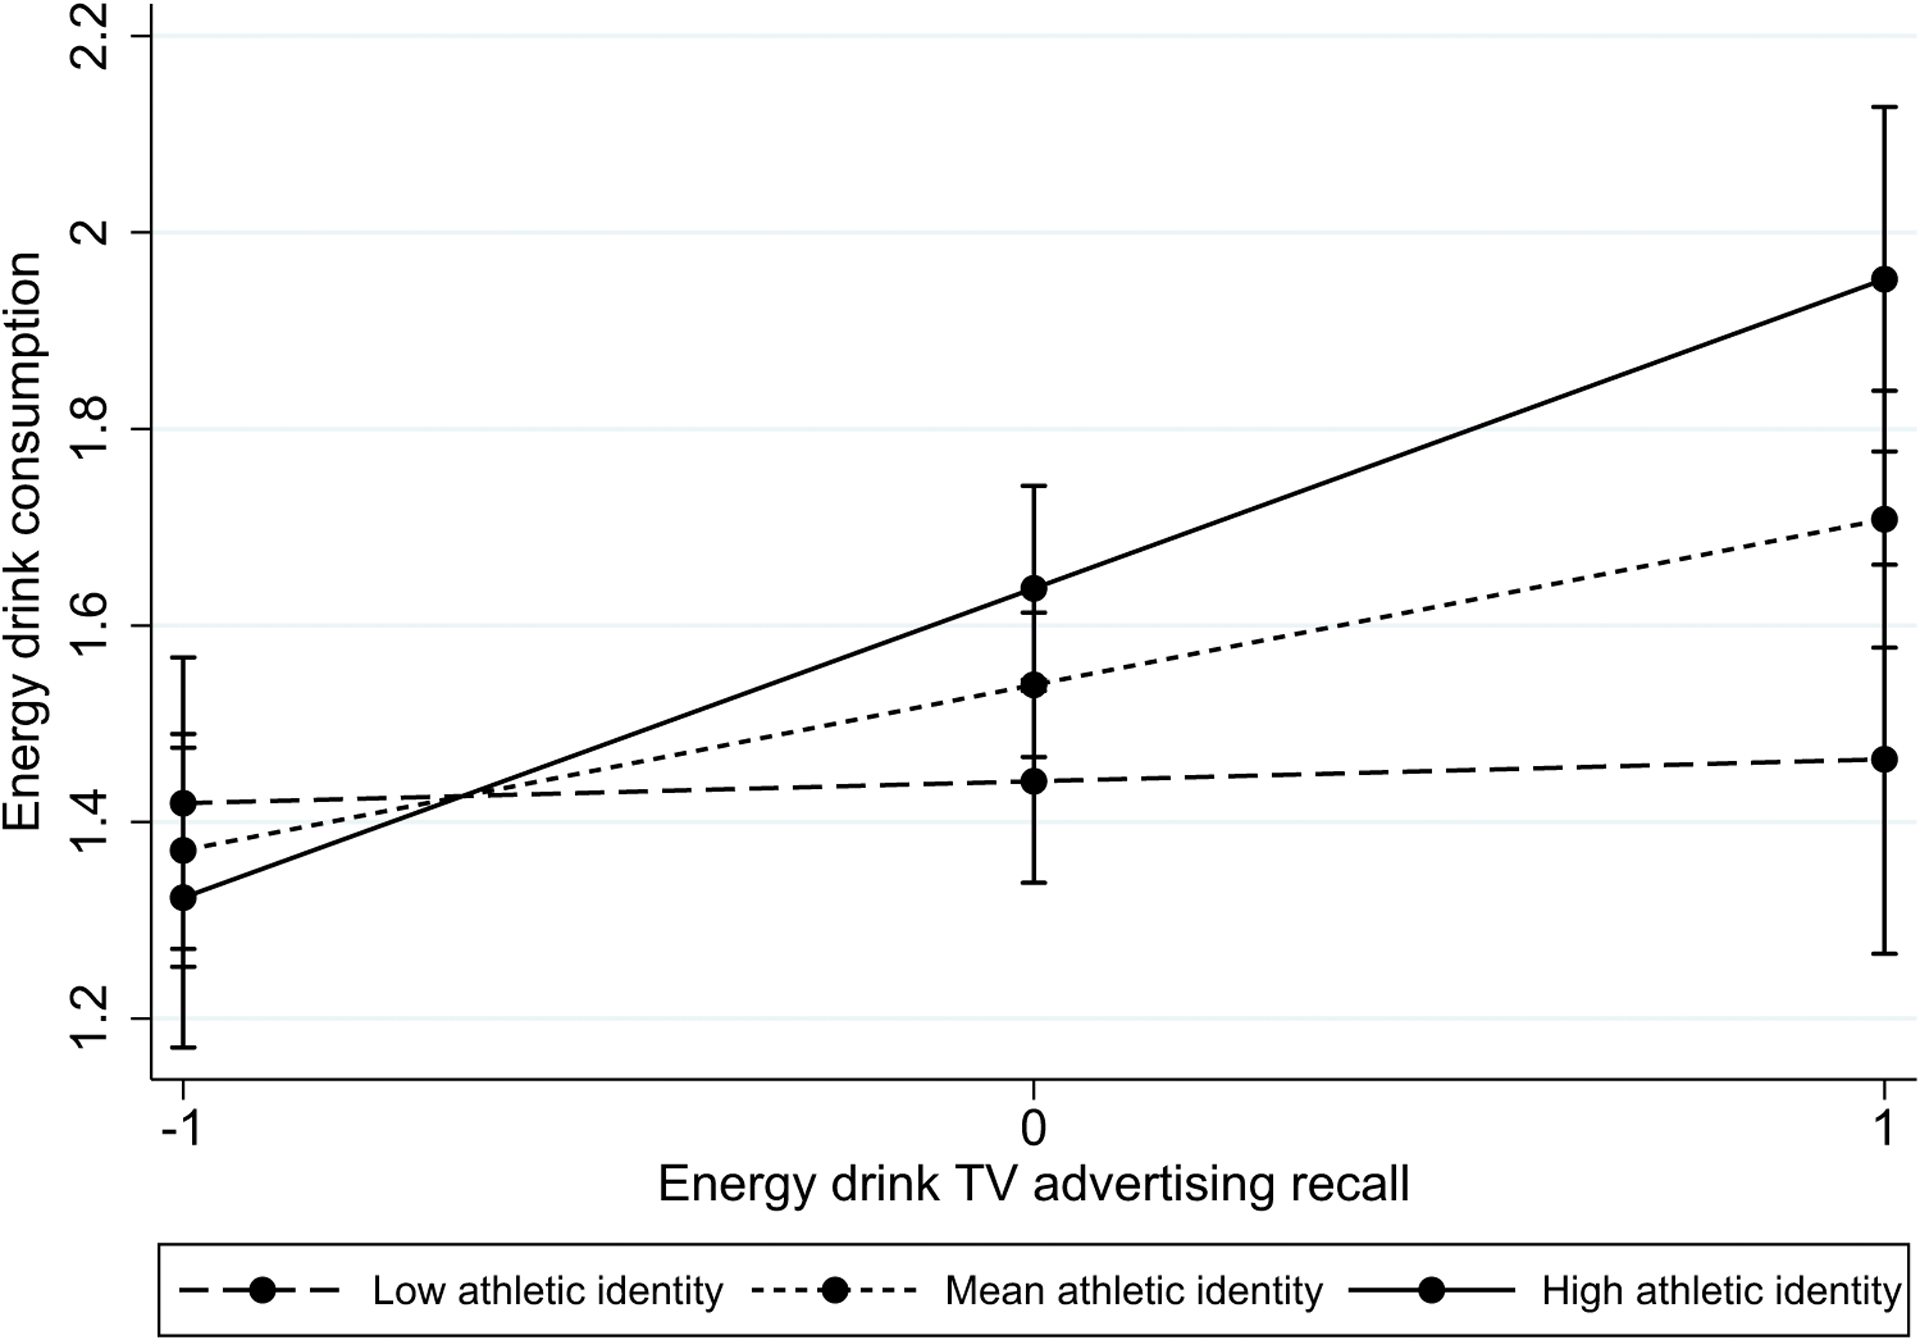
Graph of the interaction between recall for television energy drink advertising and athletic identity on energy drink consumption.
Figure 3.
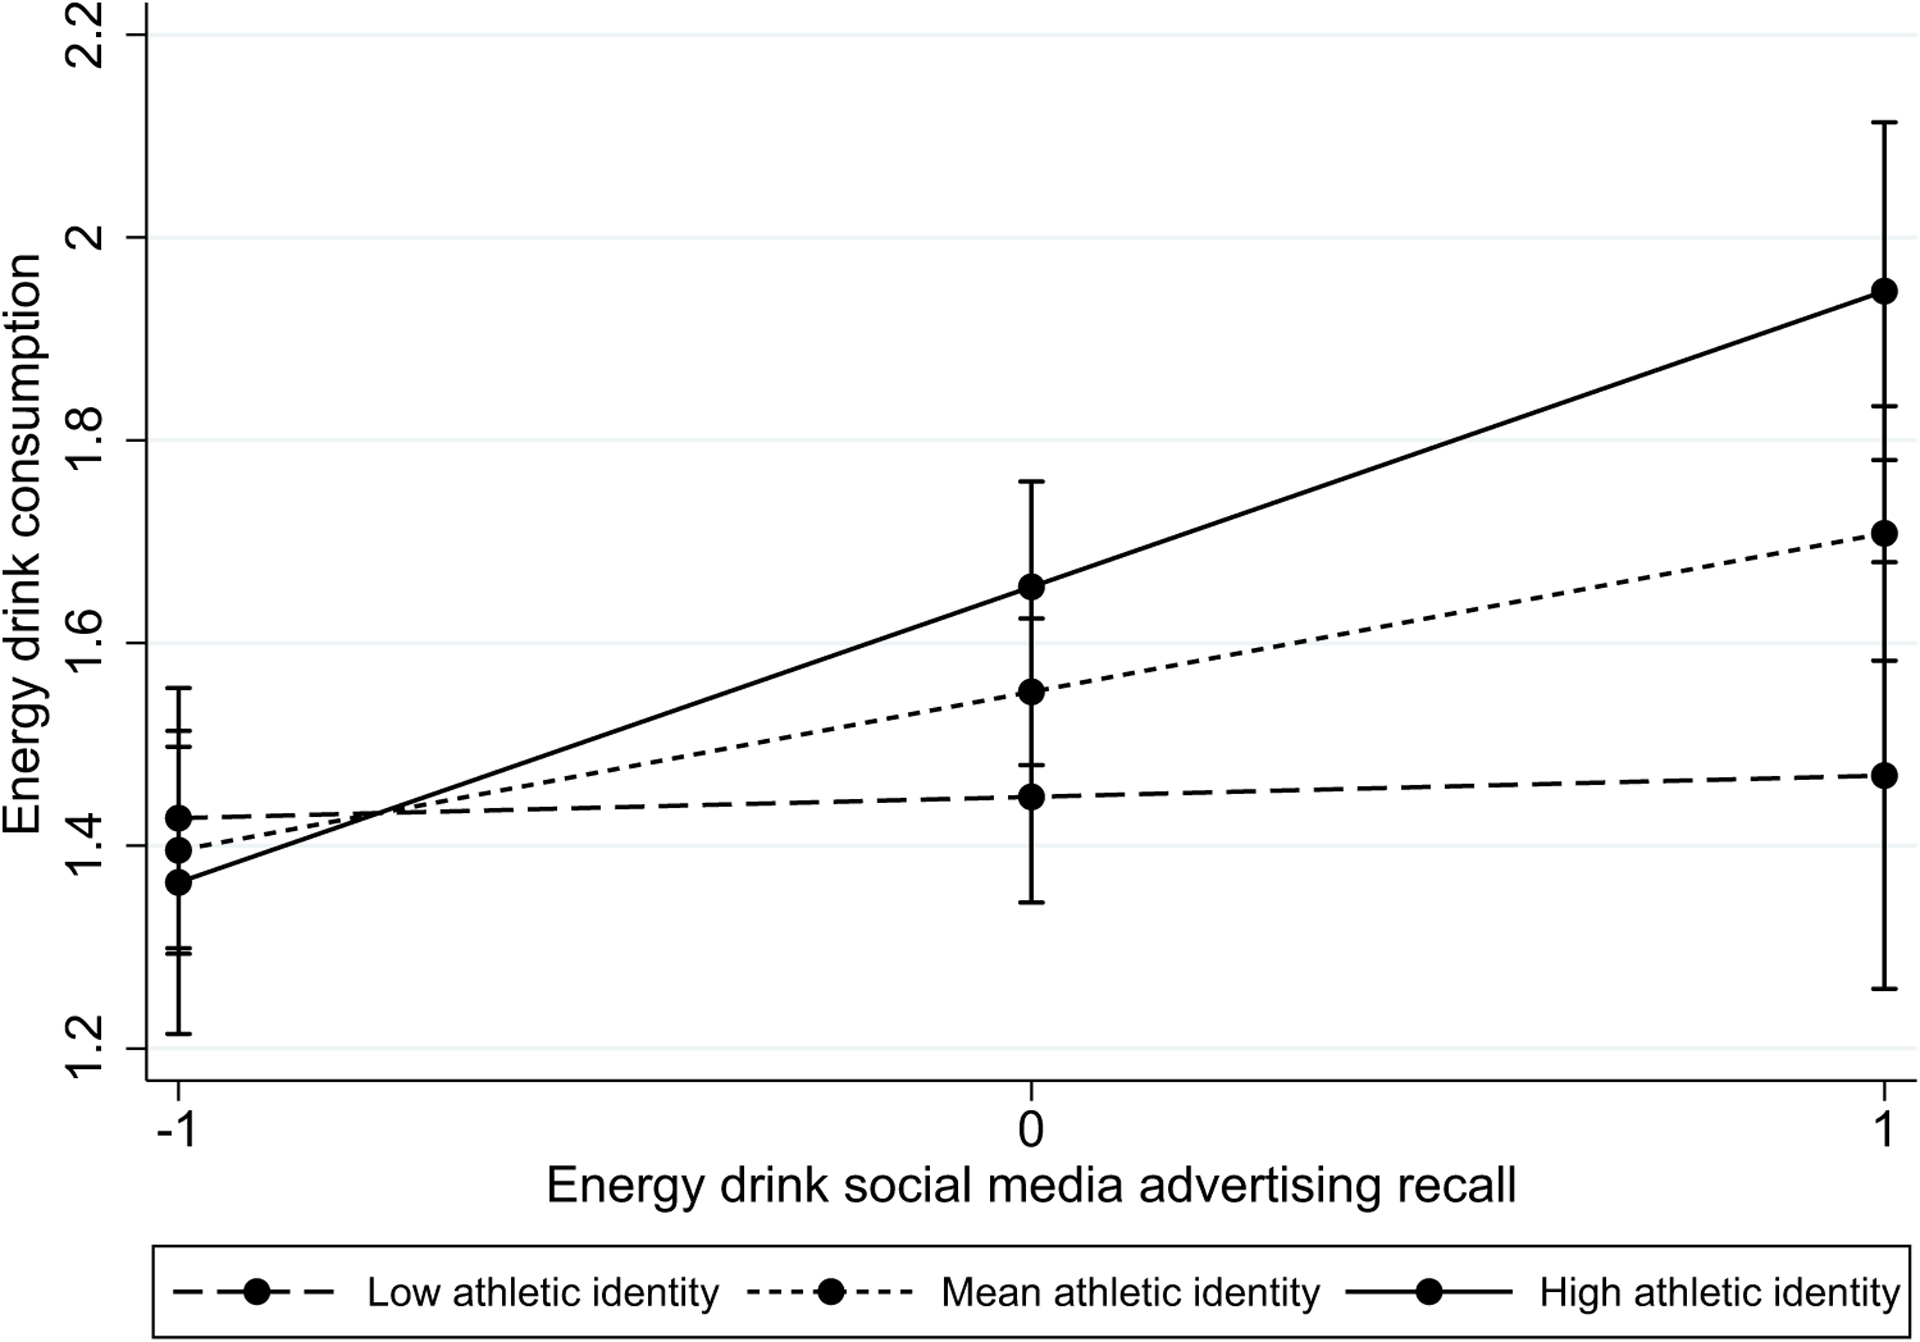
Graph of the interaction between recall for social media energy drink advertising and athletic identity on energy drink consumption.
Sports drinks
Mediation only
Advertising expenditure for sports drinks was not significantly associated with ad recall for either television or digital contexts. There also was no relationship between ad recall and sports drink consumption for television or social media ads. There was, however, a negative direct relationship between digital ad expenditures and sports drink consumption, such that the more money spent on digital ads in the participant’s DMA, the less sports drink they reported consuming. Athletic identity was a significant predictor of both television and social media ad recall and of consumption.
Moderated mediation
Similar to the interactions of recall and athletic identity for energy drink consumption, there is also a significant interaction between recall for television ads and athletic identity on sports drink consumption, such that the more recall participants report and the more they consider themselves an athlete, the more sports drinks they consume (Figure 4). Specifically, when athletic identity is one standard deviation below the mean there is no significant relationship between recall for TV ads and sports drink consumption, b=−0.03, 95% CI (−0.16, 0.10), nor is there one when athletic identity is at the mean, b = 0.08, 95% CI (−0.01, 0.16). However, there is a significant and positive relationship between recall for TV ads and sports drink consumption when athletic identity is one standard deviation above the mean, b = 0.18, 95% CI (0.05, 0.32). There was not, however, a significant interaction between recall for social media ads and athletic identity on sports drink consumption. Therefore, athletic identity is also important in the relationship between advertising and sports drink consumption in that it is associated with more recall of TV advertising and enhances the influence of TV ad recall on consumption.
Figure 4.
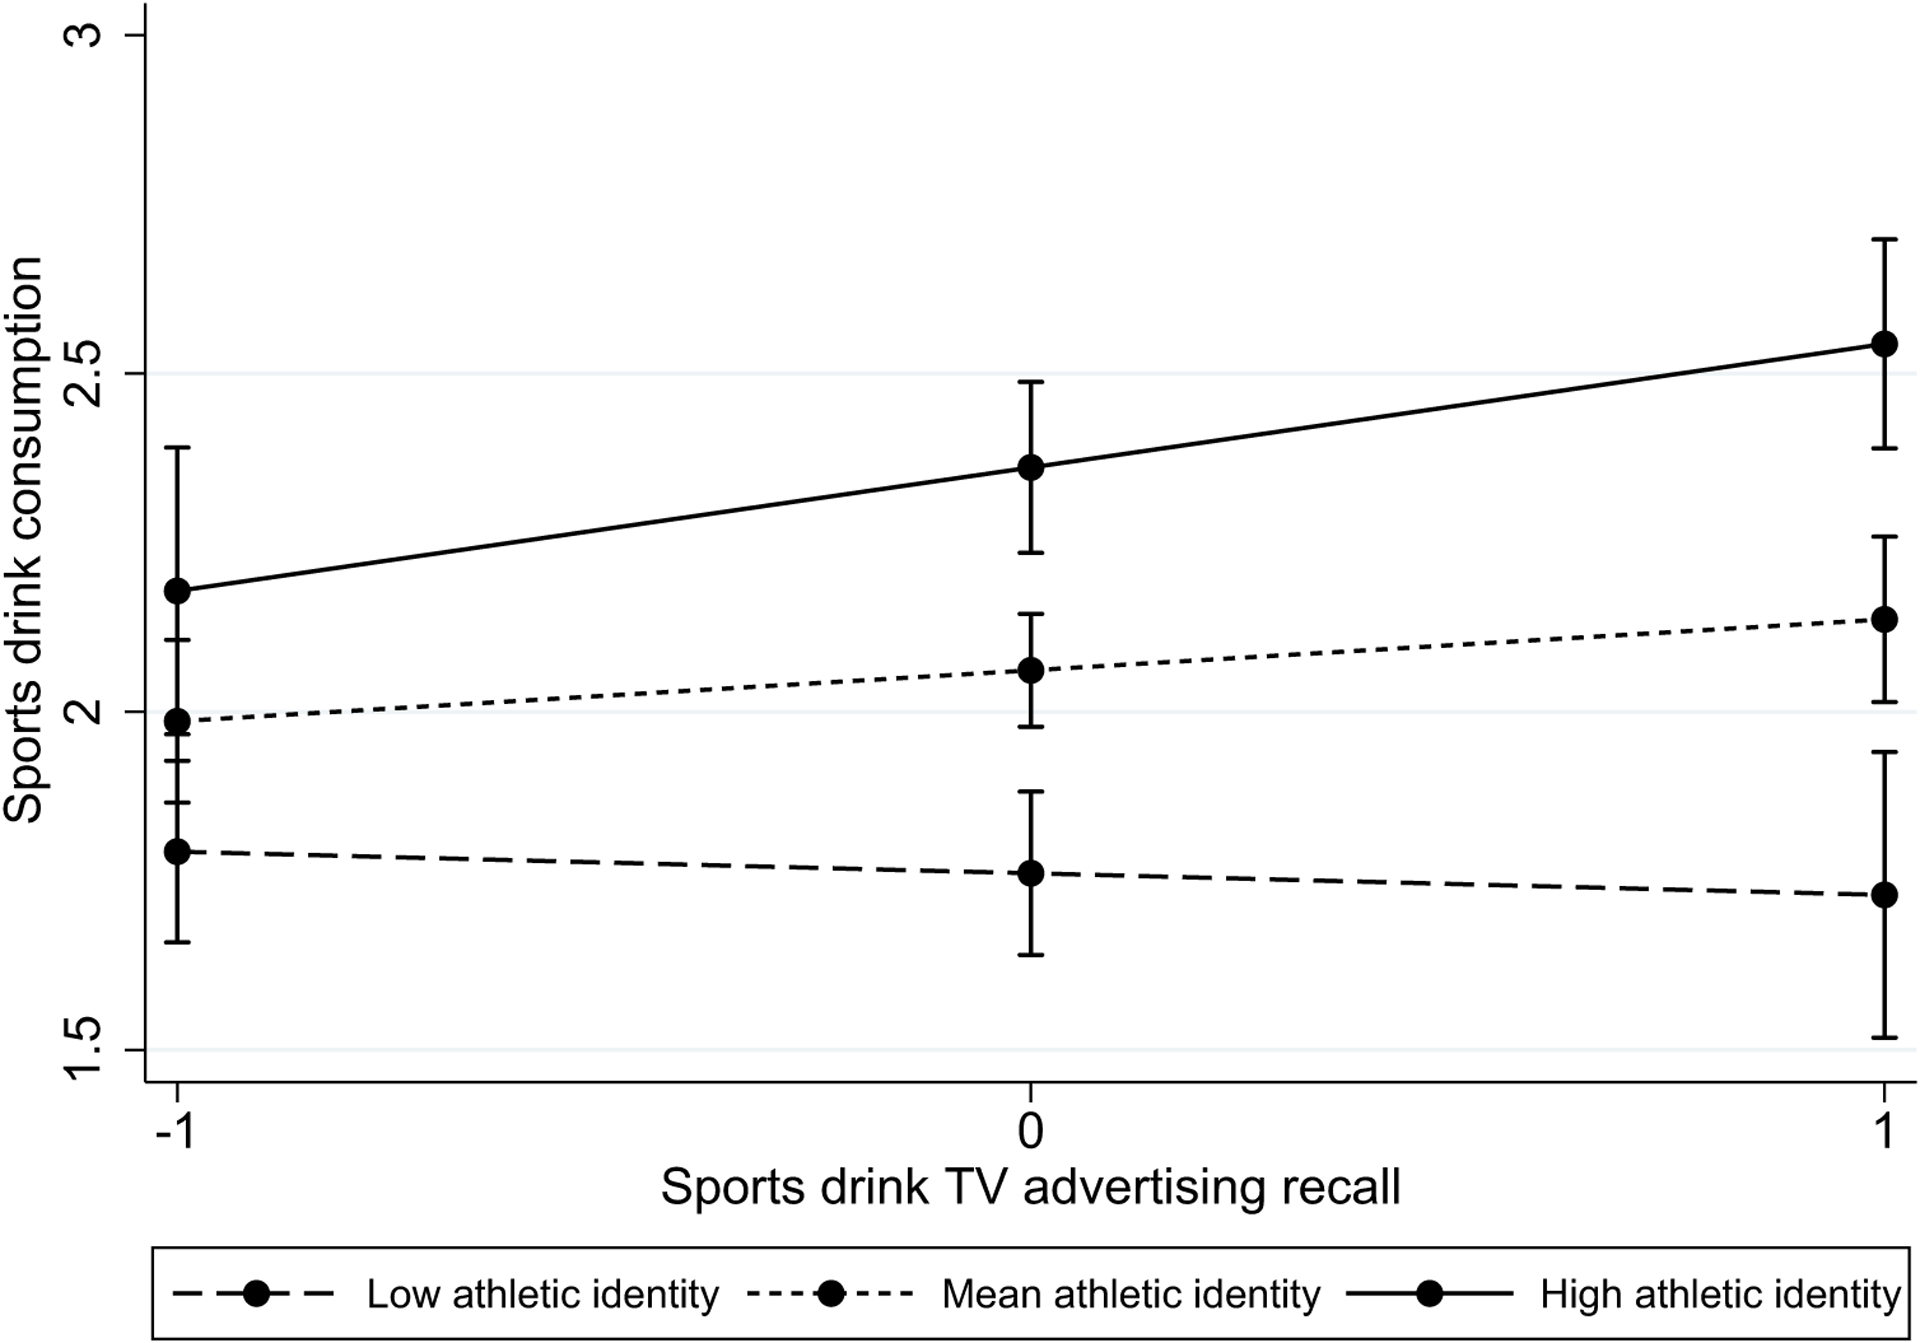
Graph of the interaction between recall for television sports drink advertising and athletic identity on sports drink consumption.
Discussion
Results of the present study found that social media advertising expenditure for energy drinks in participants’ DMAs was significantly associated with self-reported recall of advertising exposure. Moreover, athletic identity was significantly related to advertising recall for television and digital ads and for both energy and sports drinks. This is consistent with the LC4MP’s motivated processing and motivated memory perspective (Lang, 2009). Athletics being such a common theme in advertisements for both sports and energy drinks likely means increased personal involvement and therefore increased recall of the messages for those who strongly identify as athletes. Future research should elaborate this process.
Recall of advertising exposure then was associated with consumption for both energy and sports drinks, and this was also moderated by athletic identity: greater advertisement exposure recall was associated with greater product consumption, especially when athletic identity was high. Thus, athletic identity is associated with increased ad recall and increased likelihood that ad recall will be associated with product consumption.
The use of expenditures as a measure of ad saturation offered the opportunity to move beyond self- reports of recall in examining how advertising may be related to consumption. In this analysis, only expenditures for social media ads of energy drinks was related to recall of ad exposure. It is notable that TV ad expenditures for sports drinks were unrelated to either recall or consumption and recall was also not related to consumption. These findings suggests that the ads and their messages about athletes may just reinforce beliefs about sports drinks that are already firmly held for most adolescents. Viewing patterns for adolescents may also reinforce this, as adolescents increasingly are watching time-shifted television with fewer advertisements, but increasing their time spent on social media and online videos such as YouTube (Rideout & Robb, 2019). But athletes for whom the ads may be personally relevant, recall is important regardless of advertising expenditures, suggesting selective attention to key ads may be more important than ad saturation.
Theoretical and practical implications
Theoretically, the results are in line with the LC4MP in terms of its predictions regarding motivated processing and recall. As other LC4MP-based research on the role of motivation in advertising attention and recall has found (Bang & Wojdynski, 2016; Chung & Sparks, 2016; Moorman et al., 2012), motivation in the form of identity relevance was associated in the present study with both increased recall and increased consumption of sports and energy drinks. Therefore, these results support this aspect of the LC4MP and suggest that personal identity should be considered in other LC4MP research as a possible source of motivation.
There are also practical implications for public health messaging and for medical caregivers. Public health messaging regarding sugary beverages has generally focused on soda, and evidence suggests this has been effective (Vercammen et al., 2020). However, such decreases are not seen in sports and energy drinks, which have actually increased in the same timeframe. Therefore, successful soda messaging should be repurposed and refocused to target sports and energy drinks specifically and should consider the relationship between sports and athletic identity and advertising effectiveness. In addition, medical caregivers such as pediatricians often already discuss sugary beverages with adolescents and their parents, and some also discuss media use and media messaging. These discussions should be expanded or reframed to include the intersection of sports and energy drink consumption and advertising messages for these products, especially for youth who are also athletes.
Limitations and future research
The present study was a combined convenience sample (n = 403) and probability sample (n = 100). The survey company SSRS provided weights to make the convenience sample more akin to the probability sample; however, the analyses could not be run with weights without interfering with the relationships according to DMA. Therefore, the sample was not fully representative of adolescents in the United States, and conclusions may not be generalizable. In addition, while there are over 200 DMAs in the United States, each DMA encompasses as relatively large region. This means that advertising expenditures were not precise at the micro-level (e.g., the respondents’ neighborhood). Neighborhood factors such as food insecurity and convenience store accessibility are important in determining dietary patterns and health (Walker et al., 2010), and future research should consider including these more specific data in order to better account for structural factors that influence consumption. In addition, there may not always be perfect accuracy between DMA expenditure and actual location in internet advertising for digital ads; there may have been some incorrect information due to things like VPNs, or someone on the edge of a DMA connecting to a data network from an adjacent DMA. However, we do not expect any systematic effect with this and so treat these possibilities as random error. Additionally, causal ordering between recall and consumption is not clear given that the data were collected at one point in time. It is likely there is a non-recursive relationship, in that advertising drives consumption, and consumption prompts more attention to relevant advertisements.
Conclusion
In the context of sports and energy drinks, advertising expenditures were only sometimes associated with advertising recall. Athletic identity was a more consistent indicator of recall, suggesting that personal relevance is potentially more important than overall amount of ad messages. Advertising recall was associated with increased consumption of both energy and sports drinks, and this relationship was strengthened the more strongly participants identified as athletes. Therefore, there is a clear link between athleticism and advertising for these beverages and may be one contributing factor for why sports and energy drink consumption has increased while consumption of other SSBs, such as sodas, have declined. It is especially concerning that energy drinks have become related to athletics and have increased in consumption among youth over time (Vercammen et al., 2019), as they are particularly unhealthy in adolescent diets (Harris & Munsell, 2015). Consumption of SSBs such as sports and energy drinks is associated with negative health outcomes such as obesity and dental erosion, making reduction of their consumption crucial for adolescent health (Malik et al., 2010; Marshall, 2013). However, until something disrupts the relationships between advertising for these products and their link to athletics, their consumption is only likely to continue to rise – especially among youth athletes.
Funding
This study was funded by the National Institute of Dental and Craniofacial Research (NIDCR) [Grant Number 1R21DE028414-01]. Its contents are solely the responsibility of the authors and do not necessarily represent the official views of the NIDCR
Footnotes
Disclosure statement
No potential conflict of interest was reported by the author(s).
References
- Arcan C, Bruening M, & Story M (2013). Television (TV) and TV advertisement influences on children’s eating behaviour. In Faith M (Ed.), Encyclopedia on early childhood development (pp. 33–39). CEECD. https://www.child-encyclopedia.com/ [Google Scholar]
- Azagba S, Langille D, & Asbridge M (2014). An emerging adolescent health risk: Caffeinated energy drink consumption patterns among high school students. Preventive Medicine, 62, 54–59. 10.1016/j.ypmed.2014.01.019 [DOI] [PubMed] [Google Scholar]
- Bang H, & Wojdynski BW (2016). Tracking users’ visual attention and responses to personalized advertising based on task cognitive demand. Computers in Human Behavior, 55, 867–876. 10.1016/j.chb.2015.10.025 [DOI] [Google Scholar]
- Bennion N, Spruance LA, & Maddock JE (2020). Do youth consume more calories than they expended in youth sports leagues? An observational study of physical activity, snacks, and beverages. American Journal of Health Behavior, 44(2), 180–187. 10.5993/AJHB.44.2.6 [DOI] [PubMed] [Google Scholar]
- Bleakley A, Ellithorpe ME, Jordan AB, Hennessy M, & Stevens R (2022). A content analysis of sports and energy drink advertising. Appetite, 174, 106010. 10.1016/j.appet.2022.106010 [DOI] [PMC free article] [PubMed] [Google Scholar]
- Bragg MA, Roberto CA, Harris JL, Brownell KD, & Elbel B (2018). Marketing food and beverages to youth through sports. Journal of Adolescent Health, 62(1), 5–13. 10.1016/j.jadohealth.2017.06.016 [DOI] [PMC free article] [PubMed] [Google Scholar]
- Chung S, & Sparks JV (2016). Motivated processing of peripheral advertising information in video games. Communication Research, 43 (4), 518–541. 10.1177/0093650214566623 [DOI] [Google Scholar]
- Cordrey K, Keim SA, Milanaik R, & Adesman A (2018). Adolescent consumption of sports drinks. Pediatrics, 141(6), e20172784. 10.1542/peds.2017-2784 [DOI] [PubMed] [Google Scholar]
- Elsey JW, & Harris JL (2016). Trends in food and beverage television brand appearances viewed by children and adolescents from 2009 to 2014 in the USA. Public Health Nutrition, 19(11), 1928–1933. 10.1017/S1368980015003274 [DOI] [PMC free article] [PubMed] [Google Scholar]
- Emond JA, Sargent JD, & Gilbert Diamond D (2015). Patterns of energy drink advertising over US television networks. Journal of Nutrition Education and Behavior, 47(2), 120–126. 10.1016/j.jneb.2014.11.005 [DOI] [PMC free article] [PubMed] [Google Scholar]
- Folta SC, Goldberg JP, Economos C, Bell R, & Meltzer R (2006). Food advertising targeted at school-age children: A content analysis. Journal of Nutrition Education and Behavior, 38(4), 244–248. 10.1016/j.jneb.2006.04.146 [DOI] [PubMed] [Google Scholar]
- Harris J, Fleming-Milici F, Kibwana-Jaff A, & Phaneuf L (2020). Sugary drink advertising to youth: Continued barrier to public health progress. UConn Rudd Center for Food Policy & Obesity. https://www.sugarydrinkfacts.org/resources/Sugary%20Drink%20FACTS%202020/Sugary_Drink_FACTS_Full%20Report_final.pdf [Google Scholar]
- Harris J, Frazier W, Kumanyika S, & Ramirez A (2019). Increasing disparities in unhealthy food advertising targeted to Hispanic and Black youth. UConn Rudd Center for Food Policy & Obesity. http://uconnruddcenter.org/files/Pdfs/TargetedMarketingReport2019.pdf [Google Scholar]
- Harris J, & Munsell CR (2015). Energy drinks and adolescents: What’s the harm? Nutrition Reviews, 73(4), 247–257. 10.1093/nutrit/nuu061 [DOI] [PubMed] [Google Scholar]
- Harris J, Yokum S, & Fleming-Milici F (2021). Hooked on junk: Emerging evidence on how food marketing affects adolescents’ diets and long-term health. Current Addiction Reports, 8(1), 19–27. 10.1007/s40429-020-00346-4 [DOI] [Google Scholar]
- Hedrick VE, Savla J, Comber DL, Flack KD, Estabrooks PA, Nsiah-Kumi PA, Ortmeier S, & Davy BM (2012). Development of a brief questionnaire to assess habitual beverage intake (BEVQ-15): Sugar-sweetened beverages and total beverage energy intake. Journal of the Academy of Nutrition and Dietetics, 112(6), 840–849. 10.1016/j.jand.2012.01.023 [DOI] [PMC free article] [PubMed] [Google Scholar]
- Heneghan C, Perera R, Nunan D, Mahtani K, & Gill P (2012). Forty years of sports performance research and little insight gained. BMJ, 345, e4797. 10.1136/bmj.e4797 [DOI] [PubMed] [Google Scholar]
- Hennessy M, Bleakley A, Ellithorpe ME, Maloney E, Jordan AB, & Stevens R (2021). Reducing unhealthy normative behavior: The case of sports and energy drinks. Health Education & Behavior. online first. 10.1177/10901981211055468 [DOI] [PMC free article] [PubMed] [Google Scholar]
- Higie RA, & Sewall MA (1991). Using recall and brand preference to evaluate advertising effectiveness. Journal of Advertising Research, 31 (2), 56–63. [Google Scholar]
- Jenkin G, Madhvani N, Signal L, & Bowers S (2014). A systematic review of persuasive marketing techniques to promote food to children on television. Obesity Reviews, 15(4), 281–293. 10.1111/obr.12141 [DOI] [PubMed] [Google Scholar]
- Kim KK, Williams JD, & Wilcox GB (2016). ‘Kid tested, mother approved’: The relationship between advertising expenditures and ‘most-loved’brands. International Journal of Advertising, 35(1), 42–60. 10.1080/02650487.2015.1079947 [DOI] [Google Scholar]
- Kruglanski AW (1990). Lay epistemic theory in social-cognitive psychology. Psychological Inquiry, 1(3), 181–197. 10.1207/s15327965pli0103_1 [DOI] [Google Scholar]
- Lang A (2009). The limited capacity model of motivated mediated message processing. In Nabi RL & Oliver MB (Eds.), The SAGE handbook of media processes and effects (pp. 193–204). SAGE. [Google Scholar]
- Larson N, DeWolfe J, Story M, & Neumark-Sztainer D (2014). Adolescent consumption of sports and energy drinks: Linkages to higher physical activity, unhealthy beverage patterns, cigarette smoking, and screen media use. Journal of Nutrition Education and Behavior, 46(3), 181–187. 10.1016/j.jneb.2014.02.008 [DOI] [PMC free article] [PubMed] [Google Scholar]
- Lee M, & Faber RJ (2007). Effects of product placement in on-line games on brand memory: A perspective of the limited-capacity model of attention. Journal of Advertising, 36(4), 75–90. 10.2753/JOA0091-3367360406 [DOI] [Google Scholar]
- Malik VS, Popkin BM, Bray GA, Després J-P, & Hu FB (2010). Sugar-sweetened beverages, obesity, type 2 diabetes mellitus, and cardiovascular disease risk. Circulation, 121(11), 1356–1364. 10.1161/CIRCULATIONAHA.109.876185 [DOI] [PMC free article] [PubMed] [Google Scholar]
- Marshall T (2013). Preventing dental caries associated with sugar-sweetened beverages. The Journal of the American Dental Association, 144(10), 1148–1152. 10.14219/jada.archive.2013.0033 [DOI] [PubMed] [Google Scholar]
- Moorman M, Willemsen LM, Neijens PC, & Smit EG (2012). Program-involvement effects on commercial attention and recall of successive and embedded advertising. Journal of Advertising, 41(2), 25–38. 10.2753/JOA0091-3367410202 [DOI] [Google Scholar]
- Nichols PE, Jonnalagadda SS, Rosenbloom CA, & Trinkaus M (2005). Knowledge, attitudes, and behaviors regarding hydration and fluid replacement of collegiate athletes. International Journal of Sport Nutrition and Exercise Metabolism, 15(5), 515–527. 10.1123/ijsnem.15.5.515 [DOI] [PubMed] [Google Scholar]
- Petty RE, Cacioppo JT, & Goldman R (1981). Personal involvement as a determinant of argument-based persuasion. Journal of Personality and Social Psychology, 41(5), 847. 10.1037/0022-3514.41.5.847 [DOI] [Google Scholar]
- Pfender E, Bleakley A, Ellithorpe M, Hennessey M, Maloney E, Jordan A, & Stevens R (2022). Perceptions of sports and energy drinks: Factors associated with adolescent beliefs. American Journal of Health Promotion. online first. 10.1177/08901171221113521 [DOI] [PMC free article] [PubMed] [Google Scholar]
- Potvin Kent M, Pauzé E, Roy EA, de Billy N, & Czoli C (2019). Children and adolescents’ exposure to food and beverage marketing in social media apps. Pediatric Obesity, 14(6), e12508. 10.1111/ijpo.12508 [DOI] [PMC free article] [PubMed] [Google Scholar]
- Read GL (2020). Processing ambiguous social identity: Disclosure of identity and phenotypic prototypicality affect processing and evaluation of persuasive messages. The Journal of Communication, 70(5), 693–720. 10.1093/joc/jqaa024 [DOI] [Google Scholar]
- Rideout V, & Robb MB (2019). The common sense census: Media use by tweens and teens [Report]. Common Sense Media. [Google Scholar]
- Santoso I, Wright M, Trinh G, & Avis M (2020). Is digital advertising effective under conditions of low attention? Journal of Marketing Management, 36(17–18), 1707–1730. 10.1080/0267257X.2020.1801801 [DOI] [Google Scholar]
- Shirreffs S (2009). Hydration in sport and exercise: Water, sports drinks and other drinks. Nutrition Bulletin, 34(4), 374–379. 10.1111/j.1467-3010.2009.01790.x [DOI] [Google Scholar]
- Siemens JC, Smith S, & Fisher D (2015). Investigating the effects of active control on brand recall within in-game advertising. Journal of Interactive Advertising, 15(1), 43–53. 10.1080/15252019.2015.1021432 [DOI] [Google Scholar]
- Simmonds L, Bogomolova S, Kennedy R, Nenycz-Thiel M, & Bellman S (2020). A dual-process model of how incorporating audio-visual sensory cues in video advertising promotes active attention. Psychology & Marketing, 37(8), 1057–1067. 10.1002/mar.21357 [DOI] [Google Scholar]
- Sundar SS, & Kalyanaraman S (2004). Arousal, memory, and impression-formation effects of animation speed in web advertising. Journal of Advertising, 33(1), 7–17. 10.1080/00913367.2004.10639152 [DOI] [Google Scholar]
- Unger JB, Schuster D, Zogg J, Dent CW, & Stacy AW (2003). Alcohol advertising exposure and adolescent alcohol use: A comparison of exposure measures. Addiction Research & Theory, 11(3), 177–193. 10.1080/1606635031000123292 [DOI] [Google Scholar]
- van den Putte B (2009). What matters most in advertising campaigns? The relative effect of media expenditure and message content strategy. International Journal of Advertising, 28(4), 669–690. 10.2501/S0265048709200813 [DOI] [Google Scholar]
- Vercammen KA, Koma JW, & Bleich SN (2019). Trends in energy drink consumption among US adolescents and adults, 2003–2016. American Journal of Preventive Medicine, 56(6), 827–833. 10.1016/j.amepre.2018.12.007 [DOI] [PubMed] [Google Scholar]
- Vercammen KA, Moran AJ, Soto MJ, Kennedy-Shaffer L, & Bleich SN (2020). Decreasing trends in heavy sugar-sweetened beverage consumption in the United States, 2003 to 2016. Journal of the Academy of Nutrition and Dietetics, 120(12), 1974–1985. e1975. 10.1016/j.jand.2020.07.012 [DOI] [PubMed] [Google Scholar]
- Walker RE, Keane CR, & Burke JG (2010). Disparities and access to healthy food in the United States: A review of food deserts literature. Health & Place, 16(5), 876–884. 10.1016/j.healthplace.2010.04.013 [DOI] [PubMed] [Google Scholar]