

Abstract
Coronavirus Disease 2019 (COVID-19) spreads around the world, seriously affecting people’s health. Computed tomography (CT) images contain rich semantic information as an auxiliary diagnosis method. However, the automatic segmentation of COVID-19 lesions in CT images faces several challenges, including inconsistency in size and shape of the lesion, the high variability of the lesion, and the low contrast of pixel values between the lesion and normal tissue surrounding the lesion. Therefore, this paper proposes a Fully Feature Fusion Based Neural Network for COVID-19 Lesion Segmentation in CT Images (F3-Net). F3-Net uses an encoder–decoder architecture. In F3-Net, the Multiple Scale Module (MSM) can sense features of different scales, and Dense Path Module (DPM) is used to eliminate the semantic gap between features. The Attention Fusion Module (AFM) is the attention module, which can better fuse the multiple features. Furthermore, we proposed an improved loss function that pays more attention to the lesions based on the prior knowledge of the distribution of COVID-19 lesions in the lungs. Finally, we verified the superior performance of F3-Net on a COVID-19 segmentation dataset, experiments demonstrate that the proposed model can segment COVID-19 lesions more accurately in CT images than benchmarks of state of the art.
Keywords: CT images, COVID-19, Deep network, Image segmentation, Multi-scale
1. Introduction
COVID-19 spreads fast and is highly contagious, so the early detection and diagnosis of COVID-19 can help prevent the disease. Currently, COVID-19 detection mainly uses real-time reverse transcriptase-polymerase chain reaction technology (RT-PCR) [1]. Although this technology has become the “gold standard” for diagnosing COVID-19, the strict test environment limits its test speed. More importantly, due to the high mutation rate and latency of COVID-19, resulting in high false negatives in the detection of this technology [2], [3]. And yet, in another respect, RT-PCR has always been used in screening stage and confirmed diagnosis, which does not work in the clinical treatment, especially for diagnosis of disease severity and subtype. In today’s clinical field, radiology imaging technology has become an important complementary role to RT-PCR [4]. Computed tomography (CT) images contain rich image semantics, which contains essential features such as the texture, shape, and graphics of the lesion [5]. Understanding the evolution of COVID-19 in CT images can be an essential basis of the early prevention, control, diagnosis, and treatment of COVID-19. Nowadays, most of the work marking the lesions in CT images is manually performed by doctors or professionals. Repetitive work has brought a massive workload to the staff [6]. In addition, manual operation is easily affected by the annotator’s clinical experience and subjective consciousness, so it is difficult to ensure the accuracy of the annotation. Therefore, there is an urgent need to use artificial intelligence technology to automatically segment the COVID-19 lesion area from the CT image, which is conducive to further judgment and evaluation of the subtypes of lesion, and can relieve the pressure of doctors on medical image recognition [7].
In recent years, convolutional neural network (CNN) has proved its good performance in image processing. Therefore, it is feasible to realize automatic segmentation of COVID-19 lesions in CT based on the CNN model. Moreover, there has been much work recently applying CNN to radioactive images for the diagnosis of COVID-19 [7]. For example, Wang et al. [8] established a public dataset based on X-ray images of COVID-19 and designed the first COVID-19 detection network COVID–Net. Wang et al. [9] firstly uses the pre-trained U-Net to segment the lung segment from the CT image and then input the lung segment into the weakly-supervised network for COVID-19 infection prediction.
Although many CNN networks have been proposed to solve the diagnosis problem of COVID-19, only a few of them focus on the segmentation of the COVID-19 lesion area in CT images. Because COVID-19 lesions have some difficulties that are not conducive to segmentation on CT images among different stages in the different patients:
-
1.
The scales of lesions are not uniform. The area of the lesion is quite different. For example, the smaller lesion area is less than , and the largest lesion area is close to half of the lung lobe.
-
2.
The morphology of lesions is variable. For example, the shape of a ground-glass lesion is close to a sponge, while the shape of a cord-like lesion is like a cord.
-
3.
The contrast of CT images is unclear. The mutation period of the lesion is short, and the speed is fast. In the CT image, the pixel value of the lesion area and the organ area of the human body is almost equal, the position is similar, and the contrast is low.
Those problems have undoubtedly brought great difficulties to the segmentation task of COVID-19, but the existing solutions rarely focus on such problems. For example, weakly-supervised frameworks are used to train the model to solve the problem of fewer samples in the data set [9], [10]. Although some modules such as multi-scale and attention mechanism are added to the CNN model [11], [12], they may have overlooked the above issues. So, these questions for the segmentation of COVID-19 lesions are still a challenging task.
To solve the above problems, we firstly construct a dataset of CT images in this paper. The dataset contains 4472 CT images of COVID-19 patients. Each CT image has its corresponding saliency label of the lesion area. A new deep learning model F3-Net is designed to accurately segment the COVID-19 lesion area from the patients’ CT images. In addition, we also designed a loss function that pays more attention to the lesion area according to the distribution characteristics of the lesion pixels. We divide the constructed dataset into the training set, validation set, and test set, then put the training set to F3-Net, set the loss function to for training, and use the validation set to adjust the original network. Finally, the trained F3-Net is tested on the test set. The experimental results show that F3-Net has achieved good results on our dataset. In general, the contribution of this article lies in three aspects:
-
1.
We designed a new COVID-19 lesion segmentation network F3-Net. F3-Net adopts the encoder–decoder architecture. In the encoder stage, a Multiple Scale Module (MSM) is used to extract different scales’ features. Because decoder features need to introduce encoder features to compensate for the loss of information, we designed a Dense Path Module (DPM) to reduce the semantic gap. To further realize the fusion of the two, we also designed an Attention Fusion Module (AFM). The AFM can dynamically adjust the weight of each channel of the feature and enhance the distinguishability. It is worth mentioning that both MSM and AFM can be added to the existing network architecture as independent units.
-
2.
Based on the distribution characteristics of COVID-19 lesions in patients’ CT images, this work designed a new loss function. defines a weight function according to the distribution of the lesion pixels in the training set. By , the points in the non-lesion area can be given a coefficient value greater than . The label value of the points in the non-lesion area is . During the training process, points in the non-lesion area can obtain a larger loss value to pay more attention to the lesion area and achieve more accurate segmentation.
-
3.
Through experimental research on a dataset constructed from CT images of 358 COVID-19 patients, the results show that the loss function proposed in this paper can increase the model’s attention to the lesion area, and F3-Net can segment COVID-19 lesions more accurately in CT images than the benchmarks of state of the art. F3-Net can reduce the burden on clinicians to comment on the infected area of the lesion and increase the possibility of further research on the mechanism of the COVID-19 lesion.
The remaining paper is organized as follows. In Section 2, we briefly summarize the related works. We introduce the implementation details of F3-Net. Extensive experiments are conducted in Section 4 to evaluate the performance of F3-Net on COVID-19 datasets, with in-depth analysis. Section 5 concludes this work.
2. Related work
This section introduces some classic semantic segmentation methods, then reviews current COVID-19 lesion segmentation methods using the CNN models.
2.1. Semantic segmentation
The main task of semantic segmentation is the prediction of each pixel in the image and identifying the pixel area of different objects. It is an important part of the image processing field [13]. With the rise of the DCNN, many semantic segmentation models have been proposed in recent years. Fully Convolutional Networks (FCN) [14] is the most typical model among them. FCN uses multiple convolution operations to reduce the size of features and increase the number of channels. In the final process, the feature is mapped to the same size as the image through the convolution operation, and the number of channels is the number of classifications. Wang proposed a convolutional neural network and incorporate it into a semi-supervised learning framework [15]. Yang designed a multi query attention module which fuse the multi-scale feature [16]. DeepLab is another convolution neural network model which used the atrous convolution in the convolutional layer. Later, there are other versions of Deeplab were proposed [17], [18].
In the field of medical imaging, Ronneberger et al. [19] designed the U-Net which is used image segmentation. To U-Net adopted encoder–decoder architecture, and took skip connections to eliminate the semantic gap between features. Because a lot of medical data in clinical diagnosis is three-dimensional, Milletari et al. [20] developed a V-Net by using 3D convolution and residual block based on U-Net.
Zhou et al. [21] modified an U-Net++, they built multiple U-Net networks with different layers, then skip-connected them, and finally determined the optimal architecture through pruning. In addition, U-Net had also been expanded to 3D U-Net [22], Attention U-Net [23], MultipeResUNet [24] for medical image segmentation.
2.2. Artificial intelligence for COVID-19
There have been many attempts to apply the CNN model to the detection and segmentation of COVID-19 lesions [7]. In terms of typical models, Xu et al. [25] employed ResNet [26] to distinguish COVID-19 from other cases. Wang et al. [27] connects two parallel 3D-ResNet branches to construct a prior-attention residual learning (parl) module, one for detection and the other one for classification during the module, then stack multiple parl modules to build an end-to-end model for COVID-19 detection. Cao et al. [28] employed U-Net [19] to segment the lungs from CT scans. Chen et al. [29] respectively used U-Net++ for detection and segmentation of the infection lesions from CT scans. Han et al. [30] applied the attention mechanism to multiple instance learning complete the automatic segmentation of COVID-19 and increased interpretability of the network. Wu et al. [31] proposes a Sequential Region Generation Network (SRGNet), to jointly detect and segment the lesion areas of COVID-19. Hu et al. proposes a segmentation scheme by enhancing supervised information and fusing multi-scale feature maps of different levels based on the encoder–decoder architecture [32].
In terms of innovative models, Fan et al. [33] designed a COVID-19 lesion segmentation network Inf-Net based on CT images. The Edge Attention module (EA) was added to Inf-Net to make full use of the rough information of the lesion boundary. A Reverse Attention module (RA) was constructed to provide details of the lesion area. Zhao proposes a method that integrates a 3D V-Net with shape priors was proposed for medical image segmentation [34]. Ouyang et al. [35] used two different sampling strategies, uniform sampling (US) and size-balanced sampling (SS), for the dataset, and then inputted the sampled results into two branches with the same architecture. Each branch consists of a 3D ResNet34 followed by an attention module, then the results of two branches are applied to ensemble learning. Li et al. [36] developed the COVNet to detect COVID-19, CAP, and Non-Pneumonia. COVNet gets a set of CTs into multiple branches, each of which is ResNet50 and shares parameters, and then the results of each branch are merged using max pooling. Wu et al. [11] adopted the encoder–decoder architecture and used VGG16 as the backbone of the encoder, and then an Enhanced Feature Module (EFM) was added in the final stage of the encoder. An Attentive Feature Fusion (AFF) that payed more attention to small-size feature maps was constructed as a basic block in the decoder stage. In addition, to solve the problem of few high-quality annotation samples in CT images, Wang et al. [37], and Wang et al. [9] designed a semi-supervised framework for scans of COVID-19. And several CT scan diagnosis systems had been established for testing the suspected COVID-19 cases [38], [39].
3. Method
3.1. F3-Net framework
The overall framework of F3-Net is shown in Fig. 1. As we can see from Fig. 1, the overall architecture is U-shaped, which is divided into two parts, namely Encoder and Decoder. The Encoder extracts the features from the images by Base Module (BM) and Multiple Scale Module (MSM), and the Decoder restores the features to images by BM, Dense Path Module (DPM), and Attention Fusion Module (AFM).
Fig. 1.

The architecture of F3-Net, which adopts encoder–decoder architecture and mainly includes four types of modules, namely Base Module (BM), Multiple Scale Module (MSM), Dense Path Module (DPM), Attention Fusion Module (AFM). The input data is the original CT images, and the output results are the lesion areas.
The Encoder input is the preprocessed image, and the input images serially are passed through the BM and MSM modules to obtain . performs maximum pooling, reduces the size of the feature maps to half of the original size, and then serially passes them through the BM and MSM modules to obtain the feature maps . This process is repeated four times in total, and the feature map generated by the MSM module is {}. The process is described as for in Eq. (1):
| (1) |
In Eq. (1), represents the BM in Fig. 1. is the maximum pooling with a 2 × 2 pooling window. is the MSM module.
The input of the decoder is , , output after DPM, increases the size of the feature map to twice of the original after upsampling, and then enters AFM together with , and then passes BM to obtain . This process is repeated four times in total, among which the features are generated by BM {}. After the last output passes through Conv 1 × 1, the output feature representing the segmentation result map has the same resolution as the input images. The computing process for the above process is expressed as Eq. (2):
| (2) |
In Eq. (2), represents the BM. is the Bilinear interpolation algorithm. is the AFM.
3.1.1. Base module
BM is the basic unit in the model as usual, its main function is to extract features and modify the number of feature channels, which is composed of serial Conv3 × 3, BN (Batch Norm), Relu, Conv3 × 3, BN, and Relu. Its main structure is shown in Fig. 2.
Fig. 2.
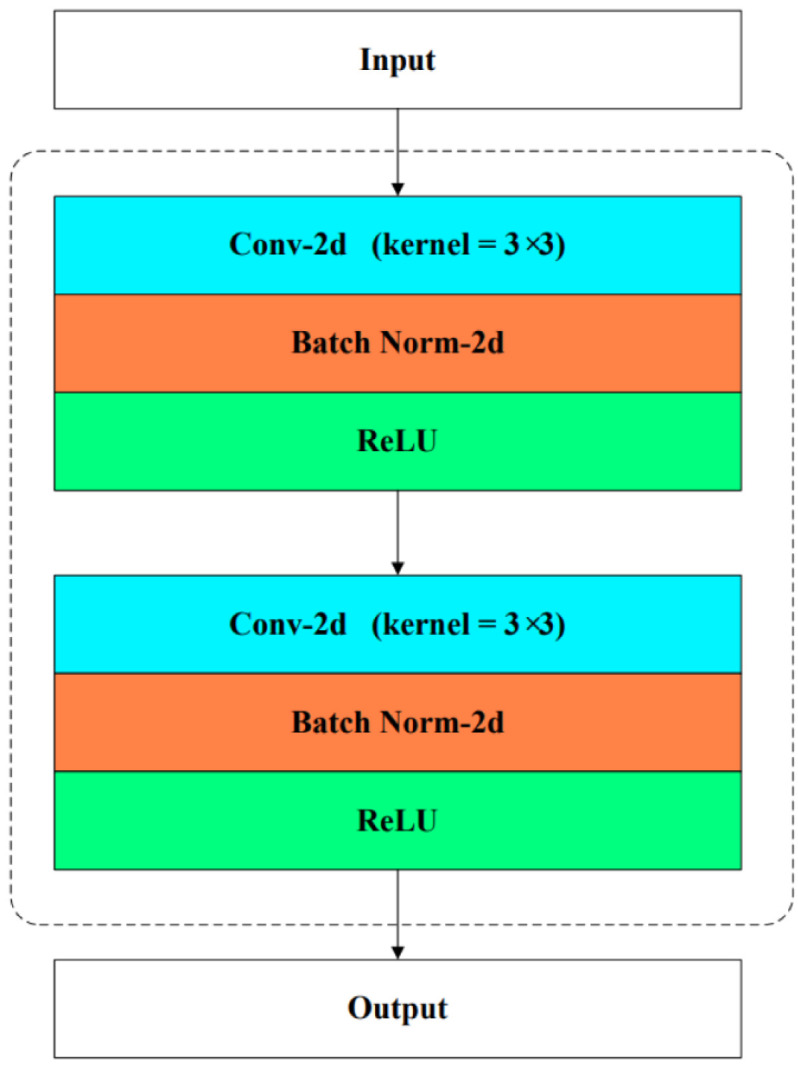
Base Module is utilized to extract features mainly through serial convolution, batch normalization and relu operations. Its input and output are features.
3.1.2. Multiple scale module
The COVID-19 lesions in CT images have the characteristics of different sizes and shapes. Therefore, we designed a MSM as shown in Fig. 3, and added it after each Base Module in the encoder. MSM is inspired by ASPP [17] and PPM [40]. It is characterized using convolution modules with different receptive fields, so it can capture features of different scales, so as to increase the ability to perceive multi-scale lesions of F3-Net.
Fig. 3.

Multiple Scale Module is utilized to better deal with lesions at multiple scales. It mainly implements the extraction of features of different scales through two methods, dilated convolution and serial pooling, convolution, and up sampling. Different colored blocks in the figure represent features of different scales.
MSM is divided into two parts, and . consists of parallel branches. In each branch, first changes the size of the feature map to expand the receptive field through the average pooling operation, then changes the number of channels of the feature map to through the convolutional layer, and finally uses bilinear interpolation restores the feature map to its original size. After these branches, feature submaps {} can be obtained. consists of parallel branches. In each branch, passes through dilated convolution with different dilation rates and changes the number of channels of the feature map to , and then feature submaps {} are obtained. The difference between the dilated convolution and the classic convolution is that it enlarges the receptive field to by setting the dilation rate without changing the number of parameters and the calculation cost.
Finally, and the feature submaps are joined together to obtain , and the number of channels has increased . gets after Conv 3 × 3, and the dimension and size of and are the same, and then enter the next module.
3.1.3. Dense path module
To solve the information loss phenomenon caused by up sampling in the decoder stage, Ronneberger et al. [19] chooses to directly connect the features of the encoder to the corresponding decoder features, which enables the network to propagate directly from the encoder to the decoder. Ibtehaz et al. [24] indicates that the feature in the encoder is close to the original image and is a low-level feature, while the feature in the decoder is a high-level feature. There is a big semantic gap, and if the fusion is directly carried out, it may cause some influences that are not conducive to segmentation. Inspired by MultipleResUNet [24] and Densely Connected Convolutional [41], we designed a Dense Path Modul (DPM) as shown in Fig. 4 to narrow the feature gap between encoder and decoder. Therefore, the low-level feature generates after passing through the DPM in F3-Net, and then is connected with the high-level feature instead of direct fusion, which can reduce the semantic gap.
Fig. 4.

Dense Path Module is utilized to eliminate the semantic gap between encoder and decoder features. Its input is and its output is . It contains several serial Dense Modules.
The DPM is composed of Dense Module (DM). Define , each DM concats with after passing through DM to obtain . has more than in the number of channels, where as shown in Eq. (3).
| (3) |
Finally, has more than in the number of channels, so the dimension of is reduced to be consistent with through the Base Module to get , and then they are imported into the next module, where as shown in Eq. (4).
| (4) |
3.1.4. Attention fusion module
The feature fusion strategy used in [19] is concat function. Concat does not distinguish between the two features and directly connects the two features according to a certain dimension. It is like getting two strangers who have never met to work together. Inspired by [42], [43], we designed the Attention Fusion Module (AFM) to replace the concat operation to better integrate and . AFM can make the feature map adaptively adjust the relationship between each channel and adaptively adjust the relationship between multiple feature maps.
Grouping convolution is used in various lightweight models to reduce the number of operations and parameters by dividing the input feature map equally into several groups by channels and then performing regular convolution on each group, while isolating the information exchange between different groups [44].
As shown in Fig. 5(a). There are two fusions in the AFM. In the first fusion, is bilinearly interpolated and then subjected to the same grouping convolution operation as to obtain feature maps {} respectively. Then we get from and via an element-wise addition as shown in Eq. (5).
| (5) |
where is element-wise addition. In the second fusion, is pooled by the average pooling to obtain a vector of length . Each element in represents the comprehensive statistical information of the corresponding channel in . To further enable a certain channel in the feature map to focus on the information of other channels, is passed through a fully connected layer of size to obtain a vector of length as shown as Eq. (6).
| (6) |
represents average pooling, and represents a fully connected layer with length from to . Then let goes through two fully connected layers of size , and the we get two vectors and of length as Eq. (7). and are passed into the layer to generate two vectors of length . {} and feature map {} are correspondingly element-wise prodcuted and then element-wise addition to get the .
| (7) |
| (8) |
| (9) |
In Eq. (8) is softmax function. In Eq. (9), is element-wise product. The first fusion is preliminary and naive, and the two features pay attention to each other’s weights in the second fusion, which are more detailed and have an inter-channel attention mechanism. It is worth mentioning that the AFM is not limited to the fusion between the two features in this work. It can also be used to replace the concat operation of multiple features and can be embedded as a separate component in an existing network model, as shown in Fig. 5(b).
Fig. 5.

Attention Fusion Module contains an attention mechanism, which can make features more harmoniously merged. (a) is the application of AFM in F3-Net. (b) is an expanded form that can fuse multiple features.
3.2. Loss function with lesion location knowledge
Due to factors such as blurred borders and low contrast, the COVID-19 lesions in CT are often similar to normal human tissues, and even some lesions are connected with blood vessels and lung parenchyma. This makes it hard for the deep learning model to identify areas with similar pixels, shapes with COVID-19 lesions as normal tissue areas. Especially, these detected areas are often not even within the lung regions, so the segmentation accuracy is quite poor.
After collecting the clinical experiences from multiple doctors and observing the CT images of the cases, this work obtained the area by scaling all the labeled lesions in the training set and then element-wisely summarize all pixels. The statistical matrix of pixels of all lesions in the training set. Summary of distribution characteristics is computed for later usage. As shown in Fig. 6(c), It is easy to see that the lesion area is concentrated in the left and right lung lobes, and the area other than the lung lobes does not contain the lesion. As shown in Fig. 6, (a) is the histogram after is projected on the first dimension ( axis of image). (b) is the histogram after is projected on the second dimension ( axis of image).
Fig. 6.

Statistics of our dataset. (a)(b) The distribution map of lesion pixels in different dimensions. (c) The heat map of the pixels of the lesion. (d) The heat map of .
According to the facts in Fig. 6(a), (b), and (c), we can verify the conclusion that the ROI (Region of Interest) in the training set is concentrated in the left and right lung lobes, and the rest are basically free of focus. Assuming that the distribution of lesions in the test set is the same as that in the training set, this paper designs a loss function according to the characteristics of lesions distribution with Eq. (10).
| (10) |
The details of and in Eq. (10) is computed as Eq. (11).
| (11) |
In Eq. (10), represents the result predicted by the F3-Net for the input CT image at the position , represents the value at the position of the lesion image corresponding to the input CT image. is a piecewise function, representing the attention weight in , are the start and end positions of the lesion area distribution in the training set, which must be obtained according to the distribution characteristics of the pixels in . Fig. 6(d) is the heat map of the weight of each position of in a 256 × 256 area.
The points in the non-lesion area in can be given a coefficient value greater than by , and the label value of the points in the non-lesion area is , so the larger the prediction value is, the greater the loss value will be. During the training process, the points in the lesion area can obtain more attention than points the non-lesions area, which can improve the segmentation accuracy.
4. Experiments and discussion
This section describes the dataset created in this paper and the implemented details of the method firstly. The performance evaluation is conducted, and general metrics are analyzed.
4.1. Experimental setting
4.1.1. Setting of neural network
In the experimental environment, the F3-Net is implemented on the pytorch platform. The type of GPUs in server is 8*GTX 1080Ti.
The specific parameters of the method are configured as follows. In the encoder stage, the size of the feature is changed through max pooling, and the number of channels in the feature is changed through Base Module. The size of is . The reason why the number of channels of is not doubled compared to but is consistent with it is that the up sampling method is a bilinear interpolation, which does not contain parameters and cannot change the number of channels compared to transposed convolution. It can save computing resources in the decoder stage. In the decoder stage, the scale of the feature is changed by bilinear interpolation. The sizes of are .
In the MSM module, we set . In the four branches of the part, the multiple mean pooling scales are and the method for up sampling is also bilinear interpolation. The sizes of the convolution kernels in the four branches of the part are respectively. The dilation rates are . We set to of the number of channels. MSM module can be easily extended to more branches, and it can be embedded as a separate component in the existing network model.
When in is smaller, is closer to the original image, and is closer to the segmentation result. Therefore, it can be seen that the semantic gap between and after up sampling is different, and as i becomes larger, the gap will gradually become smaller. So in the DPM, we set the values of in the DPM after are . At the same time, the growth rate respectively are set as .
In the AFM, because the dimensions of are different, the number of groups in the corresponding group convolution should not be static. Therefore, the size of the convolution kernel for the group convolution is 3 × 3, and the number of groups in group convolution is of the number of channels. The length of the vector is of the length of the vector.
According to the Summary of distribution characteristics, the function parameter is set to 107, and parameter is set to 8.
4.1.2. Evaluation metrics
In order to quantitatively analyze the experimental results just as segmentation tasks, we use the following indicators to measure the results to evaluate the performance of the method, that are Sensitivity (), Specificity (), Precision (), Dice score. We also introduce two golden metrics, Enhanced-Alignment Measure (), Mean Absolute Error (MAE), which are defined as Eqs. (12) to (13).
| (12) |
| (13) |
where and have the same meaning as in Eq. (10).
4.2. Materials
4.2.1. COVID-19 segmentation dataset
Since the number of samples in the existing public dataset is small and fuzzy, it is very easy to cause the phenomenon that the model cannot be fitted. Therefore, this paper constructs a dataset for F3-Net to perform image segmentation experiments. The details are as follows: 358 cases of different new coronary patients from the same hospital were used.
Each case file format is ‘.nii’. In each case, personal information was hidden, and RT-PCR tests were done, and the results were positive. Each case contains more than 300 CT images, and each CT image has been manually marked with the lesion area by two well experienced doctors using ITK-SNAP tool to obtain the lesion image corresponding to each CT series. A group of 4472 images with relatively good quality images are selected, and one pairwise of image lesion contains a CT source image and a corresponding lesion annotated image. (See Table 1.)
Table 1.
Some parameters of COVID-19 patients undergoing CT testing.
| Item | Value |
|---|---|
| Slice thickness | DS: “2.5” |
| KVP | DS: “120.0” |
| Data collection diameter | DS: “500.0” |
| Reconstruction diameter | DS: “320.0” |
| Distance source to patient | DS: “541.0” |
| Gantry/detector tilt | DS: “0.0” |
| Table height | DS: “124.0” |
| Rotation direction | CS: ‘CW’ |
| Exposure time | IS: “1160” |
| Generator power | IS: “31800” |
| Focal spot(s) | DS: “1.2” |
4.2.2. Preprocessing
In data preprocessing, scale of all CT images and lesion images are set as 256 × 256, and then the method normalizes the pixel values of CT image to by setting the window width (WW) and window level (WL) as 1500HU and −450HU respectively. Finally, the value of all point will be normalized from to .
The training strategies of the method is preset as following. Firstly, the data set is divided into training set, validation set, and test set according to the ratio of , and then the training set is rotated by for data enhancement. Finally, the data of the training set is used to train F3-Net model. The batch size is set to 6, the learning rate is set to , and the optimization algorithm is [45], where , , and , loss function is , and the value of iterations is 1000. The validation and test sets are used to evaluate the method in train stage and test stage.
To prove the superior performance of F3-Net for comparison with models used in COVID-19 image segmentation task which are the U-Net [19], the FCN [14], the Attention-UNet [46] and COPLENet [37].
4.3. Results
4.3.1. Quantitative results
We compare our F3-Net with four state-of-the-art networks for semantic segmentation. FCN [14] only consists of multiple convolutional layers. U-Net [19] uses the architecture of down-sampling and up-sampling and uses skip-connection to reduce semantic gaps between features. Attention-Unet [46] involves an attention mechanism based on U-Net. COPLE-Net [37] replaced the skip connection of U-Net with a bridge layer and integrates a combination of maximum pooling and average pooling to reduce information loss in the pooling process and achieves top performance in COVID-19 lesion segmentation. Table 2 shows the results of quantitative analysis.
Table 2.
Quantitative results of lesion infection regions on our dataset.
As we can see from the Table 2, F3-Net achieved scores of 77.58%, 80.79%, 99.16%, 74.61%, 1.38% and 98.57% in terms of Dice, Sen, Spe, Pre, MAE and respectively [47], [48]. Compared with other networks, F3-Net has achieved the best results on the key indexes, , and . The DPM can reduce the semantic gap between the encoder and decoder features. Moreover, AFM can provide attention mechanism to make the features more harmonious fusion. Furthermore, the performance of F3-Net can be even improved by using , which is reflected as the increment of 0.81%, 0.09%, 2.01%, 0.07% and 0.25% on the , , , and respectively. It can be concluded from the addition of prior knowledge of lesion distribution in , which limits the prediction results of the model and makes the model more biased towards the lesion areas.
4.3.2. Qualitative results
The segmentation results, shown in Fig. 7, indicate that the segmentation result of F3-Net is more close to the original lesion image and contains few errors and magazines than others. However, compared with F3-Net, the experimental results of other networks are worse. For example, the experimental results of FCN basically do not contain the lesion area, which is almost completely inconsistent with ground truth. The result of U-Net is better than FCN, which is basically the lesion included, but there are many impurities and errors in addition to the lesion. Attention-UNet and COPLE-Net improve the experimental results, but also have many errors. This accuracy of F3-Net is in line with the design idea of F3-Net. Because of the different sizes and special shapes of COVID-19 lesions, the MSM module is designed so that the network can adapt to multi-scale features to capture lesions of different sizes better.
Fig. 7.

Visual comparison of COVID-19 lesions segmentation results of different methods on our test set.
4.3.3. Ablation study
We propose three key improved points of MSM, DPM and AFM modules. They are important components of F3-Net. MSM is applied to the encoder stage, which can sense features of different sizes to capture ROI of different sizes and shapes, DPM can eliminate the semantic gap between the features in the encoder and the decoder, AFM adds an attention mechanism is applied to the decoder stage, which can enable a more harmonious fusion between multiple features. The ablation study for every module is conducted on the dataset and the evaluation results are shown in Table 3.
Table 3.
Ablation study for the proposed DPM, MSM and AFM in the our model. The best top two results are shown in red and blue fonts, where * and blank represent switches. The F3-Net will use the title’s module of the column when the value is *, otherwise it is blank.
| No | DPM | MSM | AFM | Dice | Sen | Spe | Pre | MAE | |
|---|---|---|---|---|---|---|---|---|---|
| 1 | 0.6904 | 0.6489 | 0.9913 | 0.7375 | 0.0172 | 0.9782 | |||
| 2 | * | 0.7185 | 0.6933 | 0.9928 | 0.7457 | 0.0161 | 0.9843 | ||
| 3 | * | 0.7419 | 0.7651 | 0.9909 | 0.7201 | 0.0158 | 0.9854 | ||
| 4 | * | 0.7387 | 0.7583 | 0.9910 | 0.7200 | 0.0159 | 0.9857 | ||
| 5 | * | * | 0.7331 | 0.7637 | 0.9902 | 0.7048 | 0.0165 | 0.9836 | |
| 6 | * | * | 0.7652 | 0.7662 | 0.9928 | 0.7643 | 0.0139 | 0.9886 | |
| 7 | * | * | 0.7658 | 0.8144 | 0.9905 | 0.7227 | 0.0147 | 0.9812 | |
| 8 | * | * | * | 0.7758 | 0.8079 | 0.9916 | 0.7461 | 0.0138 | 0.9857 |
The ablation experiments of these modules are shown in the Table 3, where No. 1 result is the baseline without MSM, DPM and AFM. We first apply MSM, DPM and AFM to the baseline separately and perform experiments on the test set, and get results No. 3, No. 2 and No. 4. Their improvements in terms of Dice score compared to No. 1 are and 4.83% respectively. In addition, it can be clearly observed that by applying any two of these modules to baseline, various indicators can also be improved. Through No. 7 vs No. 3, No. 6 vs No. 3 and No. 6 vs No. 5, the effectiveness of DPM, AFM and MSM can be seen separately. Finally, it can be observed that No. 8 (baseline + DPM + MSM + AFM) increases the baseline performance in terms of major metrics, such as Dice, MAE, etc. Therefore, we can conclude that the MSM, DPM and AFMs have significant contributions to the performance improvement of F3-Net.
4.4. Discussion
To address the difficulties of the scales of lesions are not uniform, the area of the lesion is quite different and the morphology of lesion is variable, we proposes a COVID-19 Lesion Segmentation network, where the multiscale perception module enables the model to adaptively select different size perceptual fields to better capture COVID-19 lesions of different sizes in CT images, the dense path module eliminates the semantic gap between feature maps, the attention fusion module, the attention fusion module gives specific weights to different channels of different feature maps so that they can mutually suppress the unimportant information when fusing. Although our proposed model achieves good results in automatic segmentation of COVID-19 lesions, the performance and generalization ability of the model can be further improved in the future.
Although our proposed model achieves good results in automatic segmentation of COVID-19 lesions, the performance and generalization ability of the model can be further improved in the future. First, we only considered the specificity of CT images for the COVID-19 lesion segmentation task, ignoring other medical tests of patients, such as blood routine, which are not in the same modality as CT images, but contain some important information as well. Then, the 3D texture features were ignored in the feature extraction process. Finally, we did not further classify the segmented lesion regions. Therefore, our future work has the following points. First, we will extend our proposed framework to other modalities besides CT images, such as ultrasound, to achieve automatic segmentation of COVID lesions. Then, we will try to extract image features from multiple spatial dimensions. Finally, we plan to develop multi-task learning models to design COVID-19 lesion segmentation and classification algorithms.
5. Conclusions
In this paper, we propose a Fully Feature Fusion Based Neural Network for COVID-19 Lesion Segmentation in CT images, which is mainly composed of three core modules MSM, DPM, and AFM, where MSM module focuses on the extraction of multi-scale features, DPM is used to eliminate semantics between features gap, and AFM focuses on the fusion between features. We have constructed a dataset for COVID-19 lesion segmentation to facilitate the neural network’s training, which contains 4472 sets of CT and corresponding COVID-19 lesion images. Extensive experiments on the dataset have demonstrated that the proposed F3-Net advance the state-of-the-art performances. Note that the proposed model can help clinicians more accurately segment COVID-19 lesions and conduct further research.
CRediT authorship contribution statement
Wei Li: Experimental ideas, Evaluated experimental data, Drafted manuscripts. Yangyong Cao: Designs experimental procedures collects data, Assists in manuscript writing. Shanshan Wang: Designs experimental procedures collects data, Assists in manuscript writing. Bolun Wan: Revised the manuscript and evaluates the data.
Declaration of Competing Interest
The authors declare that they have no known competing financial interests or personal relationships that could have appeared to influence the work reported in this paper.
Acknowledgment
All authors approved the version of the manuscript to be published.
Footnotes
This document is the results of the research project funded by National key research and development program, China (2021YFC2701003), the Fundamental Research Funds for the Central Universities, China (N2016006).
Data availability
The data that has been used is confidential.
References
- 1.Zu Zi Yue, Jiang Meng Di, Xu Peng Peng, Chen Wen, Ni Qian Qian, Lu Guang Ming, Zhang Long Jiang. Coronavirus disease 2019 (COVID-19): A perspective from China. Radiology. 2020;296(2):E15–E25. doi: 10.1148/radiol.2020200490. [DOI] [PMC free article] [PubMed] [Google Scholar]
- 2.Ai Tao, Yang Zhenlu, Hou Hongyan, Zhan Chenao, Chen Chong, Lv Wenzhi, Tao Qian, Sun Ziyong, Xia Liming. Correlation of chest CT and RT-PCR testing for coronavirus disease 2019 (COVID-19) in China: A report of 1014 cases. Radiology. 2020;296(2):E32–E40. doi: 10.1148/radiol.2020200642. [DOI] [PMC free article] [PubMed] [Google Scholar]
- 3.Wang Shuai, Kang Bo, Ma Jinlu, Zeng Xianjun, Xiao Mingming, Guo Jia, Cai Mengjiao, Yang Jingyi, Li Yaodong, Meng Xiangfei, et al. A deep learning algorithm using CT images to screen for corona virus disease (COVID-19) Eur. Radiol. 2021:1–9. doi: 10.1007/s00330-021-07715-1. [DOI] [PMC free article] [PubMed] [Google Scholar]
- 4.Wang Youxin, Hou Haifeng, Wang Wenrui, Wang Wei. Combination of CT and RT-PCR in the screening or diagnosis of COVID-19. J. Glob. Health. 2020;10(1) doi: 10.7189/jogh.10.010347. [DOI] [PMC free article] [PubMed] [Google Scholar]
- 5.Salehi Sana, Abedi Aidin, Balakrishnan Sudheer, Gholamrezanezhad Ali. Coronavirus disease 2019 (COVID-19): A systematic review of imaging findings in 919 patients. Am. J. Roentgenol. 2020;215(1):87–93. doi: 10.2214/AJR.20.23034. [DOI] [PubMed] [Google Scholar]
- 6.Huang Zixing, Zhao Shuang, Li Zhenlin, Chen Weixia, Zhao Lihong, Deng Lipeng, Song Bin. The battle against coronavirus disease 2019 (COVID-19): Emergency management and infection control in a radiology department. J. Am. Coll. Radiol. 2020;17(6):710–716. doi: 10.1016/j.jacr.2020.03.011. [DOI] [PMC free article] [PubMed] [Google Scholar]
- 7.Shi Feng, Wang Jun, Shi Jun, Wu Ziyan, Wang Qian, Tang Zhenyu, He Kelei, Shi Yinghuan, Shen Dinggang. Review of artificial intelligence techniques in imaging data acquisition, segmentation and diagnosis for COVID-19. IEEE Rev. Biomed. Eng. 2020 doi: 10.1109/RBME.2020.2987975. [DOI] [PubMed] [Google Scholar]
- 8.Wang Linda, Lin Zhong Qiu, Wong Alexander. COVID-Net: A tailored deep convolutional neural network design for detection of COVID-19 cases from chest X-ray images. Sci. Rep. 2020;10(1):1–12. doi: 10.1038/s41598-020-76550-z. [DOI] [PMC free article] [PubMed] [Google Scholar]
- 9.Wang Xinggang, Deng Xianbo, Fu Qing, Zhou Qiang, Feng Jiapei, Ma Hui, Liu Wenyu, Zheng Chuansheng. A weakly-supervised framework for COVID-19 classification and lesion localization from chest CT. IEEE Trans. Med. Imaging. 2020;39(8):2615–2625. doi: 10.1109/TMI.2020.2995965. [DOI] [PubMed] [Google Scholar]
- 10.Oulefki Adel, Agaian Sos, Trongtirakul Thaweesak, Laouar Kassah Azzeddine. Automatic COVID-19 lung infected region segmentation and measurement using CT-scans images. Pattern Recognit. 2021:107747. doi: 10.1016/j.patcog.2020.107747. [DOI] [PMC free article] [PubMed] [Google Scholar]
- 11.Wu Yu-Huan, Gao Shang-Hua, Mei Jie, Xu Jun, Fan Deng-Ping, Zhang Rong-Guo, Cheng Ming-Ming. JCS: An explainable COVID-19 diagnosis system by joint classification and segmentation. IEEE Trans. Image Process. 2021;30:3113–3126. doi: 10.1109/TIP.2021.3058783. [DOI] [PubMed] [Google Scholar]
- 12.Zhou Tongxue, Canu Stéphane, Ruan Su. Automatic Covid-19 CT segmentation using U-Net integrated spatial and channel attention mechanism. Int. J. Imaging Syst. Technol. 2021:16–27. doi: 10.1002/ima.22527. [DOI] [PMC free article] [PubMed] [Google Scholar]
- 13.Wang Qi, Gao Junyu, Li Xuelong. Weakly supervised adversarial domain adaptation for semantic segmentation in urban scenes. IEEE Trans. Image Process. 2019;28(9):4376–4386. doi: 10.1109/TIP.2019.2910667. [DOI] [PubMed] [Google Scholar]
- 14.Jonathan Long, Evan Shelhamer, Trevor Darrell, Fully convolutional networks for semantic segmentation, in: Proceedings of the IEEE Conference on Computer Vision and Pattern Recognition, 2015, pp. 3431–3440. [DOI] [PubMed]
- 15.Wang Guotai, Zhai Shuwei, Lasio Giovanni, Zhang Baoshe, Yi Byong, Chen Shifeng, Macvittie Thomas J., Metaxas Dimitris, Zhou Jinghao, Zhang Shaoting. Semi-supervised segmentation of radiation-induced pulmonary fibrosis from lung CT scans with multi-scale guided dense attention. IEEE Trans. Med. Imaging. 2022;41(3):531–542. doi: 10.1109/TMI.2021.3117564. [DOI] [PMC free article] [PubMed] [Google Scholar]
- 16.MMViT-Seg: A lightweight transformer and CNN fusion network for COVID-19 segmentation. Comput. Methods Programs Biomed. 2023;230 doi: 10.1016/j.cmpb.2023.107348. [DOI] [PMC free article] [PubMed] [Google Scholar]
- 17.Chen Liang-Chieh, Papandreou George, Kokkinos Iasonas, Murphy Kevin, Yuille Alan L. Deeplab: Semantic image segmentation with deep convolutional nets, atrous convolution, and fully connected crfs. IEEE Trans. Pattern Anal. Mach. Intell. 2017;40(4):834–848. doi: 10.1109/TPAMI.2017.2699184. [DOI] [PubMed] [Google Scholar]
- 18.Liang-Chieh Chen, Yukun Zhu, George Papandreou, Florian Schroff, Hartwig Adam, Encoder-decoder with atrous separable convolution for semantic image segmentation, in: Proceedings of the European Conference on Computer Vision, ECCV, 2018, pp. 801–818.
- 19.Ronneberger Olaf, Fischer Philipp, Brox Thomas. International Conference on Medical Image Computing and Computer-Assisted Intervention. Springer; 2015. U-Net: Convolutional networks for biomedical image segmentation; pp. 234–241. [Google Scholar]
- 20.Milletari Fausto, Navab Nassir, Ahmadi Seyed-Ahmad. V-Net: Fully convolutional neural networks for volumetric medical image segmentation. 2016 Fourth International Conference on 3D Vision; 3DV; IEEE; 2016. pp. 565–571. [Google Scholar]
- 21.Zhou Zongwei, Siddiquee Md Mahfuzur Rahman, Tajbakhsh Nima, Liang Jianming. UNet++: Redesigning skip connections to exploit multiscale features in image segmentation. IEEE Trans. Med. Imaging. 2019;39(6):1856–1867. doi: 10.1109/TMI.2019.2959609. [DOI] [PMC free article] [PubMed] [Google Scholar]
- 22.Çiçek Özgün, Abdulkadir Ahmed, Lienkamp Soeren S, Brox Thomas, Ronneberger Olaf. International Conference on Medical Image Computing and Computer-Assisted Intervention. Springer; 2016. 3D U-Net: Learning dense volumetric segmentation from sparse annotation; pp. 424–432. [Google Scholar]
- 23.Oktay Ozan, Schlemper Jo, Folgoc Loïc Le, Lee M.J., Heinrich Mattias P., Misawa Kazunari, Mori Kensaku, McDonagh Steven G., Hammerla Nils Y., Kainz Bernhard, Glocker Ben, Rueckert Daniel. 2018. Attention U-Net: Learning where to look for the pancreas. arXiv, arXiv:1804.03999. [Google Scholar]
- 24.Ibtehaz Nabil, Rahman M. Sohel. MultiResUNet: Rethinking the U-Net architecture for multimodal biomedical image segmentation. Neural Netw. 2020;121:74–87. doi: 10.1016/j.neunet.2019.08.025. [DOI] [PubMed] [Google Scholar]
- 25.Xu Xiaowei, Jiang Xiangao, Ma Chunlian, Du Peng, Li Xukun, Lv Shuangzhi, Yu Liang, Ni Qin, Chen Yanfei, Su Junwei, et al. A deep learning system to screen novel coronavirus disease 2019 pneumonia. Engineering. 2020;6(10):1122–1129. doi: 10.1016/j.eng.2020.04.010. [DOI] [PMC free article] [PubMed] [Google Scholar]
- 26.Kaiming He, Xiangyu Zhang, Shaoqing Ren, Jian Sun, Deep residual learning for image recognition, in: Proceedings of the IEEE Conference on Computer Vision and Pattern Recognition, 2016, pp. 770–778.
- 27.Wang Jun, Bao Yiming, Wen Yaofeng, Lu Hongbing, Luo Hu, Xiang Yunfei, Li Xiaoming, Liu Chen, Qian Dahong. Prior-attention residual learning for more discriminative COVID-19 screening in CT images. IEEE Trans. Med. Imaging. 2020;39(8):2572–2583. doi: 10.1109/TMI.2020.2994908. [DOI] [PubMed] [Google Scholar]
- 28.Cao Yukun, Xu Zhanwei, Feng Jianjiang, Jin Cheng, Han Xiaoyu, Wu Hanping, Shi Heshui. Longitudinal assessment of COVID-19 using a deep learning–based quantitative CT pipeline: Illustration of two cases. Radiol. Cardiothorac. Imaging. 2020;2(2) doi: 10.1148/ryct.2020200082. [DOI] [PMC free article] [PubMed] [Google Scholar]
- 29.Chen Jun, Wu Lianlian, Zhang Jun, Zhang Liang, Gong Dexin, Zhao Yilin, Chen Qiuxiang, Huang Shulan, Yang Ming, Yang Xiao, et al. Deep learning-based model for detecting 2019 novel coronavirus pneumonia on high-resolution computed tomography. Sci. Rep. 2020;10(1):1–11. doi: 10.1038/s41598-020-76282-0. [DOI] [PMC free article] [PubMed] [Google Scholar]
- 30.Han Zhongyi, Wei Benzheng, Hong Yanfei, Li Tianyang, Cong Jinyu, Zhu Xue, Wei Haifeng, Zhang Wei. Accurate screening of COVID-19 using attention-based deep 3D multiple instance learning. IEEE Trans. Med. Imaging. 2020;39(8):2584–2594. doi: 10.1109/TMI.2020.2996256. [DOI] [PubMed] [Google Scholar]
- 31.Wu Jipeng, Xu Haibo, Zhang Shengchuan, Li Xi, Chen Jie, Zheng Jiawen, Gao Yue, Tian Yonghong, Liang Yongsheng, Ji Rongrong. Joint segmentation and detection of COVID-19 via a sequential region generation network. Pattern Recognit. 2021 doi: 10.1016/j.patcog.2021.108006. [DOI] [PMC free article] [PubMed] [Google Scholar]
- 32.Hu Haigen, Shen Leizhao, Guan Qiu, Li Xiaoxin, Zhou Qianwei, Ruan Su. Deep co-supervision and attention fusion strategy for automatic COVID-19 lung infection segmentation on CT images. Pattern Recognit. 2022 doi: 10.1016/j.patcog.2021.108452. [DOI] [PMC free article] [PubMed] [Google Scholar]
- 33.Fan Deng-Ping, Zhou Tao, Ji Ge-Peng, Zhou Yi, Chen Geng, Fu Huazhu, Shen Jianbing, Shao Ling. Inf-Net: Automatic COVID-19 lung infection segmentation from CT images. IEEE Trans. Med. Imaging. 2020;39(8):2626–2637. doi: 10.1109/TMI.2020.2996645. [DOI] [PubMed] [Google Scholar]
- 34.Lung segmentation and automatic detection of COVID-19 using radiomic features from chest CT images. Pattern Recognit. 2021;119 doi: 10.1016/j.patcog.2021.108071. [DOI] [PMC free article] [PubMed] [Google Scholar]
- 35.Ouyang Xi, Huo Jiayu, Xia Liming, Shan Fei, Liu Jun, Mo Zhanhao, Yan Fuhua, Ding Zhongxiang, Yang Qi, Song Bin, et al. Dual-sampling attention network for diagnosis of COVID-19 from community acquired pneumonia. IEEE Trans. Med. Imaging. 2020;39(8):2595–2605. doi: 10.1109/TMI.2020.2995508. [DOI] [PubMed] [Google Scholar]
- 36.Li Lin, Qin Lixin, Xu Zeguo, Yin Youbing, Wang Xin, Kong Bin, Bai Junjie, Lu Yi, Fang Zhenghan, Song Qi, et al. Artificial intelligence distinguishes COVID-19 from community acquired pneumonia on chest CT. Radiology. 2020 doi: 10.1148/radiol.2020200905. [DOI] [PMC free article] [PubMed] [Google Scholar]
- 37.Wang Guotai, Liu Xinglong, Li Chaoping, Xu Zhiyong, Ruan Jiugen, Zhu Haifeng, Meng Tao, Li Kang, Huang Ning, Zhang Shaoting. A noise-robust framework for automatic segmentation of COVID-19 pneumonia lesions from CT images. IEEE Trans. Med. Imaging. 2020;39(8):2653–2663. doi: 10.1109/TMI.2020.3000314. [DOI] [PMC free article] [PubMed] [Google Scholar]
- 38.Wang Yuhui, Dong Chengjun, Hu Yue, Li Chungao, Ren Qianqian, Zhang Xin, Shi Heshui, Zhou Min. Temporal changes of CT findings in 90 patients with COVID-19 pneumonia: A longitudinal study. Radiology. 2020;296(2):E55–E64. doi: 10.1148/radiol.2020200843. [DOI] [PMC free article] [PubMed] [Google Scholar]
- 39.Chung Michael, Bernheim Adam, Mei Xueyan, Zhang Ning, Huang Mingqian, Zeng Xianjun, Cui Jiufa, Xu Wenjian, Yang Yang, Fayad Zahi A., et al. CT imaging features of 2019 novel coronavirus (2019-nCoV) Radiology. 2020;295(1):202–207. doi: 10.1148/radiol.2020200230. [DOI] [PMC free article] [PubMed] [Google Scholar]
- 40.Hengshuang Zhao, Jianping Shi, Xiaojuan Qi, Xiaogang Wang, Jiaya Jia, Pyramid scene parsing network, in: Proceedings of the IEEE Conference on Computer Vision and Pattern Recognition, 2017, pp. 2881–2890.
- 41.Gao Huang, Zhuang Liu, Laurens Van Der Maaten, Kilian Q Weinberger, Densely connected convolutional networks, in: Proceedings of the IEEE Conference on Computer Vision and Pattern Recognition, 2017, pp. 4700–4708.
- 42.Xiang Li, Wenhai Wang, Xiaolin Hu, Jian Yang, Selective kernel networks, in: Proceedings of the IEEE/CVF Conference on Computer Vision and Pattern Recognition, 2019, pp. 510–519.
- 43.Jie Hu, Li Shen, Gang Sun, Squeeze-and-excitation networks, in: Proceedings of the IEEE Conference on Computer Vision and Pattern Recognition, 2018, pp. 7132–7141.
- 44.Ting Zhang, Guo-Jun Qi, Bin Xiao, Jingdong Wang, Interleaved Group Convolutions, in: 2017 IEEE International Conference on Computer Vision, ICCV, 2017, pp. 4383–4392.
- 45.Kingma Diederik P., Ba Jimmy. 2014. Adam: A method for stochastic optimization. [Google Scholar]
- 46.Oktay Ozan, Schlemper Jo, Folgoc Loic Le, Lee Matthew, Heinrich Mattias, Misawa Kazunari, Mori Kensaku, McDonagh Steven, Hammerla Nils Y., Kainz Bernhard, et al. 2018. Attention U-Net: Learning where to look for the pancreas. arXiv preprint arXiv:1804.03999. [Google Scholar]
- 47.Shan Fei, Gao Yaozong, Wang Jun, Shi Weiya, Shi Nannan, Han Miaofei, Xue Zhong, Shen Dinggang, Shi Yuxin. 2020. Lung infection quantification of COVID-19 in CT images with deep learning. arXiv, arXiv:2003.04655. [Google Scholar]
- 48.Deng-Ping Fan, Cheng Gong, Yang Cao, Bo Ren, Ming-Ming Cheng, Ali Borji, Enhanced-alignment Measure for Binary Foreground Map Evaluation, in: International Joint Conference on Artificial Intelligence, 2018.
Associated Data
This section collects any data citations, data availability statements, or supplementary materials included in this article.
Data Availability Statement
The data that has been used is confidential.