Abstract
Background
Differentiating high‐grade dysplasia (HGD) and T1 colorectal cancer (T1CRC) from low‐grade dysplasia (LGD) in colorectal polyps can be challenging. Incorrect recognition of HGD or T1CRC foci can lead to a need for additional treatment after local resection, which might not have been necessary if it was recognized correctly. Tumor‐targeted fluorescence‐guided endoscopy might help to improve recognition.
Objective
Selecting the most suitable HGD and T1CRC‐specific imaging target from a panel of well‐established biomarkers: carcinoembryonic antigen (CEA), c‐mesenchymal‐epithelial transition factor (c‐MET), epithelial cell adhesion molecule (EpCAM), folate receptor alpha (FRα), and integrin alpha‐v beta‐6 (αvβ6).
Methods
En bloc resection specimens of colorectal polyps harboring HGD or T1CRC were selected. Immunohistochemistry on paraffin sections was used to determine the biomarker expression in normal epithelium, LGD, HGD, and T1CRC (scores of 0–12). The differential expression in HGD‐T1CRC components compared to surrounding LGD and normal components was assessed, just as the sensitivity and specificity of each marker.
Results
60 specimens were included (21 HGD, 39 T1CRC). Positive expression (score >1) of HGD‐T1CRC components was found in 73.3%, 78.3%, and 100% of cases for CEA, c‐MET, and EpCAM, respectively, and in <40% for FRα and αvβ6. Negative expression (score 0–1) of the LGD component occurred more frequently for CEA (66.1%) than c‐MET (31.6%) and EpCAM (0%). The differential expression in the HGD‐T1CRC component compared to the surrounding LGD component was found for CEA in 66.7%, for c‐MET in 43.1%, for EpCAM in 17.2%, for FRα in 22.4%, and for αvβ6 in 15.5% of the cases. Moreover, CEA showed the highest combined sensitivity (65.0%) and specificity (75.0%) for the detection of an HGD‐T1CRC component in colorectal polyps.
Conclusion
Of the tested targets, CEA appears the most suitable to specifically detect HGD and T1 cancer foci in colorectal polyps. An in vivo study using tumor‐targeted fluorescence‐guided endoscopy should confirm these findings.
Keywords: advance, biomarkers, colorectal cancer, colorectal polyps, CRC, dysplasia, endoscopy, fluorescence, resection, target
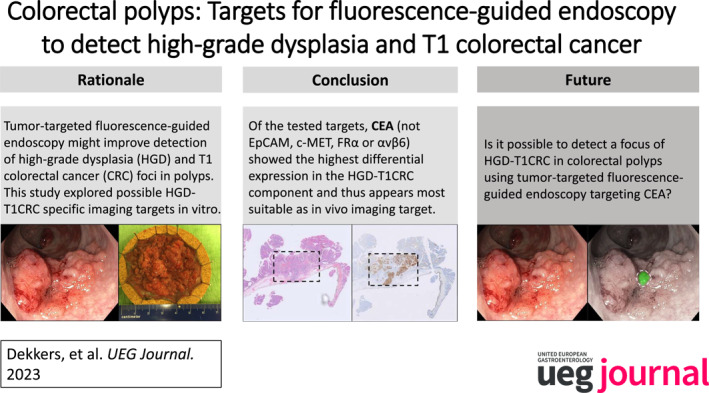
Key summary.
Summarize the established knowledge on this subject
To determine the preferred local resection technique for colorectal polyps, it is crucial to estimate the risk of high‐grade dysplasia (HGD) or early stage colorectal cancer (T1CRC).
The accuracy of optical diagnosis is not optimal, especially in larger polyps.
Tumor‐targeted fluorescence‐guided endoscopy might help to improve the recognition of a focus of HGD or T1CRC in colorectal polyps.
The most suitable imaging target for specifically detecting a focus of HGD or T1CRC in colorectal polyps is currently unknown.
What are the significant and/or new findings of this study?
It is feasible to detect HGD and T1CRC foci in colorectal polyps in vitro by staining for tumor‐specific targets.
Of the tested targets, carcinoembryonic antigen (CEA) most frequently showed differential expression in the HGD and T1CRC components compared to surrounding polyp tissue with low‐grade dysplasia.
An in vivo study is needed to confirm CEA as suitable target to specifically detect HGD or T1CRC foci in colorectal polyps by fluorescence‐guided endoscopy.
INTRODUCTION
Since the introduction of population‐based screening programs, a growing number of large colorectal polyps have been detected. 1 These large polyps can often be removed by local resections. 2 , 3 To determine the preferred local resection technique, it is crucial to estimate the risk of high‐grade dysplasia (HGD) or early stage T1 colorectal cancer (T1CRC). Preferably, polyps suspected to harbor a focus of HGD or T1CRC are removed en bloc to facilitate complete histological assessment, after which the need for additional treatment is determined. 4 In contrast, incorrect recognition of a focus of HGD or T1CRC may lead to inappropriate treatment (i.e. piecemeal resection) and the need for oncological surgery, thereby unnecessarily exposing patients to the risk of surgical morbidity and mortality. Although the reported percentages vary greatly, it is clear that there is room for improvement in the optical diagnosis of T1CRCs. Among experts, the rate of unrecognized T1CRCs is still 13%–22%, 5 , 6 whereas among endoscopists at the community level, the rate of misclassified T1CRCs can increase up to 81%. 7 Unfortunately, the additional value of imaging modalities such as endoscopic ultrasound or magnetic resonance imaging seems limited. Tumor‐targeted fluorescence optical imaging (FOI) might help to improve the recognition of a focus of HGD or T1CRC in colorectal polyps during endoscopic assessment, possibly aiding the process of decision‐making for the preferred local resection technique.
Near‐infrared FOI is a promising technique that combines the administration of a targeted fluorescent contrast agent with the use of Near‐infrared light. It allows for real‐time optical imaging by selectively highlighting cells that express certain molecular targets. 8 In the surgical field, tumor‐targeted FOI has been applied for different aspects of CRC, 8 including intraoperative detection and demarcation, 9 and intraoperative imaging of metastases. 10 In the endoscopic field, FOI has been applied to aid polyp detection 11 and to evaluate neoadjuvant treatment response in locally advanced rectal cancer. 12 Fluorescence‐guided endoscopy enables intraluminal visualization of polyps based on specific biomolecular features by using fluorescently labeled molecular probes that bind to specific molecular targets for which a tracer is administered prior to imaging. 13 These fluorescent‐targeting tracers can be administered intravenously, orally, or as spray dyes. By adding a layer of information to the conventional endoscopic assessment of polyps, this strategy can potentially improve the accuracy of optical diagnosis and thereby improve real‐time clinical decision‐making for the preferred local resection techniques of larger polyps. To the best of our knowledge, no study has focused on the ability of tumor‐targeted FOI to detect foci of HGD or T1CRC in colorectal polyps. Before embarking on a clinical study, examining which biomarker is most suitable as a FOI tumor target is necessary.
The target selection for imaging purposes depends on different characteristics, including the differential expression in the target tissue compared to normal tissue. 14 Enhanced protein expression in the target tissue and low or even absent expression in normal tissue are prerequisites. T1CRCs often reside in polyps that consist of several stages of dysplasia. A suitable target should be able to distinguish a focus of HGD or T1CRC from the surrounding LGD component of a polyp. Promising targets in CRC detection, with available fluorescence targeting probes, include carcinoembryonic antigen‐related adhesion molecule 5 (CEACAM5, from here on to be referred to as CEA), c‐mesenchymal‐epithelial transition factor (c‐MET), epithelial cell adhesion molecule (EpCAM), folate receptor alpha (FRα) and integrin αvβ6. Carcinoembryonic antigen is a membrane‐bound glycoprotein with known expression in the majority of CRCs and little expression in normal mucosa. 15 c‐MET is the membrane‐bound hepatocyte growth factor receptor involved in proliferation and invasion. C‐MET overexpression has been demonstrated in the sequence of colorectal adenoma‐carcinoma sequence as an early event. 16 , 17 EpCAM is a transmembrane glycoprotein involved in cell‐cell interactions and cell‐stroma adhesions that is generally overexpressed in epithelial malignancies such as colorectal cancer. 18 FRα is a membrane‐bound folic acid‐binding and transporting protein, with higher expression in CRCs than in normal mucosa or adenoma. 19 αvβ6 is an integrin subtype that is expressed only in epithelial cells, with significantly increased expression in epithelial tumors. 20 Although several studies have reported the enhanced expression of these markers in CRC, neither have studied the differential expression between a component of HGD or T1CRC and the surrounding component of LGD in colorectal polyps.
We aimed to select the most HGD‐T1CRC specific fluorescence‐guided endoscopy target for an in vivo pilot study.
MATERIALS AND METHODS
Population
Formalin‐fixed paraffin‐embedded tissue blocks from patients who underwent en bloc endoscopic submucosal dissection (ESD) (between February 2013 and November 2019) in the Leiden University Medical Center for lateral spreading polyps harboring a focus of T1CRCs or HGD located in the rectum or sigmoid were retrieved from the pathology department. To increase the sample size, we also included a random sample of 10 FFPE blocks from patients who underwent en bloc endoscopic mucosal resection (EMR) for non‐granular T1CRCs in the rectum or sigmoid (between February 2013 and November 2019). Prior to inclusion, slides were reexamined by a pathologist specialized in gastro‐intestinal pathology (S.C.) and re‐staged accordingly. Patients with an insufficient amount of tissue were excluded. Ethical approval was obtained from the Medical Ethical Committee of the Leiden University Medical Center, and the requirement for obtaining informed consent was waived (reference: B20.016, 11‐06‐2020). The study protocol conforms to the ethical guidelines of the 1975 Declaration of Helsinki as reflected in a priori approval by the institution's human research committee.
Clinical variables
Demographic patient characteristics (sex, age) and clinical data (polyp morphology, procedure‐related parameters, histology parameters) were collected from electronic medical records. En bloc resection was defined as macroscopic removal of the lesion in a single piece. High‐grade dysplasia was defined as architectural abnormality and severe cytologic atypia without invasion through the muscularis mucosae. T1 colorectal cancer was defined as tumors with tumor invasion through the muscularis mucosae and into, but not beyond, the submucosa.
Antibodies and immunohistochemistry
Based on hematoxylin‐eosin (HE)‐stained slides, a pathologist specialized in gastro‐intestinal pathology (S.C.) selected a representative formalin‐fixed paraffin‐embedded tissue block for each patient, containing as many stages of dysplasia (normal, LGD, HGD, and T1CRC) as possible. Selected tissue blocks were sectioned (4 μm) and mounted on adhesive slides. Sections were deparaffinized with xylene for 15 min, rehydrated in decreasing ethanol concentrations and then rinsed in demineralized water. Subsequently, endogenous peroxidase was blocked using 0.3% hydrogen peroxide (Merck Millipore, Netherlands) in demineralized water for 20 min. Specifications regarding antigen retrieval and antibodies are provided in supplementary Table S1. Afterward, the slides were rinsed in phosphate‐buffered saline (PBS, pH7.4), and stained with the appropriate secondary antibody (EnVision anti‐mouse or anti‐rabbit horseradish peroxidase) (Dako) for 30 min, followed by another washing step. Immunoreactions were visualized with diaminobenzidine substrate buffer (Dako) after 10 min, counterstained using Mayer's hematoxylin solution (Sigma‐Aldrich, USA), and dehydrated at 37°C before being mounted with Pertex (Leica Microsystems, Germany). Negative (PBS) and conjugate control (only secondary antibody) were included to rule out nonspecific staining.
To ensure that the different stages of dysplasia were the same throughout all sectioned slides of one block, the first and last slides from each block were stained with HE and examined by a pathologist specialized in gastrointestinal pathology (S.C.).
Scoring method
All stained slides were digitally scanned (InstelliSite Ultra‐Fast Scanner, Philips). HE‐slides of each case were utilized to determine one clear region of each present stage of dysplasia (S.C. and N.D.). These regions were then marked on the digitally scanned HE slide. Subsequently, the same regions were marked in the remaining slides of that case that were stained with study markers (N.D.). The marking process for one case is shown in supplementary Figure S1. The target expression in all stages of dysplasia was quantified using the immunoreactive score (IRS). The IRS was calculated by multiplying the positive cell proportions (PS) and staining intensity score as previously described. 21 PS represented the percentage of positively stained cells and ranged between 0 and 4 (0 = no positive cells; 1 = <10% positive cells; 2 = 10–50%, 3 = 51–80%, 4 = >80%). Intensity score represented staining intensity and ranged between 0 and 3 (0 = no color reaction; 1 = mild reaction; 2 = moderate reaction; 3 = intense reaction). The total IRS was a range between 0 and 12 and was further subdivided into subgroups (0–1 = negative, 2–3 = mild, 4–8 = moderate, 9–12 = strongly positive). Three observers independently evaluated the marker expression (N.D., J.B., and J.H.). All cases with disagreement regarding the IRS subgroup were discussed until a consensus was reached. The average of the individual scores within the same subgroup resulted in the definitive IRS.
Statistical analyses
Statistical analyses were performed using IBM SPSS version 24.0 (Chicago, USA) and GraphPad Prism 6 (La Jolla, CA, USA). The differential expression of each biomarker was studied by subtracting the expression scores of the LGD or normal colon component from the expression scores of the adjacent HGD‐T1CRC component from the same slide. Sensitivities and specificities of HGD‐T1CRC detection were calculated from the mean staining scores by receiver operating characteristic (ROC) curves. In the two markers that showed the greatest differential expression, the influence of morphological polyp characteristics on the occurrence of negative expression in the HGD‐T1CRC component was explored using the chi‐squared test. Mean IRS for different stages of dysplasia were compared using the Wilcoxon rank test. A p‐value ≤0.05 was considered statistically significant.
RESULTS
In total, tissue blocks of 39 T1CRC patients and 21 patients with HGD were included (Figure 1). A component of normal colon tissue was present in all cases, but due to the small size of this component, it was deemed insufficient for scoring in 3/60 cases. In two other cases, no distinct LGD component could be identified. For these 5 cases, components of the other stages of dysplasia were included in the results.
FIGURE 1.
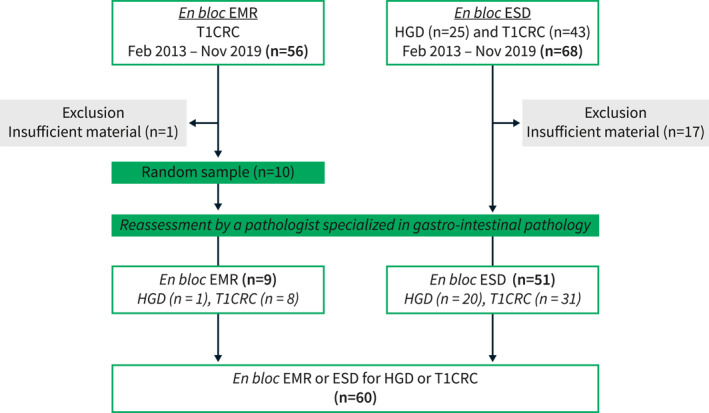
Flowchart of patient selection. CRC, colorectal cancer; EMR, endoscopic mucosal resection; ESD, endoscopic submucosal dissection; HGD, high‐grade dysplasia.
Patient and polyp characteristics are shown in Table 1. The overall median polyp size was 40 mm (range 8–100). The median polyp size was 15 mm (range 8–20) in the en bloc EMR subgroup and 40 mm (range 14–100) in the ESD subgroup. Macroscopic polyp morphology was flat elevated in 24 (40%) and sessile in 36 (60%). Polyps were mainly located in the rectum or rectosigmoid.
TABLE 1.
Clinical‐pathological characteristics of the study cohort.
| Number of cases n = 60 (%) | |
|---|---|
| Patient characteristics | |
| Sex, male | 44 (73.3) |
| Age, years, median (range) | 65 (35–84) |
| Treatment | |
| ESD | 51 (85.0) |
| En bloc EMR | 9 (15.0) |
| Polyp characteristics | |
| Location | |
| Sigmoid | 11 (18.3) |
| Rectosigmoid | 10 (16.7) |
| Rectum | 39 (65.0) |
| Diameter polyp, mm, median (range) | 40 (8–100) |
| Gross morphology | |
| Flat elevated | 24 (40.0) |
| Sessile | 36 (60.0) |
| Paris classification | |
| Is | 29 (48.3) |
| 0‐IIa | 5 (8.3) |
| 0‐IIa + Is | 18 (30.0) |
| 0‐IIa + c | 8 (13.3) |
| Granularity | |
| Granular | 20 (33.3) |
| Non‐granular | 40 (66.7) |
| Maximal degree of dysplasia | |
| HGD | 21 (35.0) |
| T1CRC | 39 (65.0) |
| Adenoma component (n = 42) | |
| Tubular | 12 (20.0) |
| Villous | 4 (6.7) |
| Tubulovillous | 25 (41.7) |
| Serrated | 1 (1.7) |
Note: Values are n (%) unless otherwise defined.
Abbreviations: CRC, colorectal cancer; EMR, endoscopic mucosal resection; ESD, endoscopic submucosal dissection; HGD, high‐grade dysplasia; LST, lateral spreading tumor.
Expression of markers in different stages of dysplasia
Positive cell proportions and intensity scores varied widely for all markers throughout the cohort in normal, LGD, HGD and T1CRC tissues. Figure 2 shows all individual staining scores (IRS) in normal, LGD and HGD or T1CRC for each target; these scores are independently arranged in ascending order per target to illustrate the distributions across the cohort. The mean IRS of each target in the different stages of dysplasia is shown in Table 2.
FIGURE 2.
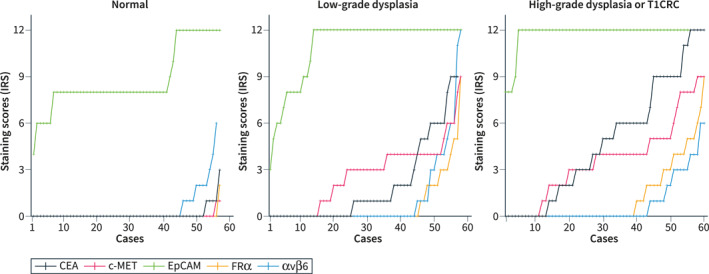
Staining scores of CEA, c‐MET, EpCAM, FRα, and αvβ6 in normal colorectal tissue, low‐grade dysplasia (LGD) and high‐grade dysplasia (HGD) or T1 colorectal cancer (T1CRC) were expressed as immunoreactive scores. The total immunoreactive scores were independently arranged in ascending order to demonstrate the distributions across our cohort. CEA, carcinoembryonic antigen; c‐MET, c‐mesenchymal‐epithelial transition factor; CRC, colorectal cancer; EpCAM, epithelial cell adhesion molecule; FRα, folate receptor alpha; IRS, immunoreactive score.
TABLE 2.
The mean immunoreactive score (IRS) for the component of normal tissue, low‐grade dysplasia (LGD), high‐grade dysplasia (HGD), and T1 colorectal cancer (T1CRC) (minimum 0, maximum 12).
| Target | Normal mean IRS (n = 57) | LGD mean IRS (n = 58) | HGD‐T1CRC mean IRS (n = 60) | p‐value normal versus HGD‐T1CRC | p‐value LGD versus HGD‐T1CRC |
|---|---|---|---|---|---|
| CEA | 0.08 | 1.83 a | 4.78 | <0.001 | <0.001 |
| c‐MET | 0.02 | 2.64 | 3.58 | <0.001 | 0.003 |
| EpCAM | 8.79 | 10.95 | 11.75 | <0.001 | 0.011 |
| FRα | 0.04 | 0.70 | 1.23 | 0.001 | 0.051 |
| αvβ6 | 0.42 a | 1.01 | 0.76 | 0.075 | 0.930 |
Abbreviations: CEA, carcinoembryonic antigen; c‐MET, c‐mesenchymal‐epithelial transition factor; EpCAM, epithelial cell adhesion molecule; FRα, folate receptor alpha; IRS, immunoreactive score.
Data of one case was missing due to a broken slide on which the IRS of that component could not be assessed properly.
If the HGD or T1CRC component showed positive expression (i.e. staining score >1), CEA and FRα were predominantly expressed on the apical membrane of the HGD‐T1CRC component, while c‐MET, EpCAM, and αvβ6 showed a more membranous, circumferential staining pattern in the HGD‐T1CRC components. Figure 3 shows the positive expression pattern of the different targets; for each target, the most representative case of positive expression in the HGD‐T1CRC component was selected. An example of the staining pattern in the entire polyp of all targets in the same case of T1CRC is shown in Figure 4.
FIGURE 3.
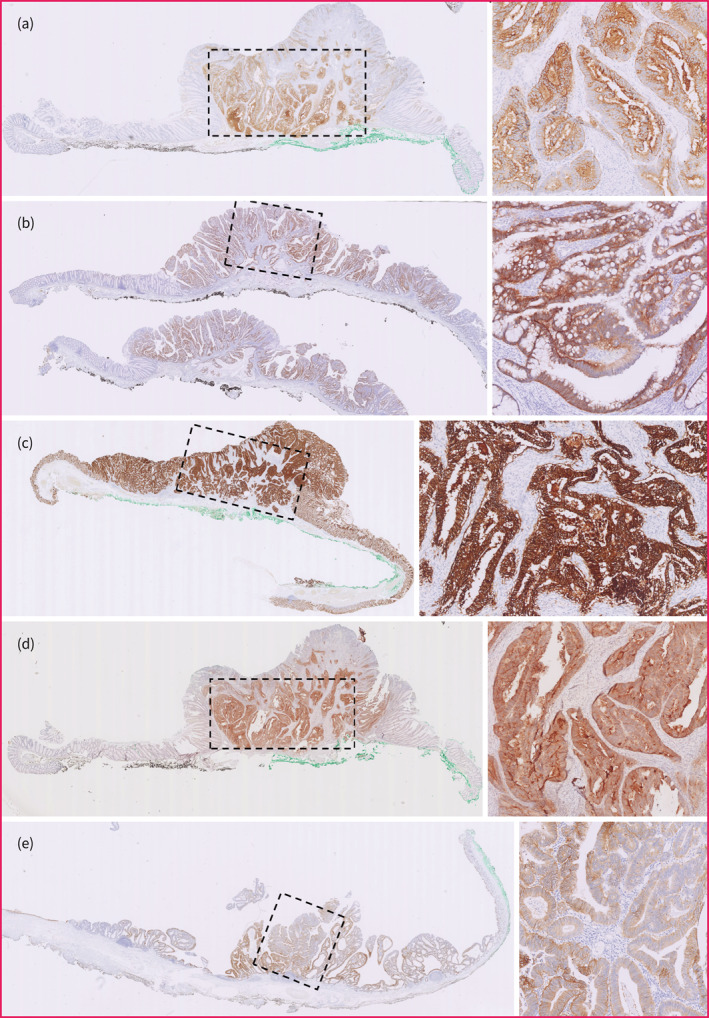
Positive staining pattern of all targets in the high‐grade dysplasia (HGD) or T1 colorectal cancer (T1CRC) component. For each target, an illustrative case was selected with positive expression (i.e. staining score >1) in the HGD‐T1CRC component. The region enclosed by the rectangle with dashed line consists of HGD or T1CRC. An overview image (left) and enlargement of the HGD‐T1CRC region (right) are provided for each target. (a) CEA expression and (b) c‐MET expression. (c) EpCAM expression. (d) FRα expression. (e) αvβ6 expression. CEA, carcinoembryonic antigen; c‐MET, c‐mesenchymal‐epithelial transition factor; EpCAM, epithelial cell adhesion molecule; FRα, folate receptor.
FIGURE 4.
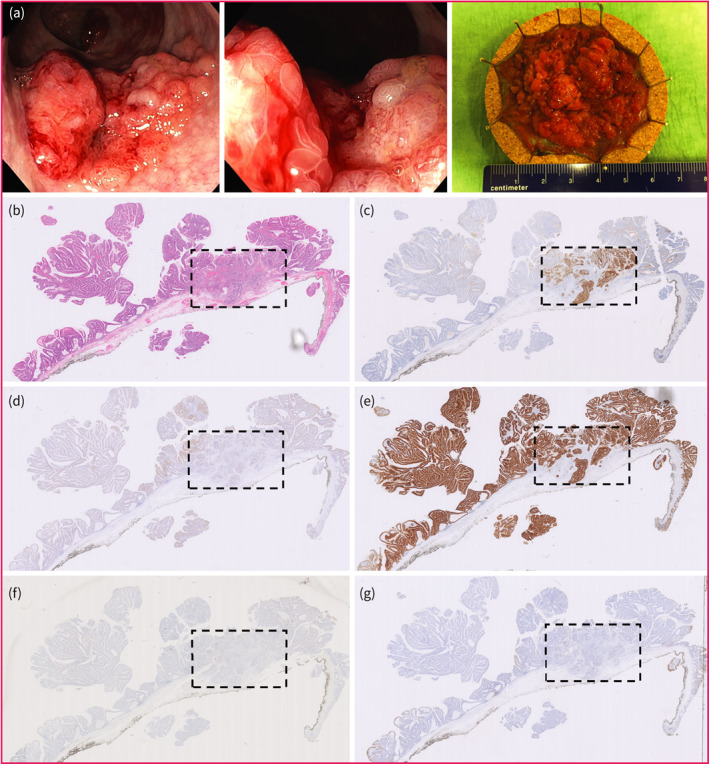
Overall staining pattern of all targets in the same case of T1 colorectal cancer (T1CRC). The region enclosed by the rectangle with dashed line consists of HGD‐T1CRC. (a) Endoscopic images and resection specimen after endoscopic submucosal dissection. (b) HE slide. (c) CEA expression. (d) c‐MET expression. (e) EpCAM expression. (f) FRα expression. (g) αvβ6 expression. HE hematoxylin‐eosin. CEA, carcinoembryonic antigen; c‐MET, c‐mesenchymal‐epithelial transition factor; EpCAM, epithelial cell adhesion molecule; FRα, folate receptor.
Expression of markers in normal tissues
Carcinoembryonic antigen expression was negative in 56/57 (98.2%). C‐MET expression was negative in all cases. Epithelial cell adhesion molecule expression was positive in all cases, showing moderate (41/57, 71.9%) to strong (16/57, 28.1%) expression. Folate receptor alpha expression was negative in 56/57 (98.2%). αvβ6 expression was negative in 49/56 (87.5%).
Expression of markers in low‐grade dysplasia
Carcinoembryonic antigen expression was negative in 37/57 (64.9%). C‐MET expression was negative in 19/58 (32.8%), most of cases showed a moderate expression (22/58, 37.9%). Epithelial cell adhesion molecule expression was positive in all cases, showing moderate (10/58, 17.2%) to strong (48/58, 82.8%) expression. Folate receptor alpha expression was negative in 47/58 (81.0%). αvβ6 expression was negative in 48/58 (82.8%).
Expression of markers in high‐grade dysplasia or T1 colorectal cancer
Carcinoembryonic antigen expression was positive in 44/60 (73.3%), showing a strong expression in 16/60 (26.7%). C‐MET expression was positive in 47/60 (78.3%), showing a strong expression in 3/60 (5%). Epithelial cell adhesion molecule expression was positive in all cases, showing a strong expression in 57/60 (95%). Folate receptor alpha expression was positive in 18/60 (30.0%), strong expression was observed in 1/60 (1.7%). αvβ6 expression was positive in 12/60 (20.0%), but strong expression was not observed.
Differential HGD‐T1CRC expression compared to normal
The staining intensity was higher in the HGD‐T1CRC component than the adjacent normal component for CEA in 46/57 (80.7%), c‐MET in 46/57 (80.7%), EpCAM in 40/57 (70.2%), FRα in 20/57 (35.1%), and αvβ6 in 14/56 (25.0%) (Figure 5). Carcinoembryonic antigen showed the greatest increase in IRS. If there was an increase, the HGD‐T1CRC component scored on average 6.0 points higher (95% CI 5.0–7.0) than the adjacent normal component. For c‐MET this was 4.4 (95% CI 3.8–5.1) (Table 3).
FIGURE 5.
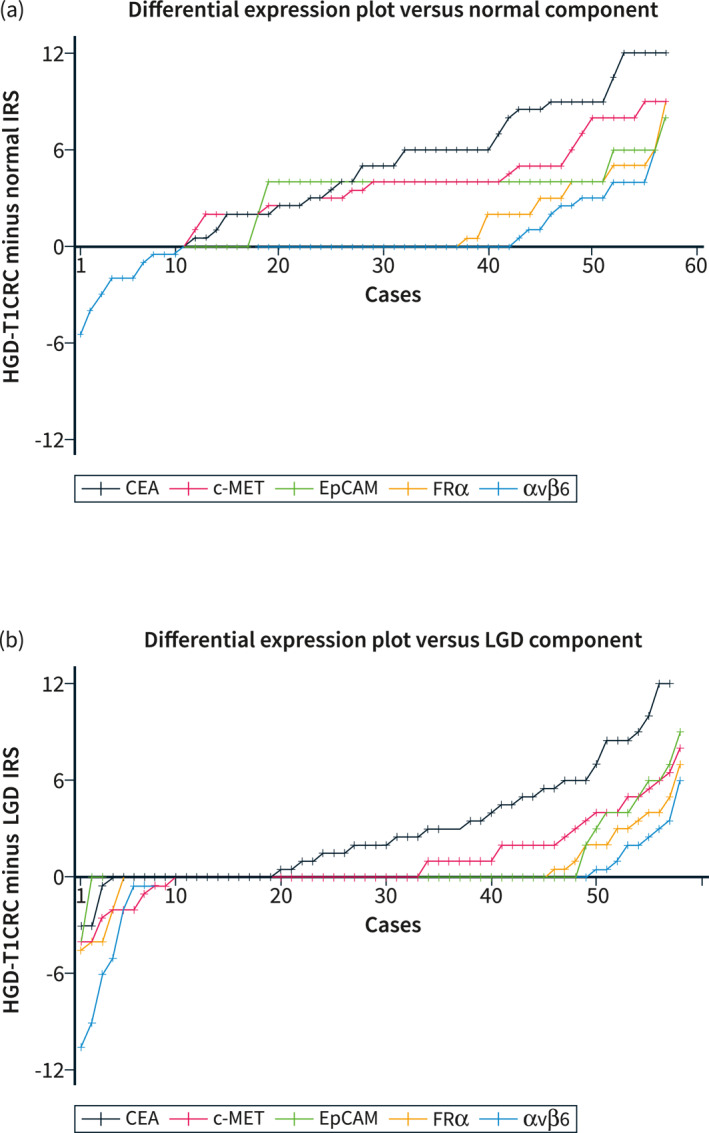
Differential expression plots. Differential expression scores were calculated by subtracting the IRS of the normal or low‐grade dysplasia (LGD) component from the IRS of the HGD‐T1CRC component. Differential expression scores were independently arranged and connected in ascending order to demonstrate the distributions across the cohort. (a) shows the differential expression plot for HGD‐T1CRC components compared to surrounding normal colorectal tissue. (b) shows the differential expression plot for HGD‐T1CRC components compared to surrounding components of LGD. CEA, carcinoembryonic antigen; c‐MET, c‐mesenchymal‐epithelial transition factor; CRC, colorectal cancer; EpCAM, epithelial cell adhesion molecule; FRα, folate receptor alpha; IRS, immunoreactive score; LGD, low‐grade dysplasia.
TABLE 3.
The magnitude of the increase in the immunoreactive score (IRS) between the HGD or T1 colorectal cancer (T1CRC) component and the normal or LGD component if an increase was present, expressed as mean and 95% confidence interval.
| Target | Increase in IRS between the HGD‐T1CRC and normal component | Increase in IRS between the HGD‐T1CRC and LGD component |
|---|---|---|
| Mean (95%CI) | Mean (95%CI) | |
| CEA | 6.0 (5.0–7.0), n = 46 | 4.5 (3.4–5.5), n = 38 |
| c‐MET | 4.4 (3.8–5.1), n = 46 | 3.0 (2.2–3.9), n = 25 |
| EpCAM | 4.3 (4.0–4.6), n = 40 | 5.0 (3.5–6.5), n = 10 |
| FRα | 3.6 (2.6–4.5), n = 20 | 2.9 (1.8–4.0), n = 13 |
| αvβ6 | 2.9 (2.0–3.7), n = 14 | 2.3 (1.0–3.7), n = 9 |
Abbreviations: CEA, carcinoembryonic antigen; CI, confidence interval; c‐MET, c‐mesenchymal‐epithelial transition factor; CRC, colorectal cancer; EpCAM, epithelial cell adhesion molecule; FRα, folate receptor alpha; HGD, high‐grade dysplasia; IRS, immunoreactive score; LGD, low‐grade dysplasia.
Differential HGD‐T1CRC expression compared to low‐grade dysplasia
The staining intensity was higher in the HGD‐T1CRC component than the surrounding LGD component for CEA in 38/57 (66.7%), c‐MET in 25/58 (43.1%), EpCAM in 10/58 (17.2%), FRα in 13/58 (22.4%), and αvβ6 in 9/58 (15.5%) (Figure 5). For CEA, if there was an increase in IRS, HGD‐T1CRC components scored on average 4.5 points higher (95% CI 3.4–5.5) than adjacent LGD components. For c‐MET, this was 3.0 (95% CI 2.2–3.9) (Table 3).
Separate results for the HGD and T1CRC subgroups can be found in the supplementary results.
Specificity and sensitivity for HGD‐T1CRC detection
Varying the limit of detection, we examined what proportion of HGD‐T1CRC components would be visualized (sensitivity) and what proportion of LGD components would be visualized (specificity). A receiving operating characteristic (ROC) was plotted for each marker to select the optimal cut‐off scores (i.e. scores with the greatest combined sensitivity and specificity). Using these optimal cut‐off scores, sensitivity and specificity for detection of the HGD‐T1CRC component versus surrounding LGD were 65.0% and 75.0% for CEA (cut‐off >2.5), 55.0% and 60.3% for c‐MET (cut‐off >3.5), 93.3% and 22.4% for EpCAM (cut‐off >11), 16.7% and 93.1% for FRα (cut‐off >3.5), and 28.3% and 75.9% for αvβ6 (cut‐off <0.5). Supplementary Figure S2 shows the ROC curves for detection of the HGD‐T1 components compared to the normal and LGD components.
Correlation between carcinoembryonic antigen and c‐mesenchymal‐epithelial transition factor expression and morphological characteristics
For CEA and c‐MET, negative staining in the HGD or T1CRC component did not statistically differ between flat elevated and sessile polyps, granular and non‐granular polyps, and smaller or larger polyps (dichotomized, using 40 mm as cut‐off), all p > 0.05 (supplementary Table S2). Additional information regarding the cases with negative CEA staining in the HGD or T1CRC component is provided in supplementary results.
DISCUSSION
This study is the first to evaluate the suitability of CEA, c‐MET, EpCAM, FRα, and αvβ6 as possible targets to detect a focus of HGD or T1CRC in large colorectal polyps using tumor‐targeted fluorescence‐guided endoscopy. Our results indicate that CEA shows the most differential expression for the HGD‐T1CRC component of the tested markers. Therefore, CEA appears to be the most promising target for in vivo testing.
Carcinoembryonic antigen outperformed the other markers by showing the greatest differential HGD‐T1CRC expression, especially compared to the LGD component. In comparison to CEA, positive expression (i.e. Immunoreactive score >1) in the HGD‐T1CRC component was found more frequently for c‐MET (47/60, 78.3%). However, c‐MET lacked the degree of differential expression with LGD because the expression in the LGD component was also positive in a considerable amount of cases, which was in line with previous studies. C‐MET was even successfully used as an in vivo FOI target for polyps. 11 EpCAM showed a positive expression in the HGD‐T1CRC component most frequently of all tested biomarkers (60/60, 100%) but hardly showed any differential expression with the LGD components. The number of cases with a positive expression in the HGD‐T1CRC component for FRα (18/60, 30.0%) and αvβ6 (12/60, 20.0%) were too low to be considered as suitable targets.
For CEA, positive expression in the HGD‐T1CRC component was seen in 44/60 (73.3%) cases. This was slightly lower than the previously reported 87%–99% in studies that mainly included more advanced CRC stages. 15 , 22 Since not all HGD‐T1CRC components show positive expression for CEA, not all patients will benefit from tumor‐targeted FOI targeting CEA. It would be preferable to be able to select those patients who would. This study could not identify morphological polyp characteristics that were associated with negative tumor expression. However, it should be kept in mind that the current study may be underpowered to identify relevant factors. Moreover, serum CEA levels do not appear informative for predicting expression levels. 23 Additionally, screening CEA expression on pre‐operative biopsies does not appear to be a feasible selection strategy because, in accordance with the motive of this study, recognizing and thus being able to take biopsies from the HGD‐T1CRC component in larger polyps can be challenging. CEA's imperfect tumor expression rate may hamper its clinical implementation as HGD‐ and T1CRC‐specific FOI targets. However, the perfect target has yet to be discovered and CEA appears to be the most promising. Alternatively, a combination of two complementary targets could be considered. Based on our results, c‐MET and EpCAM could enhance the detection of HGD‐T1CRC versus normal tissue, but this does not contribute to better distinction between HGD‐T1CRC foci versus LGD components compared to single target CEA, which was the aim of this study.
Based on the results of this study, we are conducting a clinical pilot study to assess whether it is possible to specifically detect an HGD or T1CRC component in non‐pedunculated rectal polyps using SGM‐101, a fluorochrome‐labeled anti‐CEA monoclonal antibody. After intravenous administration of this fluorescent CEA‐targeting tracer, imaging will be performed using a fluorescence‐endoscope. For this clinical study, it should be taken into account that immunohistochemical studies can only partly mimic the in vivo situation where several other factors can potentially influence the performance. These factors include tissue penetration, background staining, immunological response and sensitivity of the NIR‐camera system. However, despite these challenges, the feasibility and safety of fluorescence‐labeled contrast agents targeting CEA for in vivo tumor imaging have already been shown. For example, SGM‐101 showed enhanced differentiation between normal and cancerous tissues in pancreatic cancer and CRC. 24 Additionally, its application during CRC surgery influenced clinical decision‐making. 9 A promising novel clinical application of CEA‐targeted fluorescent agents might be during endoscopic assessment of colorectal polyps where it could help to improve the recognition of HGD‐T1CRC foci and therefore aid the process of decision‐making for the preferred local resection technique.
Although the results are promising, the present study has some limitations. The main drawbacks are the relatively small number of cases and the use of semiquantitative immunohistochemistry to measure protein expression. Even though immunohistochemistry is routinely used, it frequently lacks standardization and therefore interpretation of staining patterns might be heterogeneous. Our study attempted to minimize this by using validated antibodies and a previously published scoring system. 21 Lastly, the biomarker panel only consisted of well‐established biomarkers with clinically available tracers to save time‐consuming steps in the cascade of developing new imaging tracers, such as safety trials. 25 By using this pragmatic approach, there is a possibility that the most suitable HGD‐T1CRC specific target is yet to be discovered and was not included in the panel of this study.
CONCLUSION
Of the tested targets, CEA appears the most suitable to specifically detect foci of HGD and T1CRC in colorectal polyps. An in vivo study using tumor‐targeted fluorescence‐guided endoscopy should confirm these findings.
CONFLICT OF INTEREST STATEMENT
Jurjen Boonstra is a consultant at Boston Scientific.
ETHICS APPROVAL
Ethical approval was obtained from the Medical Ethical Committee of the Leiden University Medical Center, and the requirement for obtaining informed consent was waived (reference: B20.016).
Supporting information
Supplementary Information S1
Supplementary Information S2
Figure S1
Figure S2
Figure S3
Figure S4
Figure S5
Figure S6
Figure S7
Table S1
Table S2
ACKNOWLEDGMENTS
The study was supported by a grant from the Dutch Digestive Diseases Foundation (Gastrostartfonds NVGE, reference no. 04–2020) and the European Commission under Marie SkłodowskaCurie Action award H2020‐MSCAITN‐2019 (Project number: 857894‐CAST).
Dekkers N, Zonoobi E, Dang H, Warmerdam MI, Crobach S, Langers AMJ, et al. Colorectal polyps: targets for fluorescence‐guided endoscopy to detect high‐grade dysplasia and T1 colorectal cancer. United European Gastroenterol J. 2023;11(3):282–92. 10.1002/ueg2.12375
Nik Dekkers and Elham Zonoobi shared the first authorship.
DATA AVAILABILITY STATEMENT
The data that support the findings of this study are available from the corresponding author upon reasonable request.
REFERENCES
- 1. Dekker E, Tanis PJ, Vleugels JLA, Kasi PM, Wallace MB. Colorectal cancer. Lancet. 2019;394(10207):1467–80. 10.1016/s0140-6736(19)32319-0 [DOI] [PubMed] [Google Scholar]
- 2. Dekkers N, Dang H, van der Kraan J, le Cessie S, Oldenburg PP, Schoones JW, et al. Risk of recurrence after local resection of T1 rectal cancer: a meta‐analysis with meta‐regression. Surg Endosc. 2022;36(12):9156–68. 10.1007/s00464-022-09396-3 [DOI] [PMC free article] [PubMed] [Google Scholar]
- 3. Dang H, Dekkers N, le Cessie S, van Hooft JE, van Leerdam ME, Oldenburg PP, et al. Risk and time pattern of recurrences after local endoscopic resection of T1 colorectal cancer: a meta‐analysis. Clin Gastroenterol Hepatol. 2022;20(2):e298–314. 10.1016/j.cgh.2020.11.032 [DOI] [PubMed] [Google Scholar]
- 4. Hashiguchi Y, Muro K, Saito Y, Ito Y, Ajioka Y, Hamaguchi T, et al. Japanese Society for Cancer of the Colon and Rectum (JSCCR) guidelines 2019 for the treatment of colorectal cancer. Int J Clin Oncol. 2020;25(1):1–42. 10.1007/s10147-019-01485-z [DOI] [PMC free article] [PubMed] [Google Scholar]
- 5. Backes Y, Schwartz MP, ter Borg F, Wolfhagen FHJ, Groen JN, de Vos tot Nederveen Cappel WH, et al. Multicentre prospective evaluation of real‐time optical diagnosis of T1 colorectal cancer in large non‐pedunculated colorectal polyps using narrow band imaging (the OPTICAL study). Gut. 2019;68(2):271–9, 10.1136/gutjnl-2017-314723 [DOI] [PubMed] [Google Scholar]
- 6. Barendse RM, Musters GD, de Graaf EJR, van den Broek FJC, Consten ECJ, Doornebosch PG, et al. Randomised controlled trial of transanal endoscopic microsurgery versus endoscopic mucosal resection for large rectal adenomas (TREND Study). Gut. 2018;67(5):837–46. 10.1136/gutjnl-2016-313101 [DOI] [PubMed] [Google Scholar]
- 7. Meulen LWT, van de Wetering AJP, Debeuf MPH, Mujagic Z, Masclee AAM. Optical diagnosis of T1 CRCs and treatment consequences in the Dutch CRC screening programme. Gut. 2020;69(11):2049–51. 10.1136/gutjnl-2019-320403 [DOI] [PubMed] [Google Scholar]
- 8. Galema HA, Meijer RPJ, Lauwerends LJ, Verhoef C, Burggraaf J, Vahrmeijer AL, et al. Fluorescence‐guided surgery in colorectal cancer; A review on clinical results and future perspectives. Eur J Surg Oncol. 2022;48(4):810–21. 10.1016/j.ejso.2021.10.005 [DOI] [PubMed] [Google Scholar]
- 9. Boogerd LSF, Hoogstins CES, Schaap DP, Kusters M, Handgraaf HJM, van der Valk MJM, et al. Safety and effectiveness of SGM‐101, a fluorescent antibody targeting carcinoembryonic antigen, for intraoperative detection of colorectal cancer: a dose‐escalation pilot study. Lancet Gastroenterol Hepatol. 2018;3(3):181–91. 10.1016/s2468-1253(17)30395-3 [DOI] [PubMed] [Google Scholar]
- 10. Meijer RPJ, de Valk KS, Deken MM, Boogerd LSF, Hoogstins CES, Bhairosingh SS, et al. Intraoperative detection of colorectal and pancreatic liver metastases using SGM‐101, a fluorescent antibody targeting CEA. Eur J Surg Oncol. 2021;47(3 Pt B):667–73. 10.1016/j.ejso.2020.10.034 [DOI] [PubMed] [Google Scholar]
- 11. Burggraaf J, Kamerling IMC, Gordon PB, Schrier L, de Kam ML, Kales AJ, et al. Detection of colorectal polyps in humans using an intravenously administered fluorescent peptide targeted against c‐Met. Nat Med. 2015;21(8):955–61. 10.1038/nm.3641 [DOI] [PubMed] [Google Scholar]
- 12. Tjalma JJJ, Koller M, Linssen MD, Hartmans E, de Jongh SJ, Jorritsma‐Smit A, et al. Quantitative fluorescence endoscopy: an innovative endoscopy approach to evaluate neoadjuvant treatment response in locally advanced rectal cancer. Gut. 2020;69(3):406–10. 10.1136/gutjnl-2019-319755 [DOI] [PMC free article] [PubMed] [Google Scholar]
- 13. Stibbe JA, Hoogland P, Achterberg FB, Holman DR, Sojwal RS, Burggraaf J, et al. Highlighting the undetectable ‐ fluorescence molecular imaging in gastrointestinal endoscopy. Mol Imag Biol. 2022;25(1):18–35. 10.1007/s11307-022-01741-1 [DOI] [PMC free article] [PubMed] [Google Scholar]
- 14. Boonstra MC, de Geus SW, Prevoo HA, Hawinkels LJ, van de Velde CJ, Kuppen PJ, et al. Selecting targets for tumor imaging: an overview of cancer‐associated membrane proteins. Biomark Cancer. 2016;8:119–33. 10.4137/bic.s38542 [DOI] [PMC free article] [PubMed] [Google Scholar]
- 15. Tiernan JP, Perry SL, Verghese ET, West NP, Yeluri S, Jayne DG, et al. Carcinoembryonic antigen is the preferred biomarker for in vivo colorectal cancer targeting. Br J Cancer. 2013;108(3):662–7. 10.1038/bjc.2012.605 [DOI] [PMC free article] [PubMed] [Google Scholar]
- 16. Blumenschein GR, Jr. , Mills GB, Gonzalez‐Angulo AM. Targeting the hepatocyte growth factor‐cMET axis in cancer therapy. J Clin Oncol. 2012;30(26):3287–96. 10.1200/jco.2011.40.3774 [DOI] [PMC free article] [PubMed] [Google Scholar]
- 17. Fearon ER, Vogelstein B. A genetic model for colorectal tumorigenesis. Cell. 1990;61(5):759–67. 10.1016/0092-8674(90)90186-i [DOI] [PubMed] [Google Scholar]
- 18. Trzpis M, McLaughlin PM, de Leij LM, Harmsen MC. Epithelial cell adhesion molecule: more than a carcinoma marker and adhesion molecule. Am J Pathol. 2007;171(2):386–95. 10.2353/ajpath.2007.070152 [DOI] [PMC free article] [PubMed] [Google Scholar]
- 19. Shia J, Klimstra DS, Nitzkorski JR, Low PS, Gonen M, Landmann R, et al. Immunohistochemical expression of folate receptor alpha in colorectal carcinoma: patterns and biological significance. Hum Pathol. 2008;39(4):498–505. 10.1016/j.humpath.2007.09.013 [DOI] [PubMed] [Google Scholar]
- 20. Bates RC, Bellovin DI, Brown C, Maynard E, Wu B, Kawakatsu H, et al. Transcriptional activation of integrin beta6 during the epithelial‐mesenchymal transition defines a novel prognostic indicator of aggressive colon carcinoma. J Clin Invest. 2005;115(2):339–47. 10.1172/jci200523183 [DOI] [PMC free article] [PubMed] [Google Scholar]
- 21. Fedchenko N, Reifenrath J. Different approaches for interpretation and reporting of immunohistochemistry analysis results in the bone tissue ‐ a review. Diagn Pathol. 2014;9(1):221. 10.1186/s13000-014-0221-9 [DOI] [PMC free article] [PubMed] [Google Scholar]
- 22. Boogerd LS, van der Valk MJ, Boonstra MC, Prevoo HA, Hilling DE, van de Velde CJ, et al. Biomarker expression in rectal cancer tissue before and after neoadjuvant therapy. OncoTargets Ther. 2018;11:1655–64. 10.2147/ott.s145473 [DOI] [PMC free article] [PubMed] [Google Scholar]
- 23. Boogerd LSF, Vuijk FA, Hoogstins CES, Handgraaf HJM, van der Valk MJM, Kuppen PJK, et al. Correlation between preoperative serum carcinoembryonic antigen levels and expression on pancreatic and rectal cancer tissue. Biomark Cancer. 2017;9:1179299x17710016. 10.1177/1179299x17710016 [DOI] [PMC free article] [PubMed] [Google Scholar]
- 24. Hoogstins CES, Boogerd LSF, Sibinga Mulder BG, Mieog JSD, Swijnenburg RJ, van de Velde CJH, et al. Image‐guided surgery in patients with pancreatic cancer: first results of a clinical trial using SGM‐101, a novel carcinoembryonic antigen‐targeting, near‐infrared fluorescent agent. Ann Surg Oncol. 2018;25(11):3350‐7, 10.1245/s10434-018-6655-7 [DOI] [PMC free article] [PubMed] [Google Scholar]
- 25. Mieog JSD, Achterberg FB, Zlitni A, Hutteman M, Burggraaf J, Swijnenburg R.‐J, et al. Fundamentals and developments in fluorescence‐guided cancer surgery. Nat Rev Clin Oncol. 2022;19(1):9–22. 10.1038/s41571-021-00548-3 [DOI] [PubMed] [Google Scholar]
Associated Data
This section collects any data citations, data availability statements, or supplementary materials included in this article.
Supplementary Materials
Supplementary Information S1
Supplementary Information S2
Figure S1
Figure S2
Figure S3
Figure S4
Figure S5
Figure S6
Figure S7
Table S1
Table S2
Data Availability Statement
The data that support the findings of this study are available from the corresponding author upon reasonable request.


