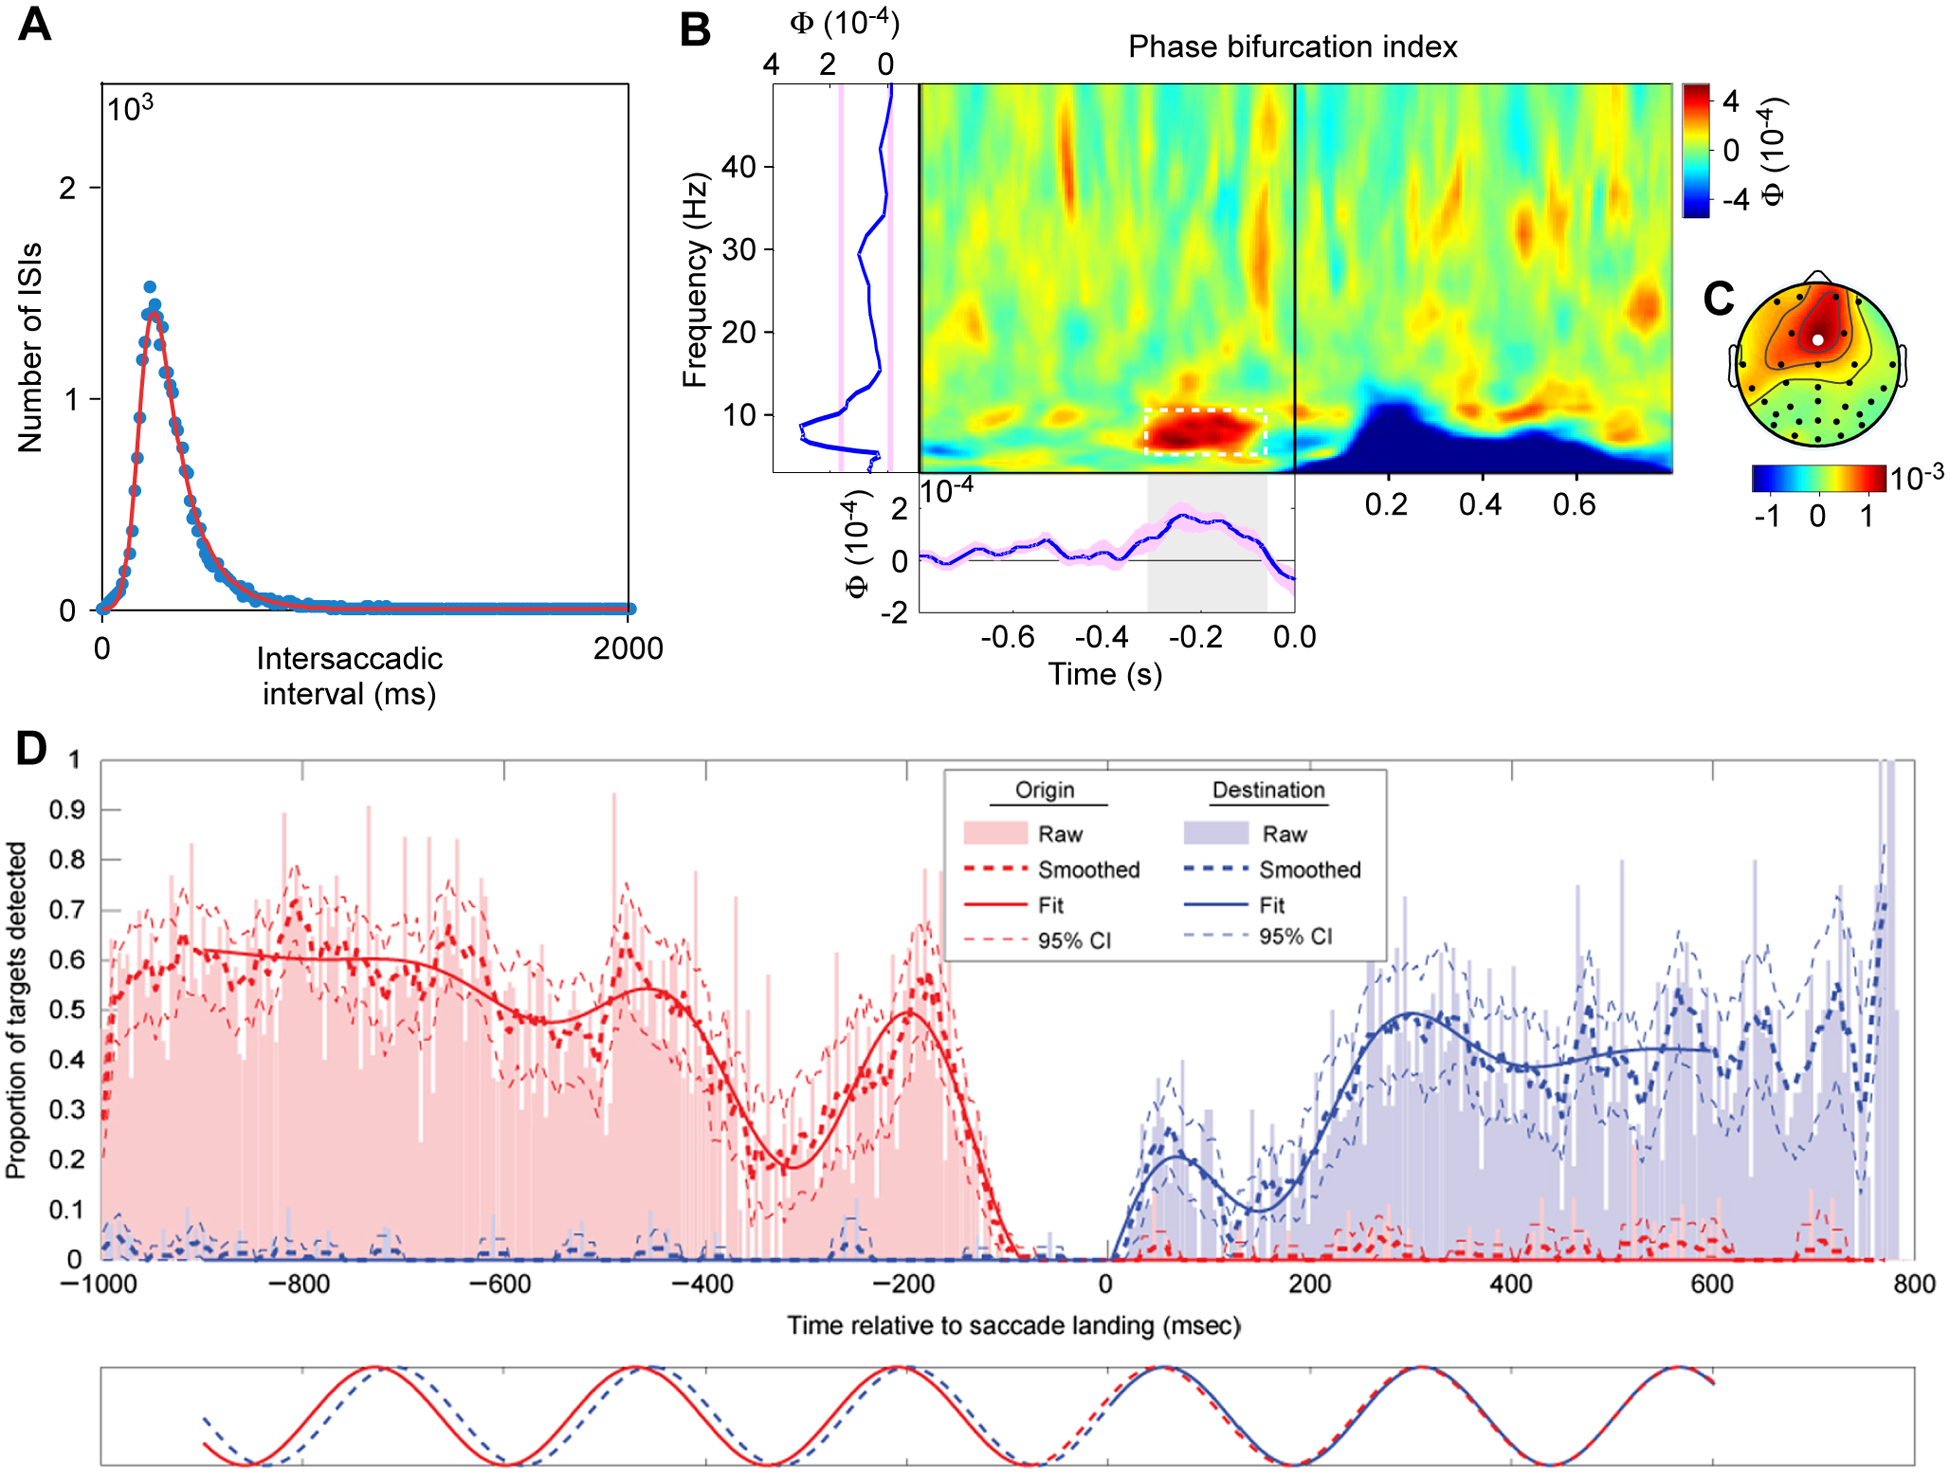
Figure 2. Theta rhythmicity in saccade behavior and detection performance.

(A) Distribution of intersaccadic intervals for regular saccades of human subjects exploring natural scenes. Adapted and modified from Otero-Millan et al.35.
(B) Phase bifurcation index as a function of time relative to stimulus onset (x-axis) and frequency (y-axis). Positive values indicate that EEG phase distributions are locked to different phase angles for hits and misses (e.g., in the pre-stimulus time range), while negative values indicate that only one condition is phase locked (e.g., phase locking exclusively for hits in the ERP time range). Left marginal: Average over time; bottom marginal: average over 6–10 Hz.
(C) Topography of phase bifurcation index averaged over 6 to 10 Hz and −300 to −50 ms preceding stimulus onset.
B,C adapted and modified from Busch et al.37 (Copyright 2009 Society for Neuroscience).
(D) Detection performance as function of time relative to saccade landing. Saccades go from an origin grating to a destination grating, and performance is measured and quantified independently for the origin (red) and destination (blue). Adapted and modified from Hogendoorn36.
