

Abstract
Background
Periodontal diseases and inflammatory bowel diseases (IBD, ulcerative colitis [UC] and Crohn disease [CD]) have been reported to present with increased salivary and gingival crevicular fluid (GCF) concentrations of cytokines. The aim of this study was to evaluate the salivary and GCF levels of TNF‐α, IL‐1β, IL‐10, and IL‐17A and their associations with the periodontal statuses of UC, CD, and non‐IBD patients, and to analyze the interrelationships among these cytokines, IBD conditions, and periodontal diseases.
Methods
This cross‐sectional study was performed with a total of 131 patients (62 women and 69 men, mean age 42.96±13.02 years). Patients were divided into three groups: UC, CD, and non‐IBD. Periodontal status was defined according to the 2017 World Workshop Disease Classification. Salivary and GCF cytokine levels were analyzed using ELISA.
Results
UC and CD patients diagnosed as having periodontitis and gingivitis presented with significantly higher levels of TNF‐α and lower levels of IL‐10 as compared with non‐IBD patients (p<0.05). UC patients diagnosed with periodontitis exhibited significantly higher scores of bleeding on probing (p = 0.011) and increased salivary and GCF IL‐1β levels as compared with CD patients (p = 0.005, and 0.012, respectively). Considering the active and remission status of IBD, salivary IL‐1β was found to be correlated with the parameters representing the severity of periodontal diseases in active UC and CD patients.
Conclusion
In the presence of periodontal diseases, UC and CD patients showed different expression levels of TNF‐α, IL‐1β, and IL‐10 in oral secretions as compared with non‐IBD patients.
Keywords: gingival crevicular fluid, periodontal diseases, cytokines, saliva, Crohn's disease, ulcerative colitis
1. INTRODUCTION
Inflammatory bowel diseases (IBD) represent one group of immune‐mediated inflammatory diseases categorized into two major forms: ulcerative colitis (UC) and Crohn disease (CD). IBD are chronic, idiopathic, and relapsing inflammatory disease of the gastrointestinal tract characterized by complex interactions among genetic susceptibility, environmental factors, microbiota, and host immune response. 1 , 2
It has been well‐documented that an increased prevalence of periodontal diseases has been found in patients with IBD as compared with systemically healthy patients. 3 , 4 , 5 , 6 It has also been reported that the prevalence was more pronounced in patients with UC than in patients with CD and more severe forms of periodontitis were observed in patients with UC as compared with patients with CD. 4 , 7 However, the pathological interactions between periodontitis and IBD have not been established.
Increased salivary and gingival crevicular fluid (GCF) concentrations of proinflammatory cytokines, such as interleukin (IL)‐1β, IL‐6, tumor necrosis factor (TNF)‐α, and IL‐18, as well as anti‐inflammatory cytokines such as IL‐4 and IL‐10, and matrix metalloproteinases (MMPs) including MMP‐8, have been shown in patients with UC and CD. 7 , 8 , 9 It is important to highlight that patients with IBD exhibit different dysregulations of immunity because they are distinct pathologies due to different involvements of the gastrointestinal track. 10 This difference could also be explained by T helper (Th) cell differentiation. UC has been shown to be a Th2 disease, whereas CD is considered to be a Th1 disease. 2 In a previous study, the levels of IL‐1β, immunoglobulin (Ig) A, and LL37 were found to be significantly higher in patients with UC and CD as compared with healthy controls. Additionally, the patients with UC demonstrated significantly higher salivary IL‐6, IL‐8, and MCP‐1 levels, whereas the level of TNF‐α was significantly higher in the patients with CD. 11
Th17 cell‐associated cytokines, such as TNF‐α, IL‐1β, and IL‐17A, have been shown to stimulate neutrophil infiltration in periodontitis and IBD, and to regulate the development of Th1/Th17 lymphocytes that aggravate inflammatory responses. 7 , 12 , 13 Therefore, the present study aimed to evaluate the salivary and GCF levels of TNF‐α, IL‐1β, IL‐10, and IL‐17A in association with periodontal status of patients with UC, CD, and non‐IBD, and to analyze the interrelationship among these cytokines, IBD conditions, and periodontal diseases.
2. MATERIALS AND METHODS
The present study was performed as a cross‐sectional study with a total of 131 patients; UC (n = 46, CD (n = 48), and non‐IBD (n = 37) (62 women and 69 men, mean age 42.96±13.02 years), who were outpatients at Faculty of Medicine, Department of Gastroenterology, Ankara University, from July 2018 to July 2019. Forty‐six patients were diagnosed with UC and 48 patients with CD. Patients with non‐IBD were recruited among patients who came for routine medical check‐ups, with the suspicion of IBD but not diagnosed with UC or CD. The diagnoses of UC and CD were established according to clinical, endoscopic, and histopathological analyses. According to their periodontal status, patients with UC, CD, and non‐IBD were diagnosed as having periodontitis, gingivitis, or healthy periodontium. The diagnosis of periodontitis was performed based on criteria that included probing depth (PD) ≥4 mm and clinical attachment loss of ≥3 mm in at least two non‐adjacent teeth, 14 whereas gingivitis was diagnosed by the presence of bleeding on probing (BOP) ≥10% and PD ≤3 mm.15 Healthy periodontium was identified as the presence of BOP ≤10% and PD ≤3 mm. 15 The current study protocol was approved by Clinical Investigation Ethics Committee of Ankara University's Faculty of Dentistry (ID 36290600/92). All participants gave their written informed consent. The study was conducted in accordance with the Helsinki Declaration of Principles.
The inclusion criteria for the patients were as follows: aged between 18 and 70 years, being cooperative, not having any uncontrolled chronic condition other than IBD, and presence of at least 20 teeth. The exclusion criteria comprised smoking >10 cigarettes/day, having active infectious diseases, having received periodontal treatment or antibiotic medication in the last 3 months, and being pregnant or lactating.
The Colitis Activity index (CAI) and the Harvey‒Bradshaw index (HBI) were used to identify disease activity in the patients with UC and CD, respectively. Disease activity was determined as CAI ≥5 for patients with UC, and HBI ≥10 for patients with CD. 16
2.1. Clinical examinations
A calibrated examiner performed a comprehensive periodontal examination from six different aspects of each tooth (mesiobuccal, buccal, distobuccal, mesiolingual, lingual, and distobuccal) using a Williams periodontal probe.* The following measurements were recorded: plaque index 17 (PI), gingival index 18 (GI), BOP, 19 PD, clinical attachment level (CAL), and gingival recession (GR). To perform the intra‐examiner calibration, PD and CAL were measured twice at six sites of each tooth within 24 h. Intra‐examiner agreement was at least 90% for both PD and CAL within 1 mm.
The presence of oral soft‐tissue lesions was also evaluated during the oral examinations.
2.2. Collection of saliva samples
Saliva sampling was performed before the periodontal examination and GCF collection. For each patient, unstimulated whole mixed saliva was collected using a modified method. 20 participants were asked to rinse her/his mouth with water for a minute, 10 min before the sampling. The saliva samples were collected into a sterile plastic container for 5 min. Samples were centrifuged for 10 min at 15,000x g at 4°C and the supernatant was frozen at ‐20°C until analyses.
2.3. Collection of gingival crevicular fluid (GCF)
GCF specimens were collected by standardized filter paper strips.† A notch was placed at 1 mm part of periopaper which was inserted subgingivally for 30 sec. Filter papers contaminated with blood and saliva were excluded from the evaluation. Two GCF samples were obtained from the deepest PD if a pathological pocket was present, otherwise, the samples were taken from the mesio‐buccal site of the first molar. Since all patients diagnosed with gingivitis were observed with BOP in molar teeth, samples were taken from the areas of inflammation. The strips were pooled in a sterile Eppendorf tube stored at ‐80°C. GCF samples were measured by using a Periotron 8000.‡ The values were measured using software.§ Before biochemical analyses, paper strips were placed in 300 μl of phosphate buffered saline solution containing 0.5% bovine serum albumin in Eppendorf tubes, and GCF was eluted from the strips by centrifugation for 6 min at 5000x g at 4°C.
2.4. Determination of TNF‐α, IL‐1β, IL‐10, and IL‐17A levels in GCF and saliva samples
The concentrations of IL‐17A and IL‐10 in GCF and saliva were measured with enzyme‐linked immunosorbent assay (ELISA) using human IL‐17A** and IL‐10†† ELISA kits. The absorbance was measured at a wavelength of 450 nm using a microplate reader. IL‐17A levels were expressed as ng/L and IL‐10 levels were expressed as pg/ml. The concentrations of IL‐1β and TNF‐α in GCF and saliva were measured with ELISA using human IL‐1⇇ and TNF‐᧧ ELISA kits. The absorbance was measured at a wavelength of 450 nm using a microplate reader. IL‐1β and TNF‐α levels were expressed as pg/ml.
An ELISA autoanalyzer*** was used during the analyses and absorbance measurements. The sensitivity of Human IL‐17A was 0.05 ng/L, detection range was 0.1 – 20 ng/L.; for Human IL‐10 sensitivity was 9.012 pg/ml, detection range was 10‐3000 pg/ml.; for Human IL‐1β the detection limit was 0.35 pg/ml and intra assay CV% was 2.3%, inter assay CV% was 4.9%; for Human TNF‐α the detection limit was 0.7 pg/ml and intra assay CV% was 6.6%, inter assay CV% was 4.5%. ELISA tests for each cytokine had been duplicated.
2.5. Statistical analysis
The sample size was determined as a total of at least 90 individuals, with at least 10 individuals in each group by using “Factorial Measurements Analysis of Variance” method, in which one of the factors was repeated in the factorial order. According to this analysis, the power was 81.19%.
SPS 25 statistical software††† was used to evaluate the data. Descriptive statistics (means, standard deviations, median values, minimum and maximum numbers, and percentiles) were given for categorical and continuous variables. Additionally, the homogeneity of the variances, was checked with Levene test. Normality assumption was checked with Shapiro‒Wilk test. As for the evaluation of the differences between two groups, Student t‐test was used when the parametric test prerequisites were met, and Mann‒Whitney U test was used when they were not met.
For multiple comparisons, one‐way analysis of variance and Tukey HSD test were used for a comparison of three or more groups, and when necessary, non‐parametric Kruskal‒Wallis and Bonferroni‒Dunn tests were performed. The relationship between two continuous variables was evaluated with Pearson correlation coefficient, and if the parametric test prerequisites were not met, Spearman correlation coefficient was used. Univariate logistic regression analysis was used to determine the risk factors. The levels p <0.05 and p <0.01 were considered to be statistically significant.
3. RESULTS
Forty‐one patients were with active IBD and 43 with remission. The mean age at the time of IBD diagnosis was 32.64±11.26 years. Depending on disease localization, patients with CD were diagnosed as ileal (n = 6), ileocecal (n = 14), colonic (n = 8), perianal (n = 2), ileocecal and colonic (n = 5), ileocecal and perianal (n = 5), or colonic and perianal (n = 4).
Among patients with UC, 16 patients were diagnosed with periodontitis (n = 7 Stage II, n = 6 Stage III, and n = 3 Stage IV); 16 patients had gingivitis; and 14 had healthy periodontium. Among patients with CD, 12 patients were diagnosed with periodontitis (n = 6 Stage II, n = 4 Stage III, and n = 2 Stage IV); 23 patients had gingivitis; and 13 had healthy periodontium. Among patients with non‐IBD, 12 patients were diagnosed with periodontitis (n = 5 Stage II, n = 4 Stage III, and n = 3 Stage IV); 12 patients had gingivitis; and 13 had healthy periodontium.
The demographic data, oral hygiene habits, frequency of dental visit, presence of oral lesions, periodontitis and IBD status, and characteristics are presented in Table 1. In patients with periodontitis, there were significant differences in smoking consumption (<10 cigarettes/day) and the presence of other systemic diseases among the patients with UC, CD, and non‐IBD (p = 0.018, P = 0.024). Besides, there was a significant difference seen in periodontitis group regarding medications used in IBD treatment among patients with UC and CD (p = 0.013). None of the patients in the UC group were smokers. All patients in the non‐IBD‐periodontitis group had other systemic diseases; (n = 4/66.66%) had diabetes mellitus; and (n = 2/33.33%) had hypertension. Furthermore, n = 2/20.0% of patients in the non‐IBD‐healthy periodontium group had hypertension. While none of the patients with CD‐periodontitis were taking immunomodulators, patients with UC periodontitis were detected as (n = 5/31.3%).
TABLE 1.
Relationships among IBD status (UC, CD, and non‐IBD), demographic, and other variables for patients with periodontal health status as periodontitis, gingivitis, and healthy periodontium
| Periodontitis | Gingivitis | Healthy periodontium | ||||||||||||||||||||
|---|---|---|---|---|---|---|---|---|---|---|---|---|---|---|---|---|---|---|---|---|---|---|
| UC | CD | non‐IBD | UC | CD | non‐IBD | UC | CD | non‐IBD | ||||||||||||||
| Variables | n | % | n | % | n | % | P value | n | % | n | % | n | % | P value | n | % | n | % | n | % | P value | |
| Sex | Male | 12 | 75.0 | 7 | 58.3 | 5 | 41.7 | 0.202 | 7 | 43.8 | 16 | 69.6 | 5 | 41.7 | 0.161a | 6 | 42.9 | 8 | 61.5 | 3 | 23.1 | 0.140a |
| Female | 4 | 25.0 | 5 | 41.7 | 7 | 58.3 | 9 | 56.2 | 7 | 30.4 | 7 | 58.3 | 8 | 57.1 | 5 | 38.5 | 10 | 76.9 | ||||
| Smoking | Yes | 0 | 0.00 | 4 | 33.3 | 5 | 41.7 | 0.018b* | 2 | 12.5 | 1 | 4.3 | 1 | 8.3 | 0.806b | 0 | 0.0 | 1 | 7.7 | 2 | 15.4 | 0.300b |
| No | 16 | 100.0 | 8 | 66.7 | 7 | 58.3 | 14 | 87.5 | 22 | 95.7 | 11 | 91.7 | 14 | 100.0 | 12 | 92.3 | 11 | 84.6 | ||||
| Dental visit | Yes | 4 | 25.0 | 1 | 8.3 | 5 | 41.7 | 0.169 | 6 | 37.5 | 9 | 39.1 | 3 | 25.0 | 0.691a | 4 | 28.6 | 5 | 38.5 | 7 | 53.8 | 0.404a |
| No | 12 | 75.0 | 11 | 91.7 | 7 | 58.3 | 10 | 62.5 | 14 | 60.9 | 9 | 75.0 | 10 | 71.4 | 8 | 61.5 | 6 | 46.2 | ||||
| Brushing habits | Yes | 10 | 62.5 | 10 | 83.3 | 9 | 75.0 | 0.462 | 15 | 93.8 | 19 | 82.6 | 10 | 83.3 | 0.666b | 12 | 85.7 | 12 | 92.3 | 13 | 100.0 | 0.761b |
| No | 6 | 37.5 | 2 | 16.7 | 3 | 25.0 | 1 | 6.2 | 4 | 17.4 | 2 | 16.7 | 2 | 14.3 | 1 | 7.7 | 0 | 0.0 | ||||
| Brushing frequency | Once/day | 4 | 40.0 | 5 | 50.0 | 3 | 33.3 | 0.622 | 9 | 60.0 | 10 | 52.6 | 6 | 60.0 | 0.591b | 2 | 16.7 | 8 | 66.7 | 2 | 16.7 | 0.010b* |
| Twice/day | 5 | 50.0 | 5 | 50.0 | 4 | 44.4 | 6 | 40.0 | 6 | 31.6 | 4 | 40.0 | 10 | 83.3 | 3 | 25.0 | 7 | 58.3 | ||||
| More than twice/day | 1 | 10.0 | 0 | 0.0 | 2 | 22.3 | 0 | 0.0 | 3 | 15.8 | 0 | 0.0 | 0 | 0.0 | 1 | 8.3 | 3 | 25.0 | ||||
| Interdental cleaning habits | Yes | 3 | 18.7 | 3 | 25.0 | 1 | 8.3 | 0.553 | 7 | 43.8 | 9 | 39.1 | 3 | 25.0 | 0.579a | 7 | 50.0 | 6 | 46.2 | 6 | 46.2 | 0.937a |
| No | 13 | 81.3 | 9 | 75.0 | 11 | 91.7 | 9 | 56.3 | 14 | 60.9 | 9 | 75.0 | 7 | 50.0 | 7 | 53.8 | 7 | 53.8 | ||||
| Oral lesion | Yes | 2 | 12.5 | 0 | 0.0 | 1 | 8.3 | 0.458 | 4 | 25.0 | 1 | 4.3 | 0 | 0.0 | 0.044b* | 2 | 14.3 | 5 | 38.5 | 0 | 0.0 | 0.033b* |
| No | 14 | 87.5 | 12 | 100.0 | 11 | 91.7 | 12 | 75.0 | 22 | 95.7 | 12 | 100.0 | 12 | 85.7 | 8 | 61.5 | 13 | 100.0 | ||||
| Other systemic diseases | Yes | 6 | 40.0 | 4 | 36.4 | 6 | 100.0 | 0.024b* | 2 | 20.0 | 2 | 18.2 | 0 | 0.0 | 0.789b | 4 | 40.0 | 2 | 25.0 | 2 | 20.0 | 0.592b |
| No | 9 | 60.0 | 7 | 63.6 | 0 | 0.0 | 8 | 80.0 | 9 | 81.8 | 2 | 100.0 | 6 | 60.0 | 6 | 75.0 | 8 | 80.0 | ||||
| IBD status | Active | 9 | 64.3 | 4 | 36.4 | – | – | 0.165a | 7 | 53.8 | 11 | 55.0 | – | – | 0.948a | 5 | 35.7 | 5 | 41.7 | – | – | 0.756a |
| Remission | 5 | 35.7 | 7 | 63.6 | – | – | 6 | 46.2 | 9 | 45.0 | – | – | 9 | 64.3 | 7 | 58.3 | – | – | ||||
| Time since IBD diagnosis | 0‐5 years | 3 | 27.2 | 4 | 36.4 | – | – | 1.000b | 3 | 33.3 | 9 | 47.4 | – | – | 0.874b | 6 | 46.2 | 8 | 80.0 | – | – | 0.244b |
| 6‐10 years | 4 | 36.4 | 3 | 27.2 | – | – | 3 | 33.3 | 6 | 31.6 | – | – | 3 | 23.1 | 0 | 0.0 | – | – | ||||
| 11 years and more | 4 | 36.4 | 4 | 36.4 | – | – | 3 | 33.3 | 4 | 21.0 | – | – | 4 | 30.7 | 2 | 20.0 | – | – | ||||
| Medications used in IBD treatment | TNF inhibitors | 3 | 18.7 | 7 | 58.4 | – | – | 0.013b* | 2 | 13.3 | 7 | 33.3 | – | – | 0.173b | 3 | 21.4 | 5 | 38.5 | – | – | 0.638b |
| Anti‐integrins | 2 | 12.5 | 4 | 33.3 | – | – | 2 | 13.3 | 3 | 14.3 | – | – | – | – | – | – | – | – | ||||
| Immunomodulators | 5 | 31.3 | 0 | 0.0 | – | – | 5 | 33.4 | 9 | 42.9 | – | – | 9 | 64.3 | 7 | 53.8 | – | – | ||||
| 5‐ASA | 6 | 37.5 | 1 | 8.3 | – | – | 6 | 40.0 | 2 | 9.5 | – | – | 2 | 14.3 | 1 | 7.7 | – | – | ||||
*p<0.05
a; Chi‐square test, b; Fisher exact test
Abbreviations: CD, Crohn disease; IBD, inflammatory bowel diseases; UC, ulcerative colitis.
Patients with gingivitis and healthy periodontium were detected with the presence of oral lesions among the groups (p<0.044, and p = 0.033, respectively). Besides, aphthous ulcer was the only lesion that detected among the participants. In patients with healthy periodontium, the highest frequency of brushing as once a day was seen in CD group as compared with the other groups (p = 0.010) (Table 1).
3.1. Comparisons according to the periodontal status of patients with UC and CD and patients with non‐IBD
3.1.1. Clinical periodontal parameters
For the patients with periodontitis, only the mean BOP values differed between UC and CD groups, depicting a higher value for UC group (p<0.05). While the mean BOP value was higher in UC group than in non‐IBD group, this value was observed to be lower in CD group as compared with non‐IBD group (p<0.05). Among the patients with gingivitis, the mean PD, CAL, and GR values were higher for non‐IBD group as compared with UC and CD groups (p<0.05). In healthy periodontium, the mean PD and CAL values differed between UC and non‐IBD groups and between CD and non‐IBD groups, indicating the highest mean value for non‐IBD group in all comparisons (p<0.05) (Table 2).
TABLE 2.
Comparison of clinical measurements (PI, GI, PD, BOP, CAL, and GR) in periodontitis, gingivitis, and healthy periodontium categories according to bowel health status
| Periodontal status | Measurement name |
UC (
|
CD (
|
non‐IBD (
|
P value | |||
|---|---|---|---|---|---|---|---|---|
| Periodontitis | PI | 0.89±0.60 | 0.60±0.46 | 0.67±0.83 | 0.249 | |||
| GI | 0.51±0.71 | 0.16±0.33 | 0.43±0.52 | 0.149 | ||||
| PD (mm) | 2.46±0.52 | 2.43±0.57 | 2.74±0.91 | 0.516 | ||||
| BOP % | 36.72±24.22 | 19.10±16.00 | 27.04±13.70 | 0.011ψ* | ||||
| CAL (mm) | 2.47±0.52 | 2.43±0.57 | 2.74±0.91 | 0.239 | ||||
| GR (mm) | 0.18±0.30 | 0.13±0.19 | 0.15±0.15 | 0.868 | ||||
| Gingivitis | PI | 0.56±0.55 | 0.57±0.40 | 0.48±0.40 | 0.674 | |||
| GI | 0.26±0.55 | 0.04 ± 0.08 | 0.14±0.25 | 0.969 | ||||
| PD (mm) | 1.79±0.26 | 1.74±0.30 | 2.14±0.20 | 0.001Δ** | ||||
| BOP % | 24.49±14.20 | 22.89±12.77 | 28.36±13.29 | 0.341 | ||||
| CAL (mm) | 1.85±0.30 | 1.75±0.31 | 2.29±0.39 | 0.001ψ** | ||||
| GR (mm) | 0.06±0.13a | 0.01±0.01 | 0.16±0.33 | 0.032ψ* | ||||
| Healthy periodontium | PI | 0.24±0.27 | 0.20±0.32 | 0.12±0.16 | 0.136 | |||
| GI | 0.08±0.20 | 0.01±0.01 | 0.00±0.01 | 0.821 | ||||
| PD (mm) | 1.58±0.27 | 1.74±0.35 | 1.99±0.31 | 0.009ψ** | ||||
| BOP % | 5.43±3.13 | 6.37±1.93 | 5.33±3.55 | 0.516 | ||||
| CAL (mm) | 1.65±0.31 | 1.76±0.34 | 2.05±0.32 | 0.008Δ** | ||||
| GR (mm) | 0.07±0.10 | 0.02±0.03 | 0.06±0.08 | 0.507 |
**p<0.01
*p<0.05
Δ One‐way analysis of variance (ANOVA).
ψ Kruskal‒Wallis test.
Abbreviations: BOP, bleeding on probing; CAL, clinical attachment level; CD, Crohn disease; GI, gingival index; GR, gingival recession; IBD, inflammatory bowel diseases; PI, plaque index; PD, probing depth; UC, ulcerative colitis.
3.1.2. Cytokine levels in saliva samples
In patients with periodontitis and gingivitis, the mean levels of TNF‐α were higher for UC group as compared with the other groups, whereas the mean IL‐1β and IL‐10 levels were found to be lower for CD group (p<0.05). For patients with periodontitis, the salivary IL‐10 levels were higher in non‐IBD group as compared with the other groups (p<0.05). Regarding healthy periodontium patients, no significant differences were found for the salivary biomarkers between the groups (Figure 1) (see Table S1 in online Journal of Periodontology).
FIGURE 1.
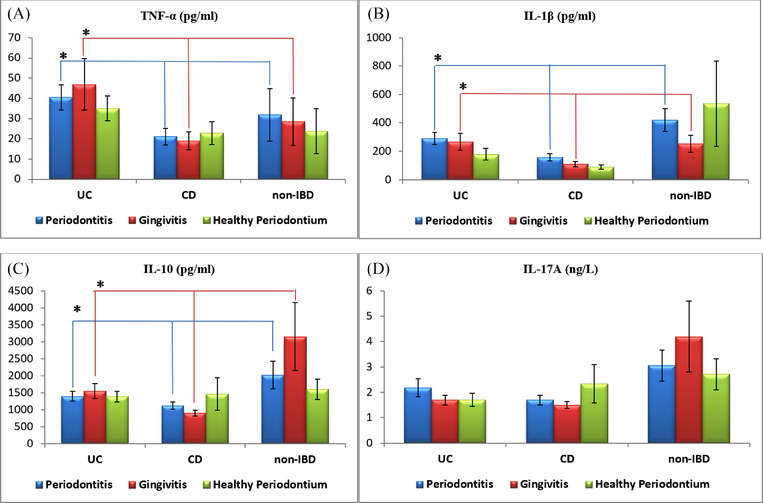
Graphical descriptions of salivary cytokine levels in relation to periodontal health status and bowel health status. (A) In patients with periodontitis and gingivitis, the mean levels of TNF‐α were significantly higher for the UC group of patients as compared with the other groups. (B) In patients with periodontitis and gingivitis, the mean levels of IL‐1β were significantly lower for the CD group of patients as compared with the other groups. (C) In patients with periodontitis and gingivitis, the mean levels of IL‐10 were significantly lower for the CD group of patients as compared with the other groups. (D) There was no significant difference detected in the mean level of IL‐17A between all groups of periodontal and bowel health statuses. CD, Crohn disease; IBD, inflammatory bowel diseases; IL, interleukin; TNF‐α, tumor necrosis factor‐alpha; UC, ulcerative colitis. *Statistically significant difference between groups, p <0.05, Kruskal‒Wallis H test
3.1.3. Cytokine levels in GCF samples
In patients with periodontitis and gingivitis, the mean levels of TNF‐α were found to be higher in CD group as compared with the other groups (p<0.05). For patients with periodontitis, the highest GCF levels of IL‐1β were found in UC group (p<0.05). The mean IL‐10 and IL‐17A levels were both higher in non‐IBD group as compared with UC and CD groups for patients with periodontitis and gingivitis (p<0.05). Regarding the patients with healthy periodontium, the mean IL‐10 level was lower in UC group (p<0.05) (Figure 2) (see Table S2 in online Journal of Periodontology).
FIGURE 2.
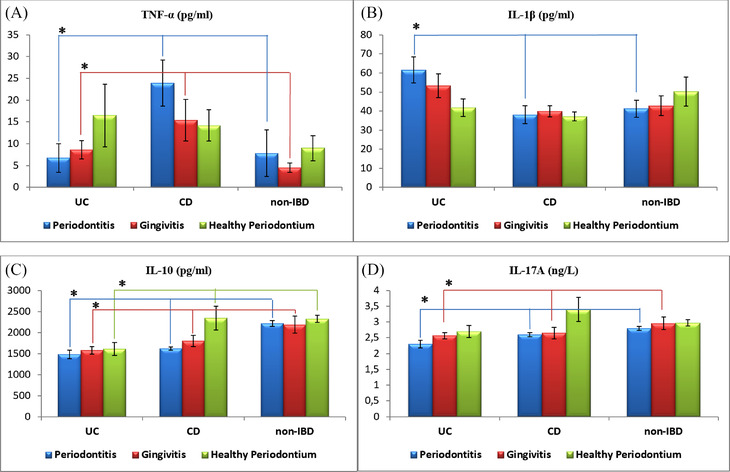
Graphical descriptions of GCF cytokine levels in relation to periodontal health status and bowel health status. (A) In patients with periodontitis and gingivitis, the mean levels of TNF‐α were significantly higher for the CD group of patients as compared with the other groups. (B) In patients with periodontitis, the mean level of IL‐1β was significantly higher for the UC group of patients as compared with the other groups. (C) In patients with periodontitis and gingivitis, the mean levels of IL‐10 were significantly higher for the non‐IBD group of patients as compared with the other groups, and in patients with healthy periodontium, the mean level of IL‐10 was significantly lower for the UC group of patients as compared with the other groups. (D) In patients with periodontitis and gingivitis, the mean levels of IL‐17A were significantly higher for the non‐IBD group of patients as compared with the other groups. CD, Crohn disease; GCF, gingival crevicular fluid; IBD, inflammatory bowel diseases; IL, interleukin; TNF‐α, tumor necrosis factor‐alpha; UC, ulcerative colitis. *Statistically significant difference between groups, p <0.05; one‐way ANOVA test; Kruskal‒Wallis H test
3.2. Correlations among clinical periodontal parameters and the salivary and GCF levels of cytokines in patients with UC and CD
In patients with UC, significant correlations were found between salivary TNF‐α levels and PI and GI values (p = 0.049 and p = 0.03, respectively), and between salivary TNF‐α and IL‐10 levels (p = 0.001). Positive correlations were observed between salivary IL‐1β levels and BOP and CAL values (p = 0.006 and p = 0.032), as well as between salivary IL‐1β and TNF‐α levels and between salivary IL‐1β and IL‐10 levels (p = 0.001 and p = 0.006, respectively). Salivary IL‐17A levels were strongly positively correlated with salivary IL‐10 levels (p = 0.004). GCF IL‐1β levels were positively correlated with the CAL, salivary IL‐17A levels, and GCF TNF‐α levels (p = 0.047, p = 0.012, and p = 0.021, respectively). A strongly positive correlation was found between GCF IL‐17A and GCF IL‐10 levels (p = 0.001) (see Table S3 in online Journal of Periodontology).
In patients with CD, there was a positive correlation between salivary IL‐1β levels and PI, PD, BOP, and CAL values (P = 0.016, P = 0.048, p = 0.003, and p = 0.017, respectively). Salivary IL‐17A levels were strongly positively correlated with salivary IL‐10 levels in patients with CD (p = 0.001). GCF IL‐1β levels were correlated with GI and BOP values (p = 0.033 and p = 0.040). GCF IL‐10 and IL‐17A levels were both negatively correlated with PI values (p = 0.019 and p = 0.024). A strong positive correlation was found between GCF IL‐17A and GCF IL‐10 levels (p = 0.001) (see Table S4 in online Journal of Periodontology).
In non‐IBD‐patients, there was a strong positive correlation between salivary IL‐17A levels and salivary IL‐10 levels (p = 0.001). GCF IL‐17A levels were negatively correlated with BOP and CAL values (p = 0.021 and p = 0.017, respectively). Similar to salivary concentrations, positive correlations were also found between GCF IL‐1β levels and GCF TNF‐α levels (p = 0.035), and between GCF IL‐17A and GCF IL‐10 levels (p<0.000) (see Table S5 in online Journal of Periodontology).
When the correlation analyses were performed according to the activity status of IBD‐patients, correlations were shown between salivary IL‐1β levels and GI, and BOP values (p = 0.008, and p = 0.031, respectively), and between salivary IL‐17A levels and PD and CAL values (p = 0.017 and p = 0.024, respectively) in active patients with UC. Additionally, there was an association between GCF IL‐1β levels and GR values (p = 0.044). For patients with UC in remission period, no significant correlations were identified between clinical periodontal parameters and the salivary and GCF levels of biomarkers. In active patients with CD, salivary TNF‐α levels were correlated with PI values (p = 0.018), and salivary IL‐1β levels were correlated with PD and CAL values (p = 0.016 and p = 0.023). Regarding GCF biomarkers, a significant correlation was only found between IL‐17A levels and GI values (p = 0.044). For patients with CD in remission period, GCF IL‐1β and IL‐10 levels correlated with BOP values (p = 0.016 and p = 0.046) (Figure 3).
FIGURE 3.
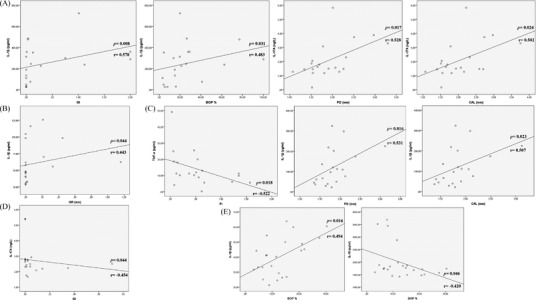
Significant correlations between clinical measurements (PI, GI, BOP, PD, CAL, and GR) and both GCF and salivary cytokines in IBD patients in relation to the activity status of the diseases. (A) In active UC, positive correlations between the mean salivary IL‐1β and (GI, and BOP) values, and IL‐17A levels and (PD, and CAL) values. (B) In active UC, a positive correlation between the mean GCF IL‐1β levels and GR value. (C) In active CD, a negative correlation between the mean salivary TNF‐α levels and PI value, and positive correlations between salivary IL‐1β levels and (PD, and CAL) values. (D) In active CD, a negative correlation between the mean GCF IL‐17A levels and GI value. (E) In remission CD, a positive correlation between the mean GCF IL‐1β and BOP, and negative correlation between mean GCF IL‐17A levels and BOP value. BOP, bleeding on probing; CAL, clinical attachment level; GCF, gingival crevicular fluid; GI, gingival index; GR, gingival recession; IL, interleukin; PD, probing depth; PI, plaque index; TNF‐α, tumor necrosis factor‐alpha
The correlation analyses were performed according to medications used (see Table S6 and Table S7 in online Journal of Periodontology). Regarding immunomodulators, significant positive correlations were found between salivary IL‐1β level with GI value and between salivary IL‐17A level with PI and GI values. A significant negative correlation was detected between GCF TNF‐α level with GR value (see Table S7 in online Journal of Periodontology).
3.3. Multilevel logistic regression analysis
To identify the effects of determinant variables related to patients’ demographics, dental health behaviors, presence of oral lesions, disease characteristics of IBD, and medication usage with respect to the periodontal status, univariate logistic regression analyses were performed (Table 3). A lack of interdental cleaning was only found to be a risk indicator for periodontitis (p = 0.041). The risk of periodontitis in patients without interdental cleaning was 3.2 times higher than in patients with interdental cleaning. The medication used for IBD treatment was found to be a risk factor for gingivitis (p = 0.027). The risk of gingivitis in patients using medications was 3.5 times higher than that of patients not using medications. Since only one variable was statistically significant in the univariate logistic regression analyses, a multivariate logistic regression analysis could not be performed (Table 3).
TABLE 3.
Univariate logistic regression analysis for risk factors influencing periodontal diseases (periodontitis and gingivitis)
| Periodontal diseases | |||||||||||||
|---|---|---|---|---|---|---|---|---|---|---|---|---|---|
| Periodontitis | Gingivitis | ||||||||||||
| 95% CI for OR | 95% CI for OR | ||||||||||||
| Variables (Reference) | B | SE | P value | OR | Lower limit | Upper limit | B | SE | P value | OR | Lower limit | Upper limit | |
| IBD status (remission) | Active | 0.550 | 0.568 | 0.333 | 1.733 | 0.569 | 5.278 | 0.652 | 0.534 | 0.222 | 1.920 | 0.675 | 5.464 |
| Medications used in IBD treatment (No) | Yes | 0.560 | 0.627 | 0.372 | 1.750 | 0.133 | 2.040 | 1.253 | 0.567 | 0.027 * | 3.500 | 0.089 | 1.081 |
| Smoking (No) | Yes | 1.466 | 1.153 | 0.204 | 4.333 | 0.452 | 41.545 | 0.773 | 1.183 | 0.513 | 2.167 | 0.213 | 22.019 |
| Oral lesion (Yes) | No | 1.515 | 0.855 | 0.076 | 4.550 | 0.851 | 24.318 | 0.867 | 0.650 | 0.182 | 2.380 | 0.666 | 8.506 |
| Brushing habits (Yes) | No | 1.163 | 0.742 | 0.117 | 3.200 | 0.748 | 13.690 | 0.163 | 0.777 | 0.834 | 1.176 | 0.256 | 5.399 |
| Interdental cleaning habits (Yes) | No | 1.225 | 0.600 | 0.041 * | 3.405 | 1.050 | 11.044 | 0.289 | 0.504 | 0.567 | 1.335 | 0.497 | 3.587 |
| Dental visit (Yes) | No | 0.833 | 0.640 | 0.193 | 2.300 | 0.656 | 8.070 | −0.223 | 0.524 | 0.670 | 0.800 | 0.286 | 2.236 |
| Other systemic diseases (No) | Yes | 0.223 | 0.642 | 0.728 | 1.250 | 0.355 | 4.402 | 0.754 | 0.748 | 0.313 | 2.125 | 0.491 | 9.198 |
p<0.05
Abbreviations: IBD, inflammatory bowel diseases; OR, odds ratio.
4. DISCUSSION
This study investigated the salivary and GCF levels of inflammatory cytokines (TNF‐α, IL‐1β, IL‐10, and IL‐17A), in patients with UC, and CD and non‐IBD, with respect to their periodontal status for further understanding of the relationships among the selected cytokines, IBD, and periodontal diseases.
Previous investigations have indicated an association of severity of periodontal diseases for patients with UC and CD as compared with healthy control. 3 , 16 , 21 , 22 , 23 , 24 A recent cross‐sectional study demonstrated that patients with UC and CD showed significantly higher percentages of sites with PD ≥5 mm, and CAL ≥4 mm as compared with controls. 23 In contrast, other studies have revealed an inverse relationship between IBD and periodontal diseases or the absence of a difference in periodontal disease susceptibility between patients with IBD and non‐IBD. 25 , 26 , 27
In the present study, molar teeth were selected for GCF sampling as the amount of production of GCF is quite small and changes according to the size of gingival sulcus. Moreover, larger GCF volumes have been detected at the posterior sites compared with anterior sites, at mandibular sites compared with maxillary sites, and at interproximal sites of posterior teeth than anterior labial sites. 28 , 29 , 30 , 31 , 32 In a study conducted by Challacombe et al., 33 authors reported that the mean GCF volume ranged from 0.43 to 1.56 μl in the proximal site of molar teeth. 33 In our study, non‐IBD group presented statistically significant higher mean values of PD as compared with IBD groups in both gingivitis and healthy periodontium patients. This finding was in line with a previous study conducted by Grossner‐Schreiber et al., 26 which demonstrated deeper PD values in the healthy control group as compared with patients with IBD. 26 In agreement, a previous cross‐sectional study reported that periodontal diseases in patients with IBD were more generalized but less severe than in the general population. 34 In the present study, the highest mean value of BOP was observed in the UC group, while the lowest value was observed in the CD group in patients with periodontitis. Moreover, our study exhibited lower values of PD and CAL for CD group as compared with UC and non‐IBD groups in patients with gingivitis. In contrast, Bucbender et al. 27 reported that the mean BOP and PD values were increased significantly in patients with CD as compared with healthy controls and no significant difference was observed between patients with UC and healthy controls. 27 It was emphasized in a recent retrospective cohort study that some medications for IBD could show a protective effect against periodontitis development in patients with CD. 35 Another study highlighted that patients with UC needed markedly more immunomodulators in their treatment than patients with UC and, therefore, patients with CD might be less vulnerable to attachment loss. 21 Another possible explanation for having higher means of clinical periodontal parameters in patients with UC may be due to a significantly low number of smokers in the group. In fact, smoking was reported to play a protective role for UC, while it has been shown as an evident risk indicator for periodontal diseases in patients with CD. 6
The majority of previous studies have indicated that IBD and periodontal diseases share similar cytokine expression patterns due to having some common pathogenic inflammatory processes. 36 , 37 Prior studies have reported elevated levels of proinflammatory and anti‐inflammatory mediators and MMPs, such as IL‐4, ‐10, ‐17A, ‐18, ‐21, IFN‐γ, MMP‐7, and MMP‐8, in the periodontal tissues of patients with IBD. 12 , 27 , 38 To the best of our knowledge, the present study was the first to examine the selected inflammatory mediators in both saliva and GCF in UC, CD, and patients with non‐IBD according to their periodontal status. In this study, UC group of patients had the highest salivary concentrations of TNF‐α as compared with CD and non‐IBD groups for both patients with periodontitis and gingivitis. The salivary levels of TNF‐α, IL‐1β, and IL‐10 exhibited the lowest concentrations for CD group in patients with periodontitis and gingivitis. These findings could be attributed to the fact that anti‐TNF‐α therapy has been demonstrated to induce neutrophil apoptosis and, moreover, to suppress neutrophils to produce proinflammatory cytokines and chemokines. 39 However, this medication was reported to have a slight effect on patients with UC and healthy controls. Interestingly, in our study, all the salivary biomarkers were not significantly different among UC, CD, and non‐IBD groups for the patients with healthy periodontium. This result highlighted the importance of having a healthy periodontium in patients with IBD, which may have prevented the excessive inflammatory response evident in the saliva of patients with IBD. In agreement with previous studies, in GCF of periodontitis sites, patients with CD had significantly increased levels of TNF‐α as compared with patients with UC and patients with non‐IBD, which was consistent with CD being considered to be driven by a Th1 response. 40
IL‐10 plays a key role in regulating the physiological state of tissue and in downregulating the production of proinflammatory cytokines; however, its contribution to IBD is not fully understood. Elevated serum concentrations of IL‐10 in active UC and CD‐patients as compared with healthy controls have been previously reported. 41 , 42 Overexpression of IL‐10 in subgingival biofilm samples for patients with UC and CD as compared with healthy controls have also been demonstrated. 27 In contrast, other studies have shown similar or lower IL‐10 levels in the serum of patients with UC and CD as compared with non‐IBD patients. 43 , 44 The present study exhibited higher levels of IL‐10 in both saliva and GCF in non‐IBD group as compared with UC and CD groups, in periodontitis and gingivitis patients. One possible reason for the increased levels of IL‐10 in non‐IBD patients might be that these patients did not use medications such as anti‐TNF‐α therapy, which have been reported to reduce the expressions of IL‐17 A, IFNγ, and IL‐10 in IBD‐patients. 45
The present study indicated significant correlations between the clinical periodontal parameters and salivary and GCF cytokine levels according to the activity status of IBD. In active patients with UC, there were positive correlations between salivary IL‐17A levels and CAL values. Therefore, it seems that overexpression of salivary levels of IL‐17A may also increase the severity of periodontal diseases. Additionally, in active patients with CD, while there were positive relationships between salivary IL‐1β levels and PD and CAL values, no relationship was found between salivary IL‐17A and any clinical parameters. In line with these findings, in a previous study by Figueredo et al. 12 a trend towards increased levels of IL‐1β and TNF‐α in gingival and intestinal tissues were demonstrated as potent markers for differentiating active and remission status in patients with IBD. 12 Furthermore, in the present study, significant positive correlations between IL‐17A and IL‐10 in GCF and the saliva of both patients with UC and CD were identified. T‐cell‐specific blockade of IL‐10 signaling using a dominant‐negative IL‐10 receptor was suggested to lead to increased Th17 cells in an anti‐CD3 antibody‐induced model of small intestinal inflammation. 46 Some limitations of the current study must be mentioned. First, there was an absence of completely systemically healthy individuals, which could possibly affect the interpretation of the results. Additionally, immune cells interactions and other cytokines functions could have been investigated as they may play an important role between both diseases.
5. CONCLUSIONS
In the presence of periodontal diseases, patients with UC and CD presented with higher levels of TNF‐α and lower levels of IL‐10 as compared with patients with non‐IBD. In addition, patients with UC had higher scores of BOP and increased levels of IL‐1β in the presence of periodontal disease, whereas in the absence of periodontal disease, IL‐10 levels were lower in UC as compared with patients with CD. On the other hand, patients with non‐IBD with gingivitis or healthy periodontium seemed to have higher means of clinical periodontal parameters as compared with patients with UC and CD. While no relationship between periodontal clinical parameters and cytokine levels in oral secretions were identified in IBD‐patients in remission status, salivary IL‐1β seemed to be a key inflammatory cytokine of UC and CD activity for severity of periodontal inflammation. Additionally, salivary IL‐17A could potentially be a biomarker of increasing severity of periodontal disease in active patients with UC.
CONFLICTS OF INTEREST
The authors report no conflicts of interest related to this study.
AUTHOR CONTRIBUTIONS
Ayaz Enver worked on data collection; Nurdan Ozmeric worked on interpretation of data, conception and design of the study, as well as analysis and approval of the version to be published; Sila Cagri Isler worked on interpretation of data and drafting the article; Murat Toruner worked on data collection; Serenay Elgun, Gulsah Demirci, and Cigdem Fidan performed the biochemical analyses of cytokines; Andre Paes B. da Silva worked on interpretation of data, conception and design of the study, analysis, and approval of the version to be published.
Supporting information
Supplemental Table 1. Statistical data of saliva regarding figure 1.
Supplemental Table 2. Statistical data of GCF regarding figure 2.
Supplemental Table 3. Relationship between clinical indexes (PI, GI, PD, BOP, CAL, and GR) with GCF and salivary cytokines levels in UC patients.
Supplemental Table 4. Relationship between clinical indexes (PI, GI, PD, BOP, CAL, and GR) with GCF and salivary cytokines levels in CD patients.
Supplemental Table 5. Relationship between clinical indexes (PI, GI, PD, BOP, CAL, and GR) with GCF and salivary cytokines levels in non‐IBD patients.
Supplemental Table 6. Relationship between clinical indexes (PI, GI, PD, BOP, CAL, and GR) with GCF and salivary cytokines regarding medications used in IBD treatment (TNF‐inhibitors and Anti‐integrins).
Supplemental Table 7. Relationship between clinical indexes (PI, GI, PD, BOP, CAL, and GR) with GCF and salivary cytokines regarding medications used in IBD treatment (Immunomodulators and 5‐ASA).
ACKNOWLEDGMENT
The study was funded by Gazi University Scientific Research Projects with project code 03/2018‐07.
Enver A, Ozmeric N, Isler SC, et al. Evaluation of periodontal status and cytokine levels in saliva and gingival crevicular fluid of patients with inflammatory bowel diseases. J Periodontol. 2022;93:1649–1660. 10.1002/JPER.22-0065
Footnotes
Nordent Manufacturing, Elk Grove Village, IL, USA
Periopaper, Proflow, NY, USA
Oraflow, Plainview, NY, USA
MLCONVERT.exe software version 2.52, Oraflow, Amityville, NY, USA
Sunred Biological Technology, Shanghai, China, Catalog no: 201‐12‐0048
Sunred Biological Technology, Shanghai, China, Catalog no: 201‐12‐0103
DIAsource ImmunoAssays, Louvain‐la‐Neuve, Belgium, Catalog no: KAP1211 – Lot: 180314/1
DIAsource ImmunoAssays, Louvain‐la‐Neuve, Belgium, Catalog no: KAP1751 – Lot: 180309/1
ChemWell 2900, Awareness Technology, Palm City, FL, USA
IBM SPSS Statistics for Windows, Version 25.0, IBM, Armonk, NY, USA
REFERENCES
- 1. Xun Z, Zhang Q, Xu T, Chen N, Chen F. Dysbiosis and ecotypes of the salivary microbiome associated with inflammatory bowel diseases and the assistance in diagnosis of diseases using oral bacterial profiles. Front. Microbiol 2018;9:1136. [DOI] [PMC free article] [PubMed] [Google Scholar]
- 2. She Y‐y, Kong X‐b, Ge Y‐p, et al. Periodontitis and inflammatory bowel disease: a meta‐analysis. BMC Oral Health 2020;20:67. [DOI] [PMC free article] [PubMed] [Google Scholar]
- 3. Habashneh R, Khader Y, Alhumouz M, Jadallah K, Ajlouni Y. The association between inflammatory bowel disease and periodontitis among Jordanians: a case–control study. J Periodont Res 2012;47:293‐298. [DOI] [PubMed] [Google Scholar]
- 4. Papageorgiou SN, Hagner M, Nogueira AVB, Franke A, Jäger A, Deschner J. Inflammatory bowel disease and oral health: systematic review and a meta‐analysis. J Clin Periodontol 2017;44:382‐393. [DOI] [PubMed] [Google Scholar]
- 5. Kang EA, Chun J, Kim JH, et al. Periodontitis combined with smoking increases risk of the ulcerative colitis: a national cohort study. World J Gastroenterol 2020;26:5661‐5672. [DOI] [PMC free article] [PubMed] [Google Scholar]
- 6. Lorenzo‐Pouso AI, Castelo‐Baz P, Rodriguez‐Zorrilla S, Pérez‐Sayáns M, Vega P. Association between periodontal disease and inflammatory bowel disease: a systematic review and meta‐analysis. Acta Odontol Scand 2021;79:344‐353. [DOI] [PubMed] [Google Scholar]
- 7. Agossa K, Dendooven A, Dubuquoy L, Gower‐Rousseau C, Delcourt‐Debruyne E, Capron M. Periodontal manifestations of inflammatory bowel disease: emerging epidemiologic and biologic evidence. J Periodont Res 2017;52:313‐324. [DOI] [PubMed] [Google Scholar]
- 8. Schmidt J, Weigert M, Leuschner C, et al. Active matrix metalloproteinase‐8 and periodontal bacteria—interlink between periodontitis and inflammatory bowel disease? J Periodontol 2018;89:699‐707. [DOI] [PubMed] [Google Scholar]
- 9. Figueredo C, Brito F, Barros F, et al. Expression of cytokines in the gingival crevicular fluid and serum from patients with inflammatory bowel disease and untreated chronic periodontitis. J Periodont Res 2011;46:141‐146. [DOI] [PubMed] [Google Scholar]
- 10. Boirivant M, Cossu A. Inflammatory bowel disease. Oral Dis 2012;18:1‐15. [DOI] [PubMed] [Google Scholar]
- 11. Said HS, Suda W, Nakagome S, et al. Dysbiosis of salivary microbiota in inflammatory bowel disease and its association with oral immunological biomarkers. DNA Res 2014;21:15‐25. [DOI] [PMC free article] [PubMed] [Google Scholar]
- 12. Figueredo CM, Martins AP, Lira‐Junior R, et al. Activity of inflammatory bowel disease influences the expression of cytokines in gingival tissue. Cytokine 2017;95:1‐6. [DOI] [PubMed] [Google Scholar]
- 13. Techatanawat S, Surarit R, Chairatvit K, et al. Salivary and serum interleukin‐17A and interleukin‐18 levels in patients with type 2 diabetes mellitus with and without periodontitis. PloS One 2020;15:e0228921. [DOI] [PMC free article] [PubMed] [Google Scholar]
- 14. Papapanou PN, Sanz M, Buduneli N, et al. Periodontitis: consensus report of workgroup 2 of the 2017 world workshop on the classification of periodontal and peri‐implant diseases and conditions. J Periodontol 2018;89:S173‐S182. [DOI] [PubMed] [Google Scholar]
- 15. Chapple IL, Mealey BL, Van Dyke TE, et al. Periodontal health and gingival diseases and conditions on an intact and a reduced periodontium: Consensus report of workgroup 1 of the 2017 World Workshop on the Classification of Periodontal and Peri‐Implant Diseases and Conditions. J Periodontol 2018;89:S74‐S84. [DOI] [PubMed] [Google Scholar]
- 16. Vavricka SR, Manser CN, Hediger S, et al. Periodontitis and gingivitis in inflammatory bowel disease: a case–control study. Inflamm Bowel Dis 2013;19:2768‐2777. [DOI] [PubMed] [Google Scholar]
- 17. Silness J, Loe H. Periodontal disease in pregnency. II. correlation between oral hygiene and periodontal condition. Acta Odontol Scand 1964;22:121‐135. [DOI] [PubMed] [Google Scholar]
- 18. Löe H, Silness J. Periodontal disease in pregnancy I. Prevalence and severity. Acta Odontol Scand 1963;21:533‐551. [DOI] [PubMed] [Google Scholar]
- 19. Ainamo J, Bay I. Problems and proposals for recording gingivitis and plaque. Int Dent J 1975;25:229‐235. [PubMed] [Google Scholar]
- 20. Navazesh M, Kumar SK. Measuring salivary flow: challenges and opportunities. J Am Dent Assoc 2008;139:35S‐40S. [DOI] [PubMed] [Google Scholar]
- 21. Brito F, FCd Barros, Zaltman C, et al. Prevalence of periodontitis and DMFT index in patients with Crohn's disease and ulcerative colitis. J Clin Periodontol 2008;35:555‐560. [DOI] [PubMed] [Google Scholar]
- 22. Koutsochristou V, Zellos A, Dimakou K, et al. Dental caries and periodontal disease in children and adolescents with inflammatory bowel disease: a case–control study. Inflamm Bowel Dis 2015;21:1839‐1846. [DOI] [PubMed] [Google Scholar]
- 23. Zhang L, Gao X, Zhou J, et al. Increased risks of dental caries and periodontal disease in Chinese patients with inflammatory bowel disease. Int Dent J 2020;70:227‐236. [DOI] [PMC free article] [PubMed] [Google Scholar]
- 24. Ozmeric N, Bissada N, da Silva APB. The association between inflammatory bowel disease and periodontal conditions: is there a common bacterial etiology. J Int Acad Periodontol 2018;20:40‐51. [PubMed] [Google Scholar]
- 25. Tan CX, Brand HS, Kalender B, De Boer NK, Forouzanfar T, de Visscher JG. Dental and periodontal disease in patients with inflammatory bowel disease. Clin Oral Investig 2021;25:5273‐5280. [DOI] [PMC free article] [PubMed] [Google Scholar]
- 26. Grössner‐Schreiber B, Fetter T, Hedderich J, Kocher T, Schreiber S, Jepsen S. Prevalence of dental caries and periodontal disease in patients with inflammatory bowel disease: a case–control study. J Clin Periodontol 2006;33:478‐484. [DOI] [PubMed] [Google Scholar]
- 27. Buchbender M, Fehlhofer J, Proff P, et al. Expression of inflammatory mediators in biofilm samples and clinical association in inflammatory bowel disease patients—a preliminary study. Clin Oral Investig 2022;26:1217‐1228. [DOI] [PMC free article] [PubMed] [Google Scholar]
- 28. Smith Q, Geegan S. Repeated measurement of crevicular fluid parameters at different sites. J Clin Periodontol 1991;18:171‐176. [DOI] [PubMed] [Google Scholar]
- 29. Smith QT, Au GS, Freese PL, Osborn JB, Stoltenberg JL. Five parameters of gingival crevicular fluid from eight surfaces in periodontal health and disease. J Periodontal Res 1992;27:466‐475. [DOI] [PubMed] [Google Scholar]
- 30. Booth V, Young S, Cruchley A, Taichman N, Paleolog E. Vascular endothelial growth factor in human periodontal disease. J Periodontal Res 1998;33:491‐499. [DOI] [PubMed] [Google Scholar]
- 31. Özkavaf A, Aras H, Huri CB, et al. Relationship between the quantity of gingival crevicular fluid and clinical periodontal status. J Oral Sci 2000;42:231‐238. [DOI] [PubMed] [Google Scholar]
- 32. Khurshid Z, Mali M, Naseem M, Najeeb S, Zafar MS. Human gingival crevicular fluids (GCF) proteomics: an overview. Dent J 2017;5:12. [DOI] [PMC free article] [PubMed] [Google Scholar]
- 33. Challacombe S, Russell M, Hawkes J. Passage of intact IgG from plasma to the oral cavity via crevicular fluid. Clin Exp Immunol 1978;34:417‐422. [PMC free article] [PubMed] [Google Scholar]
- 34. Flemmig TF, Shanahan F, Miyasaki KT. Prevalence and severity of periodontal disease in patients with inflammatory bowel disease. J Clin Periodontol 1991;18:690‐697. [DOI] [PubMed] [Google Scholar]
- 35. Chi Y‐C, Chen J‐L, Wang L‐H, et al. Increased risk of periodontitis among patients with Crohn's disease: A population‐based matched‐cohort study. Int J Colorectal Dis 2018;33:1437‐1444. [DOI] [PubMed] [Google Scholar]
- 36. Baima G, Massano A, Squillace E, et al. Shared microbiological and immunological patterns in periodontitis and IBD: A scoping review. Oral Dis 2022;28:1029‐1041. [DOI] [PMC free article] [PubMed] [Google Scholar]
- 37. Byrd KM, Gulati AS. The'Gum‐Gut'Axis in inflammatory bowel diseases: a hypothesis‐driven review of associations and advances. Front Immunol 2021;12:620124. [DOI] [PMC free article] [PubMed] [Google Scholar]
- 38. Arias‐Bujanda N, Regueira‐Iglesias A, Balsa‐Castro C, Nibali L, Donos N, Tomás I. Accuracy of single molecular biomarkers in gingival crevicular fluid for the diagnosis of periodontitis: a systematic review and meta‐analysis. J Clin Periodontol 2019;46:1166‐1182. [DOI] [PubMed] [Google Scholar]
- 39. Zhang Y, Qiao D, Chen R, Zhu F, Gong J, Yan F. The association between periodontitis and inflammatory bowel disease: a systematic review and meta‐analysis. Biomed Res Int 2021;2021:6692420. [DOI] [PMC free article] [PubMed] [Google Scholar]
- 40. Geremia A, Biancheri P, Allan P, Corazza GR, Di Sabatino A. Innate and adaptive immunity in inflammatory bowel disease. Autoimmun Rev 2014;13:3‐10. [DOI] [PubMed] [Google Scholar]
- 41. Kucharzik T, Stoll R, Lügering N, Domschke W. Circulating antiinflammatory cytokine IL‐10 in patients with inflammatory bowel disease (IBD). Clin Exp Immunol 1995;100:452‐456. [DOI] [PMC free article] [PubMed] [Google Scholar]
- 42. Mitsuyama K, Tomiyasu N, Takaki K, et al. Interleukin‐10 in the pathophysiology of inflammatory bowel disease: increased serum concentrations during the recovery phase. Mediators Inflamm 2006;2006:26875. [DOI] [PMC free article] [PubMed] [Google Scholar]
- 43. Nielsen O, Køppen T, Rüdiger N, Horn T, Eriksen J, Kirman I. Involvement of interleukin‐4 and‐10 in inflammatory bowel disease. Dig Dis Sci 1996;41:1786‐1793. [DOI] [PubMed] [Google Scholar]
- 44. Tagore A, Gonsalkorale W, Pravica V, et al. Interleukin‐10 (IL‐10) genotypes in inflammatory bowel disease. Tissue Antigens 1999;54:386‐390. [DOI] [PubMed] [Google Scholar]
- 45. Bendix M, Dige A, Jørgensen SP, et al. Decrease in mucosal IL17A, IFNγ and IL10 expressions in active Crohn's disease patients treated with high‐dose vitamin D alone or combined with infliximab. Nutrients 2020;12:3699. [DOI] [PMC free article] [PubMed] [Google Scholar]
- 46. Huber S, Gagliani N, Esplugues E, et al. Th17 cells express interleukin‐10 receptor and are controlled by Foxp3− and Foxp3+ regulatory CD4+ T cells in an interleukin‐10‐dependent manner. Immunity 2011;34:554‐565. [DOI] [PMC free article] [PubMed] [Google Scholar]
Associated Data
This section collects any data citations, data availability statements, or supplementary materials included in this article.
Supplementary Materials
Supplemental Table 1. Statistical data of saliva regarding figure 1.
Supplemental Table 2. Statistical data of GCF regarding figure 2.
Supplemental Table 3. Relationship between clinical indexes (PI, GI, PD, BOP, CAL, and GR) with GCF and salivary cytokines levels in UC patients.
Supplemental Table 4. Relationship between clinical indexes (PI, GI, PD, BOP, CAL, and GR) with GCF and salivary cytokines levels in CD patients.
Supplemental Table 5. Relationship between clinical indexes (PI, GI, PD, BOP, CAL, and GR) with GCF and salivary cytokines levels in non‐IBD patients.
Supplemental Table 6. Relationship between clinical indexes (PI, GI, PD, BOP, CAL, and GR) with GCF and salivary cytokines regarding medications used in IBD treatment (TNF‐inhibitors and Anti‐integrins).
Supplemental Table 7. Relationship between clinical indexes (PI, GI, PD, BOP, CAL, and GR) with GCF and salivary cytokines regarding medications used in IBD treatment (Immunomodulators and 5‐ASA).