

Abstract
The brain's glymphatic system is a network of intracerebral vessels that function to remove “waste products” such as degraded proteins from the brain. It comprises of the vasculature, perivascular spaces (PVS), and astrocytes. Poor glymphatic function has been implicated in numerous diseases; however, its contribution is still unknown. Efforts have been made to image the glymphatic system to further assess its role in the pathogenesis of different diseases. Numerous imaging modalities have been utilized including two‐photon microscopy and contrast‐enhanced magnetic resonance imaging (MRI). However, these are associated with limitations for clinical use. PVS form a part of the glymphatic system and can be visualized on standard MRI sequences when enlarged. It is thought that PVS become enlarged secondary to poor glymphatic drainage of metabolites. Thus, quantitating PVS could be a good surrogate marker for glymphatic function. Numerous manual rating scales have been developed to measure the PVS number and size on MRI scans; however, these are associated with many limitations. Instead, automated methods have been created to measure PVS more accurately in different diseases. In this review, we discuss the imaging techniques currently available to visualize the glymphatic system as well as the automated methods currently available to measure PVS, and the strengths and limitations associated with each technique.
Evidence Level
1
Technical Efficacy
Stage 1
Keywords: brain, glymphatic, perivascular spaces, Virchow–Robin spaces, MRI, quantification
The brain's glymphatic system is a network of intracerebral vessels and cells that function to transport fluid between compartments and remove “waste products” such as degraded proteins from the brain. The glymphatic system compromises a perivascular unit consisting of the vasculature, perivascular spaces (PVS), and astrocytes (Fig. 1). 2 PVS are cylindrical potential CSF spaces that surround the vasculature in the brain and are typically <3 mm. PVS are yet to be described outside the central nervous system (CNS). 3
FIGURE 1.
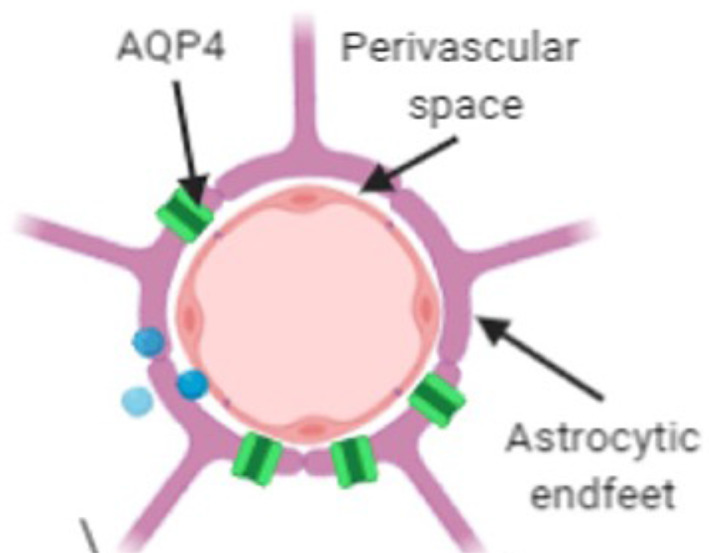
The perivascular unit. Source: Adapted from reference 1. Perivascular spaces (PVS) are potential cerebrospinal fluid (CSF) spaces shaped as a cylinder that surround the brain's vasculature as it penetrates the brain. Astrocytes are glial cells whose end feet surround the arteries on the other side of the perivascular space and play a role in adjusting blood flow. Aquaporin‐4 (AQP4) water channels are embedded in the astrocytic endfeet and facilitate the exchange of fluids. 1 , 2
The pathway of cerebrospinal fluid (CSF) movement through the glymphatic system has been theorized. 3 , 4 , 5 CSF enters the PVS surrounding arteries and then moves through the brain parenchyma before entering the PVS surrounding veins and draining adjacent to the venous system (Fig. 2). Toxic proteins and metabolites are “mopped up” by fluids entering the brain tissue and are cleared from the brain via PVS. 4 Numerous neurological diseases are caused by the abnormal build‐up of proteins in the brain (see Section PVS in Disease). Autopsy studies have demonstrated enlarged PVS as an early feature of vascular disease. 8 Thus, the poor glymphatic clearance of toxic proteins and metabolites could be a potential contributor to the etiology of these diseases.
FIGURE 2.
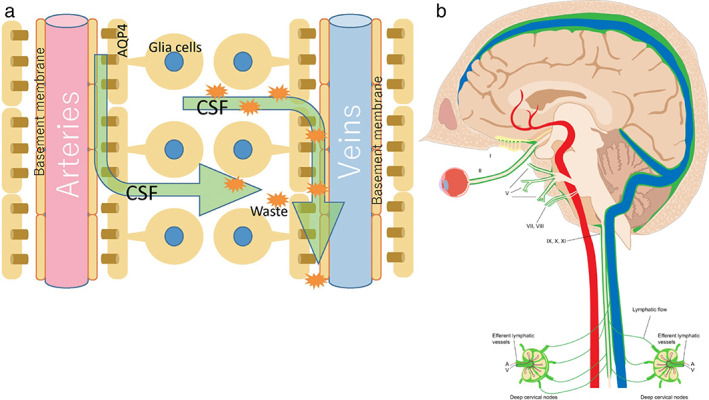
Pathway through the glymphatic system. Source: (a) Taken from reference 6. Source: (b) Taken from reference 7. (a) Schematic of the pathway of CSF fluid through the glymphatic drainage system via perivascular spaces is shown. CSF enters the perivascular space surrounding the artery. The fluid then moves into the brain parenchyma via the AQP4 water channels. CSF enters the perivascular space surrounding veins, bringing any toxic proteins and metabolites (orange starburst shapes) from the brain tissue with it. Fluids, toxic proteins, and metabolites then drain through the glymphatic system, eventually draining into lymph nodes in the neck. (b) Green represents the lymphatic drainage from the brain into the cervical lymph nodes in the neck. Fluid drains from the ISF‐meningeal connections along the dural venous system to the deep lymph nodes in the neck. CSF = cerebrospinal fluid; AQP4 = aquaporin‐4; ISF = interstitial fluid.
Imaging the Glymatic System
Iliff et al were one of the first to image the glymphatic system. 4 They assessed movement of CSF through the brain utilizing two‐photon laser scanning microscopy. By injecting a large‐molecular weight tracer FITC‐d2000 and a lower‐molecular‐weight tracer TR‐d3 into the cisterna magna of mice they identified the pathway of CSF movement from the subarachnoid space, finding brain interstitial fluid was cleared via PVS. Additionally, they found small solutes were able to move from PVS into the brain parenchyma by bulk flow, whereas larger molecules were prevented by astrocytic end feet and remained in PVS to be glymphatically cleared from the brain. 4 This method, however, was invasive and not a practical approach for assessing the glymphatic system in humans. Fluorescence microscopy causes photo‐bleaching and damage in live tissue cells making it not applicable in live human tissue. 9 Thus, the use of MRI was proposed.
Iliff et al then went on to assess the utility of contrast‐enhanced T1w FLASH MRI sequences to image the glymphatic system in rats. 5 This study assessed the exchange of CSF in the PVS using two different paramagnetic contrast agents Magnevist (gadopentetate dimeglumine, Gd‐DTPA) and GadoSpin P (high‐molecular‐weight polymetric gadolinium‐based contrast agent). It confirmed the pathway of the CSF from subarachnoid spaces through PVS into the brain tissue. They concluded that contrast‐enhanced MRI was able to visualize the glymphatic pathway in rats and allowed visualization of the tracer throughout the entire brain volume. 4 This can be beneficial for the identification of key areas of CSF influx into the PVS. The route of entry through the cisterna magna is not used in humans due to the risk of medullary injury. 10 , 11 However, contrast‐enhanced MRI using intrathecal injections can instead be used to visualize the glymphatic system. 12 , 13 , 14 , 15 The intrathecal route is highly invasive and can be associated with significant adverse effects including infection, allergic reaction and spinal cord or nerve injury. 16 Additionally, the >2 hours scan time restricts accessibility of this technique for patients in routine clinical practice. Despite these limitations, contrast‐enhanced MR cisternography is currently used in clinical practice to visualize and diagnose CSF leaks due to the higher sensitivity and specificity when compared to other imaging techniques. 14 , 17 , 18 Thus, this method could be altered to visualize the flow of fluids through the glymphatic system in humans. In a cohort of healthy older adults, Zhou et al demonstrated the involvement of putative meningeal lymphatic vessels in the glymphatic pathway and validated the use of gadodiamide contrast‐enhanced T1w and FLAIR MRI scans at multiple timepoints to visualize glymphatic clearance. 12 Ringstad et al studied the use of gadobutrol as a contrast agent to visualize the glymphatic pathway over a period of 4 weeks (Fig. 3). They used standardized T1w MRI scans performed before contrast injection and at time points following the injection including at 24 hours, 48 hours, and 4 weeks in a cohort of healthy individuals and a cohort of patients with idiopathic normal pressure hydrocephalus (iNPH). They found the contrast‐enhanced MRI could readily visualize the clearance of gadobutrol via the glymphatic system and delayed clearance in the iNPH cohort. 13 Attempts to use the less‐invasive intravenous (IV) route, rather than intrathecal, have also been made. 19 , 20 , 21 , 22 , 23 Naganawa, Ohashi et al used the IV administration of gadolinium‐based agents to visualize the enhancement of PVS 4 hours after injection on T2w FLAIR MRI scans. They found this technique was successful at identifying PVS in a cohort of healthy individuals, and a cohort of patients with endolymphatic hydrops. 19 , 20 , 21 , 22 , 23 Gadolinium contrast is widely used for contrast‐enhanced neuroimaging in clinical practice but can be associated with a rare but life‐threatening allergy 24 and is contraindicated in renal impairment. Newer approaches utilizing endogenous contrast techniques may be superior to exogenous contrast such as gadolinium. IV contrast‐enhanced MRI offers the ability to dynamically visualize the flow of a tracer through the glymphatic system, which would be beneficial to better evaluate its function. Currently, other modalities only offer the visualization of the glymphatic system at stationary timepoints. However, this technique requires an intravenous infusion and scan at baseline, and then a scan 4 hours after the infusion to visualize the tracer in the PVS. Thus, it is time‐consuming and may limit its translatability to clinical practice.
FIGURE 3.
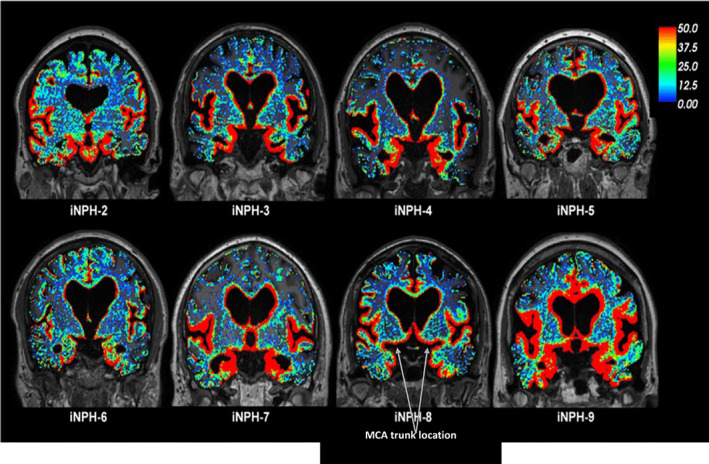
Imaging the glymphatic system by contrast‐enhanced MRI. Source: Taken from reference 13.The glymphatic system was visualized in patients with idiopathic normal pressure hydrocephalus (iPH). Gadobutrol was used as the MRI contrast agent to visualize the CSF. Standardized T1w MRI scans were performed before and after intrathecal gadobutrol infusion at defined time points. Red represents areas of increased tracer uptake, green represents areas of moderate tracer uptake, and blue represents areas of poor tracer uptake. Scans taken from eight participants with iPH are shown. The color scale shows the percentage change in signal unit ratio. This demonstrates the clearance of the tracer in areas adjacent to the vasculature, most likely via PVS.
An alternative method for imaging the glymphatic system is diffusion tensor image analysis along the perivascular space (DTI‐ALPS). DTI‐ALPS evaluates the diffusion capacity of water along PVS at areas of the brain where PVS and large white matter fibers are perpendicular. This is only possible where the medullary arteries and veins intersect with the ventricular wall. The ALPS index is the ratio of the diffusion capacity along the PVS on the outer side of the lateral ventricle to the diffusion capacity along the PVS running perpendicular to the main white matter fibers. The ALPS index scores are used to assess the flow of fluid through the glymphatic pathway. 25 , 26 This method is noninvasive and has shorter scanning times, especially when compared to intravenous‐contrast MRI. However, there are disadvantages associated with DTI. First, it requires high‐quality data and co‐registration of susceptibility‐weighted imaging (SWI) and DTI images. SWI is required to accurately identify the medullary vein structures, which PVS run concentrically to. DTI is unable to identify these structures and thus, co‐registration is necessary to calculate the DTI‐ALPS index. This registration is less accurate on highly atrophied brains such as those found in aged brains. 27 Presently, DTI‐ALPS can only measure the PVS in one region of interest, which does not provide information of the glymphatic system throughout the entire brain. It has been shown that poor glymphatic function in different areas of the brain may have different implications for disease. 28 , 29 , 30 Overall, DTI‐ALPS technique is relatively new and holds promise as a potential marker for glymphatic function. However, DTI‐ALPS is only applicable in brain regions where the blood vessels are perpendicular to white matter; therefore, a whole‐brain imaging technique would be favorable, and more research is required to validate its use in clinical practice.
Enlarged PVS as a Marker of Poor Glymphatic Function
As MRI technology has advanced, PVS have become more easily recognizable on MRI scans. They appear visible without contrast enhancement and can be easily identified on common sequences taken in clinical practice (Figure 4). Neurological diseases often warrant a brain MRI as part of their clinical work‐up, therefore they are accessible in a clinical setting. PVS, as discussed earlier, are an important part of the pathway of the glymphatic system. PVS have been reported to become enlarged secondary to poor glymphatic elimination of obstructed waste products and removal of interstitial fluids. 32 , 33 , 34 Typically, PVS are not seen on nonpathological structural MRI scans, and it is thought that they only become visible once they have become enlarged and glymphatic flow is reduced. 31 , 35 , 36 Thus, enlarged PVS visualized on MRI may be a surrogate marker for poor glymphatic function. 37
FIGURE 4.
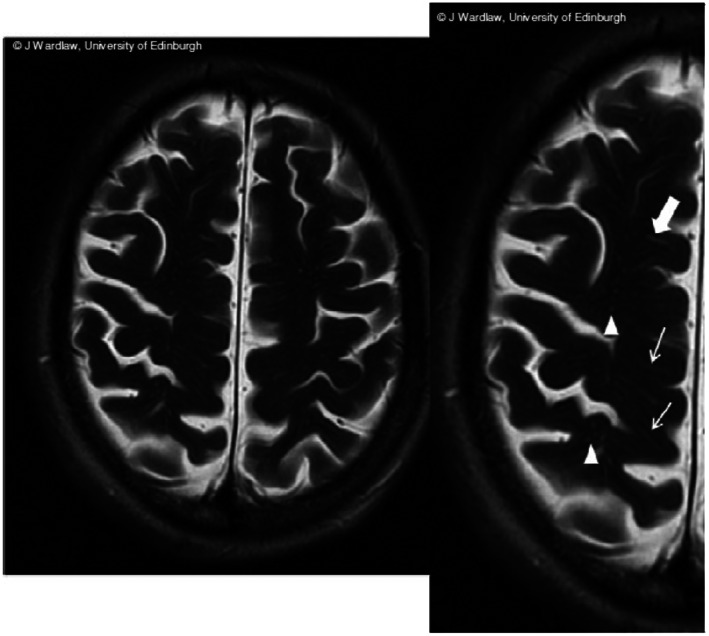
Enlarged perivascular spaces on MRI. Source: Taken from reference 31 Linear (arrows) and round (triangles) PVS structures visible on T2‐weighted coronal MRI. MRI = magnetic resonance image, PVS = perivascular space.
PVS in Disease
PVS in Neurodegenerative Diseases
Numerous neurodegenerative diseases are proteinopathies, whereby the disease is associated with accumulation of one or more toxic proteins within the brain. One mechanism for accumulation of these proteins may be via reduced glymphatic clearance. Kress et al evaluated the glymphatic clearance of tracers in aged mice. They found that there was impaired drainage of the glymphatic system in aging brains. 38 Since neurodegenerative diseases develop most commonly in older populations, 39 it is possible that reduced glymphatic clearance of waste products predisposes the aging brain to the development of neurodegenerative disease. Glymphatic clearance has been demonstrated for many of the proteins implicated in neurodegenerative disease pathogenesis, such as tau and amyloid‐beta. 4 , 5 , 40 , 41 , 42 , 43
As stated earlier, enlarged PVS can be used as a biomarker for poor glymphatic function. PVS have been found to be enlarged in patients with multiple sclerosis (MS) when compared to age‐ and sex‐matched healthy controls. 44 , 45 , 46 , 47 , 48 Wuerfel et al measured PVS volumes on T1w, T2w and FLAIR MRI scans. They quantified higher volumes of PVS in the MS cohort when compared to the controls. Additionally, within the MS cohort, there was no significant association between the volume of PVS and the brain parenchymal fraction (P = 0.126) implying the degree of brain atrophy had no effect on the PVS measurements. Conforti et al also found higher PVS number and volume in MS patients (n = 40) compared to healthy controls (n = 30) independent of the degree of global cortical atrophy measured by the brain parenchymal fraction (P = 0.41). 46 Thus, it was concluded that the volume of PVS was greater in the MS cohort independent of the degree of brain atrophy. 45 , 46 Wuerfel et al also performed a longitudinal sub‐study on 18 patients who had MRIs available at baseline and at 12 months. They found in scans with contrast‐enhancing lesions (CEL), there was a significant increase in PVS number and volume from the preceding scan without the presence of CEL (P = 0.011). Additionally, PVS volumes were lower when CEL were absent when compared to a preceding scan where the CEL was present (P = 0.085) 45 This demonstrates that enlarged PVS may be used as a dynamic marker for disease activity for patients with MS. 45 , 47 The inflammatory response in MS is thought to cause PVS enlargement due to the infiltration of inflammatory cells and fluid into the PVS. This could be due to either increased demyelinating disease activity or the breakdown of the blood–brain barrier during the inflammatory response. 46
Studies have also shown an enlargement of PVS in patients with Parkinson's disease (PD). 49 , 50 Shen et al found increased PVS volumes (P = 0.015) and numbers (P = 0.035) in the basal ganglia for patients with early‐onset PD (n = 40) when compared with healthy controls (n = 41). 49 Additionally, they found that there was a significant positive association between the PVS count in the basal ganglia and the disease severity (P = 0.005) measured by the Movement Disorder Society‐sponsored revision of the Unified Parkinson's Disease Rating Scale (MDS‐UPDRS). 49 Thus, there is potential for PVS to be used as a marker for disease severity in PD. One of the pathological hallmarks of PD is the presence of Lewy bodies. Lewy bodies are created by the abnormal aggregation of α‐synuclein protein. 51 α‐synuclein proteins have been shown to be cleared from the brain via the glymphatic system. 52 However, it is currently uncertain whether the poor glymphatic drainage of α‐synuclein protein increases its deposition and formation of Lewy bodies, or whether the damage of neurons releases α‐synuclein protein, which accumulates in PVS and prevents normal glymphatic clearance. 53
Alzheimer's disease (AD) involves two major pathological hallmarks—1) the formation of extracellular amyloid‐beta (Aβ) plaques and 2) the formation of neurofibrillary tangles due to intracellular accumulations of hyperphosphorylated tau proteins. 54 Both of these proteins have been found to be cleared from the brain via PVS. 4 , 5 , 40 , 41 , 42 , 43 Studies have shown larger PVS in patients with AD when compared with healthy controls. 32 , 55 , 56 , 57 , 58 PVS have been thought to become enlarged secondary to deficiencies in clearance of amyloid and tau proteins. 32 Hansen et al found a significantly higher burden of PVS measured on T1w MRI scans for patients with AD, and that their quantitative PVS burden scores were able to discriminate patients with AD from age‐matched healthy controls (P < 0.001). 56 Boespflug et al found larger numbers of enlarged PVS in postmortem samples of patients with AD when compared with postmortem samples from healthy controls (P < 0.01). Additionally, they found an increased PVS burden was associated with the presence of Aβ and tau pathology demonstrating a potential causal link between poor glymphatic clearance and abnormal aggregation of these proteins. 57 There is some evidence to suggest that enlarged PVS could be used to differentiate patients with mild cognitive impairment (MCI) from cognitively healthy controls. 59 Niazi et al found dilated PVS had a sensitivity of 92.86% and specificity of 93.33% for this distinction. 59 However, PVS have found to be enlarged in a range of different neurodegenerative diseases and therefore is unlikely to be highly specific to MCI. For example, PVS have been shown to be enlarged in other forms of dementia, such as vascular dementia and frontotemporal dementia when compared to healthy controls. 56 , 57 , 60 Overall, PVS is likely to play an integral role in the development of a range of proteinopathies.
PVS in Other Diseases
PVS have also been found to be enlarged in other brain diseases, implicating that the glymphatic system dysfunction may contribute to a wide variety of pathologies. 61 , 62 , 63 , 64 , 65 , 66 , 67 There have been multiple reports of enlarged PVS in pediatric populations of idiopathic generalized epilepsy. 63 , 64 , 66 , 67 Liu et al found that in children with newly diagnosed idiopathic generalized epilepsy, there were higher PVS number and volumes compared with healthy controls. Additionally, they found a positive correlation between the seizure duration and the PVS burden and that after the seizure onset, the PVS burden gradually decreased with time. 66 This could be explained by the release of tau protein in response to axonal injury caused by the seizure. 68 , 69 Thus, an accumulation of tau in the brain could cause an enlargement of the PVS and poor drainage via the glymphatic system.
Imaging of the glymphatic system has shown that drainage is impaired after a mild traumatic brain injury (TBI). 70 , 71 Li et al found that in rats with mild TBI, the suppression of normal glymphatic drainage indicated a persistent injury of the brain. 70 Additionally, Koo et al found that a high burden of PVS in the centrum semiovale detected by MRI indicated a greater chance of developing subdural fluid. 72 This is likely due to the poor glymphatic function leaving the brain susceptible to the accumulation of toxic proteins and metabolites, causing further neuronal damage after the initial traumatic event.
The glymphatic drainage has also been studied in idiopathic normal pressure hydrocephalus. Studies have found delayed clearance of tracers via the glymphatic system in these patients. 13 , 25 , 73 , 74 Therefore, poor glymphatic drainage may contribute to the development of the disease. PVS may be a useful marker for the glymphatic function and could potentially aid in diagnosis of these patients on imaging. However, to date, no studies have measured PVS in a cohort of patients with idiopathic normal pressure hydrocephalus.
Barisano et al studied PVS in a cohort of astronauts from NASA and the European Space Agency, and cosmonauts from Roscosmos. They measured the PVS burden for these participants prior to their mission, and after their 6‐month residency on the International Space Station. They found increased PVS burden in both the basal ganglia and white matter (WM) after their spaceflight. Additionally, those who developed spaceflight associated neuro‐ocular syndrome (SANS) had larger WM PVS volumes pre‐ and post‐spaceflight when compared to astronauts who did not develop SANS. 75
Overall, PVS have been implicated in a wide range of diseases. Accurate methods for PVS detection are required to further investigate the role of the glymphatic system in disease pathogenesis and progression.
Visual Rating Scales to Measure PVS
The initial studies investigating PVS burden counted the number of PVS observed on MRI. This remains the gold standard for assessing PVS burden, however, it is very time consuming. Subsequently, numerous visual rating scales have been developed to simplify and standardize the measurement of PVS. 31 , 58 , 60 , 76 , 77 , 78 The most widely utilized is Wardlaw et al's STRIVE criteria. 31 This criterion involves manually counting PVS on selected slices from the centrum semiovale, basal ganglia, and midbrain on brain MRI scans. Using these manual counts, the scan is then assigned a category on Wardlaw's PVS scale to quantify the PVS burden (Fig. 5). 76
FIGURE 5.

Wardlaw Rating Scale. Wardlaw et al's STRIVE criteria define a PVS on MRI imaging as a fluid‐filled space of similar intensity to CSF on all imaging modalities. They can appear as either linear or ovoid/round depending on the orientation of the vessel it surrounds. 31 PVS are typically <3 mm; however, sizes >1.5 cm have been reported. 79 This criterion involves visually assessing MRI scans of the brain, taking slices from the centrum semiovale, basal ganglia, and midbrain. After selecting the axial slice with highest PVS burden assessed visually, the number of PVS are manually counted to assign the scan into a category on Wardlaw's PVS scale. Examples of a scan placed in category 1 is shown on the left with few PVS visible, and an example of a scan placed in category 4 is shown on the right with large numbers of PVS visible. MRI = magnetic resonance imaging; CSF = cerebrospinal fluid; PVS = perivascular spaces; EPVS = enlarged perivascular spaces.
There are many limitations associated with visually evaluating PVS, described in Table 1. Automated quantification allows for more accurate measurement of enlarged PVS and may allow the use of PVS as a biomarker for disease progression.
TABLE 1.
Limitations of Visual Rating Scales
| Limitation | Explanation |
|---|---|
| Difficult to Identify | PVS share features with other markers of cerebral vessel disease, such as lacunar infarcts or white matter lesions. It may be hard to distinguish between these lesions based on visual examination alone. 35 , 80 |
| Time consuming | Manually assessing MRI sequences is extremely time‐consuming and, therefore, may not be feasible for larger data sets. 35 , 80 , 81 Most visual rating scales reduce the time burden by only measuring the PVS in a single axial slice. However, Ramirez et al showed that saving time by only analyzing a single hemisphere of a single slice resulted in reduced generalizability of the results. 32 |
| Detection bias | There is a large risk for detection bias as results can be varied depending on the investigators' skills and experience. Ramirez et al found poor interrater reliability when utilizing the manual Wardlaw rating scale (ICC = 0.54). 32 More experienced investigators are more likely to visualize PVS and therefore place scans in a higher category. 35 Additionally, visual inspection may miss true positives, which are more readily identified by automated methods |
| Floor and ceiling effects | Visual rating scales correlate the number of PVS with a scoring category. The lower and upper echelon for these categories involves either no PVS seen or more than a certain number visualized. Thus, assessors are encouraged to place a scan in the lowest category if they cannot visualize any PVS or in the highest category if they visualize many PVS. This may limit the results of the study due to floor and ceiling effects. 32 , 82 , 83 |
| Cannot be used for longitudinal studies | The categorical nature of the visual rating scales means you are comparing scans based on their category and not their number of PVS. If the number of PVS increases over time but within the same category, it will not identify any change over time. Currently, all studies using visual rating scales are cross‐sectional. 60 , 77 , 84 |
| Requires high‐quality images | Visualizations of the PVS relies on high‐quality images with good resolution to ensure PVS are not missed during the counting process. Results using these visual rating scales may be inaccurate if using images with poorer resolution. 84 |
| Cannot assess the volume | Visual rating scores of PVS also do not provide any meaningful information regarding volume. The volume of an enlarged PVS may be useful in assessing any changes to PVS longitudinally. 84 |
Automated Programs to Measure PVS
Numerous automated algorithms have been developed to improve the reliability of PVS measurement and its utility as a biomarker for the glymphatic system. 53 , 59 , 80 , 81 , 82 , 83 , 85 , 86 , 87 , 88 , 89 , 90 , 91 The development of these algorithms allowed for both the number of PVS (as is measured using visual rating scales) as well as the PVS volume to be calculated. Both these measurements have been interchangeably used as markers of PVS burden in the literature. 53 , 59 , 80 , 81 , 82 , 83 , 85 , 86 , 87 , 88 , 89 , 90 , 91 Multiple techniques have been attempted to develop an algorithm that is accurate and clinically applicable (Table 2, Fig. 6). These algorithms can be broadly categorized into intensity‐based thresholding approaches, which apply an intensity threshold to find PVS, vesselness‐filter approaches, which apply a filter to enhance tubular structures, and machine learning approaches, which learn patterns in labeled images indicative of PVS.
TABLE 2.
Automated Programs and Their Associated Advantages and Limitations
| Intensity‐Based Thresholding Approaches | ||||
|---|---|---|---|---|
| References | Method | Modalities | Advantages | Limitations |
| Ramirez et al 32 | The “Lesion Explorer” program, originally designed to exclude PVS from its analysis, to instead identify PVS using intensity thresholds |
|
|
|
| Wang et al 83 | Gamma correction and linear mapping |
|
|
|
| Cai et al 55 and Niazi et al 59 | Edge detection and k‐means clustering |
|
|
|
| Boesplfug et al 88 and Schwartz et al 81 | MAPS that assesses the relative intensity of neighboring voxels and then uses a linearity model to identify PVS |
|
|
|
| Vesselness Filter Approaches | ||||
|---|---|---|---|---|
| References | Method | Modalities | Advantages | Limitations |
| Sepehrband et al. 82 | Enhanced contrast then Frangi filter to identify PVS based on “vesselness” |
|
|
|
| Ballerini et al 89 | Ordered logit models then Frangi filter to identify PVS based on “vesselness” |
|
|
|
| Combination of Intensity and Vesselness Approaches | ||||
|---|---|---|---|---|
| References | Method | Modalities | Advantages | Limitations |
| Spijkerman et al 85 | Binary kNN (k nearest neighbor) classifier and vesselness values |
|
|
|
| Machine Learning Approaches | ||||
|---|---|---|---|---|
| References | Method | Modalities | Advantages | Limitations |
| Park et al 91 Hou et al. 90 | Machine learning using a random forest model with randomized 3D Haar features |
|
|
|
| Boutinaud et al 92 | Machine learning using a Convolutional Autoencoder and a U‐Shaped Neural Network |
|
|
|
| Dubost et al. 80 | Machine learning using a convolutional neural network regression model |
|
|
|
| Lian et al 93 | Machine learning using a fully convolutional neural network |
|
|
|
MRI = magnetic resonance imaging; T1w = T1 weighted; T2w = T2 weighted; PD = proton density; FLAIR = fluid‐attenuated inversion recovery; T = tesla.
FIGURE 6.
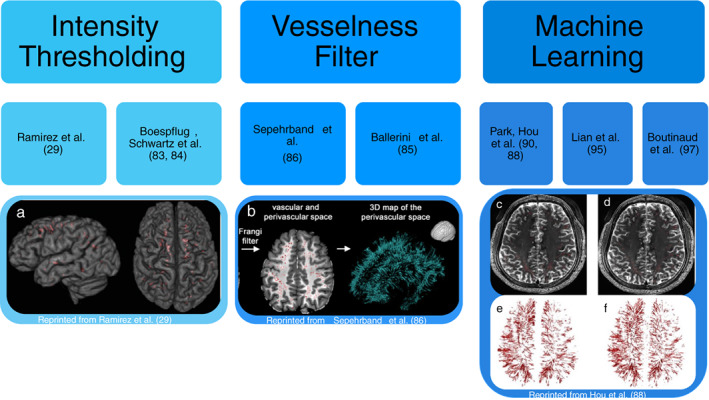
Automated PVS detection methods. The three main techniques for automated PVS segmentation are shown with their associated literature: intensity thresholding, vesselness filter, and machine learning. (a) The final PVS mask created from the lesion explorer program using intensity‐based thresholds to identify PVS. 32 (b) The final PVS mask created using enhanced PVS contrast and the Frangi filter to identify PVS based off vesselness. 82 (c) The ground truth PVS mask. (d) The final PVS mask created using the Haar transform of nonlocal cubes and block‐matching filtering. (e) The 3D rendering of the ground truth PVS mask. (f) The 3D rendering of the final PVS mask using the Haar transform of nonlocal cubes and block‐matching filtering machine learning technique. 90
Intensity‐Based Thresholding Approaches
Ramirez et al used the “Lesion Explorer” program, originally designed to exclude PVS from its analysis, to instead identify PVS using intensity thresholds. 32 This program requires manual input of thresholds, which can be subjective and may differ depending on both the investigator and the quality of the individual scans. 91 Wang et al also used a semi‐automated program to measure the volume and number of PVS. They found a large variance for the intensity levels of PVS on T2w images within their dataset, so they adjusted their intensity thresholds in three stages. First, normalization to change the range of intensity values utilized, then they applied a gamma correction factor of 2, and finally they used linear mapping to follow the PVS along its entire length between each axial slice. 83 Niazi et al and Cai et al utilized edge detection and k‐means clustering to segment PVS. 55 , 59 In these studies, the requirement for a manual choice of parameters or editing of masks can be time consuming and may introduce interobserver variability between investigators and studies. Ramirez et al and Wang et al used images from a 1.5 T scanner and 2D methods, which means the program may not be optimized for 3 T images that are more sensitive to detecting PVS. 32 , 83 Analysis of PVS in a 3D computational algorithm, such as that proposed by Niazi et al 59 and Cai et al, 55 rather than Ramirez et al 32 and Wang et al, 83 would be more useful in detecting PVS which often travel in varying directions.
Fully automated algorithms have been developed to reduce the need for manual inputs such as the Multimodal Autoidentification of Perivascular Spaces (MAPS) created by Boesplfug et al 88 and Schwartz et al. 81 MAPS identifies PVS using features including their relative intensity to surrounding voxels, cluster size, and degree of linearity. MAPS is beneficial in showcasing the distribution of PVS in a 3D manner and therefore has a greater ability to detect more subtle changes in PVS longitudinally. One limitation of this algorithm, however, is the need for manual input to visually confirm successful co‐registration to ensure there are no omissions of PVS during the white matter extraction. Additionally, the original program required four volumetric sequences (T1w, T2w, FLAIR, and proton density MRI scans) for the program to run. 88 In clinical practice, often only one volumetric sequence is obtained. Although multiple volumetric sequences can improve the certainty of identifying PVS, it also introduces more artifacts into the image as the patient has to spend more time in the scanner. 94 Subsequent modifications to the algorithm to use fewer sequences (T1w and FLAIR MRI scans only) have demonstrated promising results with a positive predictive value of 77.5% in a cohort of older dementia‐free adults (aged 70–101 years) and 87.5% in a different cohort of older adults (aged 58–92 years), indicating a high true positive rate for detecting PVS. 81 This algorithm, however, currently can only be used to assess PVS in white matter as it relies strongly on local intensity contrast, which is lower in other areas of the brain. Since PVS have been found to be significant in other areas of the brain, particularly the basal ganglia and midbrain, 95 , 96 it would be useful to develop a program that can measure the PVS burden in these regions as well.
Vesselness Filter Approaches
There have been numerous automated programs created utilizing the Frangi filter 97 to detect PVS based on vesselness rather than on linearity. 82 , 86 , 89 The Frangi filter utilizes a hessian matrix to find the principal directions of the second‐order structures in the image. 97 This can be used to identify the long tubular structures and has been shown to increase the specificity of identifying PVS. 89 Ballerini et al utilized ordered logit models to evaluate what parameters are required from the Frangi filter to obtain the greatest likelihood that a structure is a PVS in the centrum semiovale. 89 The program showed a high concordance with visual rating scores (r = 0.75). Sepehrband et al improved detection of PVS by enhancing the intensity profiles during the postprocessing step termed “enhanced PVS contrast” (EPC), by combining T1‐ and T2‐weighted images. Their results showed that their EPC enabled greater detection of PVS compared to using a single image contrast. 82 Their program also required multiple volumetric sequences, improving the accuracy but making clinical translation challenging. There was significant variance when comparing the automatic program on different imaging modalities within the study data. The number of PVS quantified varied significantly depending on the MRI sequence utilized (P = 6.3 × 10⁻¹⁹). 82 Thus, the program must be applied to the same imaging modality across the dataset. Additionally, the automated program requires T1w and T2w scans to be taken at the same resolution. This limits its use in clinical practice, as these scans are often acquired at different axial slice thicknesses. 82
Combination of Vesselness and Intensity Approaches
Spijkerman et al used a combination of intensity and vesselness parameters to identify PVS and measure the number of PVS in a single slice. They applied their method to a dataset of healthy individuals aged 27–78 years with 7 T MRI scans available. They achieved a dice score of 0.61 and a count correlation of 0.76. 85 Although, Spijkerman et al were only able to measure PVS counts in a 2D slice, which could be useful for comparisons with manual rating scores. 31 However, this approach does not provide an assessment of the PVS burden for the entire brain volume. Additionally, greater similarity to the ground‐truth (measured by the dice score) have been achieved by utilizing machine learning approaches. 91 , 93
Machine Learning Approaches
Numerous machine learning approaches have been used to measure PVS burden. 55 , 80 , 85 , 87 , 90 , 91 , 98 Park et al used a random forest model with randomized 3D Haar features to extract the tubular structures of PVS. 91 This learning‐based model has the advantage of not requiring manual input to set the intensity thresholds thus improving the segmentation accuracy. This also allows the program to be used on different datasets scanned by different machines. Park et al tested their method against intensity thresholding, vesselness thresholding and learning‐based methods using the conventional Haar features. They found that their method most resembled the ground‐truth in respect to distribution and detection of true PVS. Their study analyzed high‐resolution MR images from healthy young individuals who have lower PVS burden than aged populations. Therefore, it is hard to ascertain whether this trained algorithm would generalize to older populations with a much greater number of PVS. Zhang et al used a structured random forest model with vascularity filters to differentiate the PVS from its background with an entropy‐based sampling to train their model. 87 This achieved a similar performance (dice score of 0.66) to the random forest model with randomized 3D Haar features described by Park et al. (dice score of 0.64). 87 , 91 Hou et al describe a method of enhancing MR images to better identify and analyze PVS prior to using the previous algorithm created by Park et al 90 Their enhanced and denoised images produced the best results for PVS segmentation. There were, however, errors at the border of white matter and gray matter where the thin edges appeared similar to the structures of PVS. Additionally, they had a small study cohort of 17 MRI scans affecting the parameters used for intensity ranges. Moreover, due to the extremely high resolution of the images, scans may pick up nonenlarged PVS and deep medullary veins. Deep medullary veins can be mistaken for PVS by these programs due to their similar intensities and therefore would require manual observer correction. 89 These studies utilized 7 T MR imaging, which is a useful tool in research as it produces extremely high‐resolution images. However, 7 T is rarely used clinically, so the clinical translation of research at 7 T is limited at the present time.
A machine learning approach using an autoencoder and U‐shaped network was created by Boutinaud et al. 92 They applied their algorithm on a dataset of T1w MRIs taken from a 3 T scanner of healthy young adults. This method had an average performance producing a dice score of 0.64. However, an advantage was this method was able to be used on different datasets taken from different scanners. Another machine learning approach is the use of a convolutional neural network to identify PVS. 80 , 93 Dubost et al used a convolutional neural network regression method to quantify PVS in the basal ganglia in T2w MRI scans acquired on a 1.5 T scanner. They found a high intraclass correlation coefficient between the visual scores and automated scores. 80 Lian et al used a fully convolutional neural network (FCNN) machine learning approach on a dataset of T2w MRIs acquired on a 7 T scanner. 93 Their FCNN approach had no requirement for manual inputs to measure PVS in a cohort of healthy subjects aged from 25 to 55 years. They compared their results to other available methods for PVS segmentation including using the Frangi vesselness filter, structured random forest machine learning approach and a U‐net machine learning approach. They found that their method was superior (dice score of 0.77 using the FCNN compared to 0.53 using the Frangi filter, 0.67 using the structured forest approach and 0.72 U‐net approach). An advantage of this algorithm was that it was able to detect PVS in the entire brain volume. Although, it did detect some false positives around the ventricles. Lian et al propose that using a reliable white matter mask could reduce the number of false positives, 93 but this comes at the cost of only detecting the PVS burden in part of the brain. Additionally, this method could not detect PVS where the difference in contrast between the PVS and the surrounding tissue was low. Their FCNN may not be applicable to scan resolutions typically seen in clinical practice, which have poorer contrast to noise ratios. Thus, there is still a need for a clinically applicable automated method for measuring PVS.
Conclusion
There is increasing evidence that PVS are a marker of reduced glymphatic flow and may be a useful biomarker in a large range of diseases. Efforts have been made to image the glymphatic system using two‐photon laser microscopy, contrast‐enhanced MRI and diffusion tensor imaging. PVS can be visualized on standard MRI sequences when enlarged and may be a useful biomarker for glymphatic function. Application of various image processing methodologies to the identification of PVS on MRI is enabling automatic detection of PVS negating the need for manual counting of PVS. To date, automated algorithms have been tested in young healthy populations and are limited by the need for multiple volumetric sequences or imaging at 7 T, neither of which are common in routine clinical practice. Future studies should focus on validating these algorithms for use on routine clinical imaging data, such as volumetric T1w MRIs taken on 3 T scanners, and in disease populations.
Acknowledgment
Open access publishing facilitated by Monash University, as part of the Wiley ‐ Monash University agreement via the Council of Australian University Librarians.
References
- 1. Troili F, Cipollini V, Moci M, et al. Perivascular unit: This must be the place. The anatomical crossroad between the immune vascular and nervous system. Front Neuroanat 2020;14:17. [DOI] [PMC free article] [PubMed] [Google Scholar]
- 2. Nedergaard M, Goldman SA. Brain drain. Sci Am 2016;314(3):44‐49. [DOI] [PMC free article] [PubMed] [Google Scholar]
- 3. Woollam DH, Millen JW. The perivascular spaces of the mammalian central nervous system and their relation to the perineuronal and subarachnoid spaces. J Anat 1955;89(2):193‐200. [PMC free article] [PubMed] [Google Scholar]
- 4. Iliff JJ, Wang M, Liao Y, et al. A paravascular pathway facilitates CSF flow through the brain parenchyma and the clearance of interstitial solutes, including amyloid β. Sci Transl Med 2012;4(147):147ra111. [DOI] [PMC free article] [PubMed] [Google Scholar]
- 5. Iliff JJ, Lee H, Yu M, et al. Brain‐wide pathway for waste clearance captured by contrast‐enhanced MRI. J Clin Invest 2013;123(3):1299‐1309. [DOI] [PMC free article] [PubMed] [Google Scholar]
- 6. Taoka T, Naganawa S. Neurofluid dynamics and the Glymphatic system: A neuroimaging perspective. Korean J Radiol 2020;21(11):1199. [DOI] [PMC free article] [PubMed] [Google Scholar]
- 7. Albayram MS, Smith G, Tufan F, et al. Non‐invasive MR imaging of human brain lymphatic networks with connections to cervical lymph nodes. Nat Commun 2022;13(1):1‐14. [DOI] [PMC free article] [PubMed] [Google Scholar]
- 8. Deramecourt V, Slade JY, Oakley AE, et al. Staging and natural history of cerebrovascular pathology in dementia. Neurology 2012;78(14):1043‐1050. [DOI] [PMC free article] [PubMed] [Google Scholar]
- 9. Benninger RKP, Piston DW. Two‐photon excitation microscopy for the study of living cells and tissues. Curr Protoc Cell Biol 2013;59:4. [DOI] [PMC free article] [PubMed] [Google Scholar]
- 10. Samaranch L, Bringas J, Pivirotto P, Sebastian WS, Forsayeth J, Bankiewicz K. Cerebellomedullary cistern delivery for AAV‐based gene therapy: A technical note for nonhuman primates. Hum Gene Ther Methods 2016;27(1):13‐16. [DOI] [PMC free article] [PubMed] [Google Scholar]
- 11. Taghian T, Marosfoi MG, Puri AS, et al. A safe and reliable technique for CNS delivery of AAV vectors in the cisterna magna. Mol Ther 2020;28(2):411‐421. [DOI] [PMC free article] [PubMed] [Google Scholar]
- 12. Zhou Y, Cai J, Zhang W, et al. Impairment of the glymphatic pathway and putative meningeal lymphatic vessels in the aging human. Ann Neurol 2020;87(3):357‐369. [DOI] [PubMed] [Google Scholar]
- 13. Ringstad G, Mardal K, Eide PK, et al. Brain‐wide glymphatic enhancement and clearance in humans assessed with MRI. JCI Insight 2018;3(13):e121537. [DOI] [PMC free article] [PubMed] [Google Scholar]
- 14. Aydin K, Terzibasioglu E, Sencer S, et al. Localization of cerebrospinal fluid leaks by gadolinium‐enhanced magnetic resonance cisternography: A 5‐year single‐center experience. Neurosurgery 2008;62(3):584‐589. [DOI] [PubMed] [Google Scholar]
- 15. Eide PK, Ringstad G. MRI with intrathecal MRI gadolinium contrast medium administration: A possible method to assess glymphatic function in human brain. Acta Radiol Open 2015;4(11):205846011560963. [DOI] [PMC free article] [PubMed] [Google Scholar]
- 16. Staats PS. Complications of intrathecal therapy. Pain Med 2008;9(suppl 1):S102‐S107. [Google Scholar]
- 17. Schick U, Musahl C, Papke K. Diagnostics and treatment of spontaneous intracranial hypotension. Minim Invasive Neurosurg 2010;53(1):15‐20. [DOI] [PubMed] [Google Scholar]
- 18. Algin O, Turkbey B. Intrathecal gadolinium‐enhanced MR cisternography: A comprehensive review. Am J Neuroradiol 2013;34(1):14‐22. [DOI] [PMC free article] [PubMed] [Google Scholar]
- 19. Naganawa S, Nakane T, Kawai H, Taoka T. Differences in signal intensity and enhancement on MR images of the perivascular spaces in the basal ganglia versus those in white matter. Magn Reson Med Sci 2018;17(4):301‐307. [DOI] [PMC free article] [PubMed] [Google Scholar]
- 20. Ohashi T, Naganawa S, Katagiri T, Kuno K. Relationship between contrast enhancement of the perivascular space in the basal ganglia and endolymphatic volume ratio. Magn Reson Med Sci 2018;17(1):67‐72. [DOI] [PMC free article] [PubMed] [Google Scholar]
- 21. Naganawa S, Nakane T, Kawai H, Taoka T. Lack of contrast enhancement in a giant perivascular space of the basal ganglion on delayed FLAIR images: Implications for the glymphatic system. Magn Reson Med Sci 2017;16(2):89‐90. [DOI] [PMC free article] [PubMed] [Google Scholar]
- 22. Naganawa S, Nakane T, Kawai H, Taoka T. Gd‐based contrast enhancement of the perivascular spaces in the basal ganglia. Magn Reson Med Sci 2017;16(1):61‐65. [DOI] [PMC free article] [PubMed] [Google Scholar]
- 23. Ohashi T, Naganawa S, Ogawa E, Katagiri T, Kuno K. Signal intensity of the cerebrospinal fluid after intravenous administration of gadolinium‐based contrast agents: Strong contrast enhancement around the vein of Labbe. Magn Reson Med Sci 2019;18(3):194‐199. [DOI] [PMC free article] [PubMed] [Google Scholar]
- 24. Biagioni E, Coloretti I, Disalvo F, et al. Case report of a patient who survived after cardiac arrest and cardiogenic shock by anaphylactic reaction to gadolinium during magnetic resonance imaging. Radiol Case Rep 2020;15(3):266‐268. [DOI] [PMC free article] [PubMed] [Google Scholar]
- 25. Yokota H, Vijayasarathi A, Cekic M, et al. Diagnostic performance of Glymphatic system evaluation using diffusion tensor imaging in idiopathic Normal pressure hydrocephalus and mimickers. Curr Gerontol Geriatr Res 2019;2019:5675014. [DOI] [PMC free article] [PubMed] [Google Scholar]
- 26. Yang G, Deng N, Liu Y, Gu Y, Yao X. Evaluation of glymphatic system using diffusion MR technique in T2DM cases. Front Hum Neurosci 2020;14:300. [DOI] [PMC free article] [PubMed] [Google Scholar]
- 27. Steward CE, Venkatraman VK, Lui E, et al. Assessment of the DTI‐ALPS parameter along the perivascular space in older adults at risk of dementia. J Neuroimaging 2021;31(3):569‐578. [DOI] [PubMed] [Google Scholar]
- 28. Wardlaw JM, Benveniste H, Nedergaard M, et al. Perivascular spaces in the brain: Anatomy, physiology and pathology. Nat Rev Neurol 2020;16(3):137‐153. [DOI] [PubMed] [Google Scholar]
- 29. Shams S, Martola J, Charidimou A, et al. Topography and determinants of magnetic resonance imaging (MRI)‐visible perivascular spaces in a large memory clinic cohort. J Am Heart Assoc 2017;6(9):e006279. [DOI] [PMC free article] [PubMed] [Google Scholar]
- 30. Banerjee G, Kim HJ, Fox Z, et al. MRI‐visible perivascular space location is associated with Alzheimer's disease independently of amyloid burden. Brain 2017;140(4):1107‐1116. [DOI] [PubMed] [Google Scholar]
- 31. Wardlaw JM, Smith EE, Biessels GJ, et al. Neuroimaging standards for research into small vessel disease and its contribution to ageing and neurodegeneration. Lancet Neurol 2013;12(8):822‐838. [DOI] [PMC free article] [PubMed] [Google Scholar]
- 32. Ramirez J, Berezuk C, McNeely AA, Scott CJM, Gao F, Black SE. Visible Virchow‐Robin spaces on magnetic resonance imaging of Alzheimer's disease patients and normal elderly from the Sunnybrook dementia study. J Alzheimer's Dis 2014;43(2):415‐424. [DOI] [PubMed] [Google Scholar]
- 33. Peng W, Achariyar TM, Li B, et al. Suppression of glymphatic fluid transport in a mouse model of Alzheimer's disease. Neurobiol Dis 2016;93:215‐225. [DOI] [PMC free article] [PubMed] [Google Scholar]
- 34. Weller RO, Boche D, Nicoll JAR. Microvasculature changes and cerebral amyloid angiopathy in Alzheimer's disease and their potential impact on therapy. Acta Neuropathologica 2009;118:87‐102. [DOI] [PubMed] [Google Scholar]
- 35. Potter GM, Chappell FM, Morris Z, Wardlaw JM. Cerebral perivascular spaces visible on magnetic resonance imaging: Development of a Qualitative Rating Scale and its observer reliability. Cerebrovasc Dis 2015;39:224‐231. [DOI] [PMC free article] [PubMed] [Google Scholar]
- 36. Roher AE, Kuo Y‐M, Esh C, et al. Cortical and leptomeningeal cerebrovascular amyloid and white matter pathology in Alzheimer's disease. Mol Med 2003;9(3–4):112‐122. [PMC free article] [PubMed] [Google Scholar]
- 37. Mestre H, Kostrikov S, Mehta RI, Nedergaard M. Perivascular spaces, glymphatic dysfunction, and small vessel disease. Clin Sci 2017;131:2257‐2274. [DOI] [PMC free article] [PubMed] [Google Scholar]
- 38. Kress BT, Iliff JJ, Xia M, et al. Impairment of paravascular clearance pathways in the aging brain. Ann Neurol 2014;76(6):845‐861. [DOI] [PMC free article] [PubMed] [Google Scholar]
- 39. Wyss‐Coray T. Ageing, neurodegeneration and brain rejuvenation. Nature 2016;539:180‐186. [DOI] [PMC free article] [PubMed] [Google Scholar]
- 40. Weller RO, Subash M, Preston SD, Mazanti I, Carare RO. Perivascular drainage of amyloid‐b peptides from the brain and its failure in cerebral amyloid angiopathy and Alzheimer's disease. Brain Pathol 2008;18(2):253‐266. [DOI] [PMC free article] [PubMed] [Google Scholar]
- 41. Carare RO, Bernardes‐Silva M, Newman TA, et al. Solutes, but not cells, drain from the brain parenchyma along basement membranes of capillaries and arteries: Significance for cerebral amyloid angiopathy and neuroimmunology. Neuropathol Appl Neurobiol 2008;34(2):131‐144. [DOI] [PubMed] [Google Scholar]
- 42. Iliff JJ, Chen MJ, Plog BA, et al. Impairment of Glymphatic pathway function promotes tau pathology after traumatic brain injury. J Neurosci 2014;34(49):16180‐16193. [DOI] [PMC free article] [PubMed] [Google Scholar]
- 43. Patel TK, Habimana‐Griffin L, Gao X, et al. Dural lymphatics regulate clearance of extracellular tau from the CNS. Mol Neurodegener 2019;14(1):11. [DOI] [PMC free article] [PubMed] [Google Scholar]
- 44. George IC, Arrighi‐Allisan A, Delman BN, Balchandani P, Horng S, Feldman R. A novel method to measure venular perivascular spaces in patients with MS on 7T MRI. Am J Neuroradiol 2021;42(6):1069‐1072. [DOI] [PMC free article] [PubMed] [Google Scholar]
- 45. Wuerfel J, Haertle M, Waiczies H, et al. Perivascular spaces‐‐MRI marker of inflammatory activity in the brain? Brain 2008;131(9):2332‐2340. [DOI] [PubMed] [Google Scholar]
- 46. Conforti R, Cirillo M, Saturnino PP, et al. Dilated Virchow–Robin spaces and multiple sclerosis: 3 T magnetic resonance study. Radiol Med 2014;119(6):408‐414. [DOI] [PubMed] [Google Scholar]
- 47. Etemadifar M, Hekmatnia A, Tayari N, et al. Features of Virchow‐Robin spaces in newly diagnosed multiple sclerosis patients. Eur J Radiol 2011;80(2):e104‐e108. [DOI] [PubMed] [Google Scholar]
- 48. Achiron A, Faibel M. Sandlike appearance of Virchow‐Robin spaces in early multiple sclerosis: A novel neuroradiologic marker. Am J Neuroradiol 2002;23(3):376‐380. [PMC free article] [PubMed] [Google Scholar]
- 49. Shen T, Yue Y, Zhao S, et al. The role of brain perivascular space burden in early‐stage Parkinson's disease. NPJ Parkinsons Dis 2021;7(1):12. 10.1038/s41531-021-00155-0. [DOI] [PMC free article] [PubMed] [Google Scholar]
- 50. Shibata K, Sugiura M, Nishimura Y, Sakura H. The effect of small vessel disease on motor and cognitive function in Parkinson's disease. Clin Neurol Neurosurg 2019;182:58‐62. [DOI] [PubMed] [Google Scholar]
- 51. Bouvy WH, Zwanenburg JJM, Reinink R, et al. Perivascular spaces on 7 tesla brain MRI are related to markers of small vessel disease but not to age or cardiovascular risk factors. J Cereb Blood Flow Metab 2016;36(10):1708‐1717. [DOI] [PMC free article] [PubMed] [Google Scholar]
- 52. Sundaram S, Hughes RL, Peterson E, et al. Establishing a framework for neuropathological correlates and glymphatic system functioning in Parkinson's disease. Neurosci Biobehav Rev 2019;103:305‐315. [DOI] [PMC free article] [PubMed] [Google Scholar]
- 53. Ramirez J, Berezuk C, McNeely AA, Gao F, McLaurin JA, Black SE. Imaging the perivascular space as a potential biomarker of neurovascular and neurodegenerative diseases. Cell Mol Neurobiol 2016;36:289‐299. [DOI] [PMC free article] [PubMed] [Google Scholar]
- 54. Raz L, Knoefel J, Bhaskar K. The neuropathology and cerebrovascular mechanisms of dementia. J Cereb Blood Flow Metab 2016;36(1):172‐186. [DOI] [PMC free article] [PubMed] [Google Scholar]
- 55. Cai K, Tain R, Das S, et al. The feasibility of quantitative MRI of perivascular spaces at 7 T. J Neurosci Methods 2015;256:151‐156. [DOI] [PMC free article] [PubMed] [Google Scholar]
- 56. Hansen TP, Cain J, Thomas O, Jackson A. Dilated perivascular spaces in the basal ganglia are a biomarker of small‐vessel disease in a very elderly population with dementia. Am J Neuroradiol 2015;36(5):893‐898. [DOI] [PMC free article] [PubMed] [Google Scholar]
- 57. Boespflug EL, Simon MJ, Leonard E, et al. Targeted assessment of enlargement of the perivascular space in Alzheimer's disease and vascular dementia subtypes implicates astroglial involvement specific to Alzheimer's disease. Alzheimer's Dis 2018;66(4):1587‐1597. [DOI] [PMC free article] [PubMed] [Google Scholar]
- 58. Chen W, Song X, Zhang Y. Assessment of the Virchow‐Robin spaces in Alzheimer disease, mild cognitive impairment, and normal aging, using high‐field MR imaging. Am J Neuroradiol 2011. Sep;32(8):1490‐1495. [DOI] [PMC free article] [PubMed] [Google Scholar]
- 59. Niazi M, Karaman M, Das S, Zhou XJ, Yushkevich P, Cai K. Quantitative MRI of perivascular spaces at 3T for early diagnosis of mild cognitive impairment. Am J Neuroradiol 2018;39(9):1622‐1628. [DOI] [PMC free article] [PubMed] [Google Scholar]
- 60. Patankar TF, Mitra D, Varma A, Snowden J, Neary D, Jackson A. Dilatation of the Virchow‐Robin space is a sensitive indicator of cerebral microvascular disease: Study in elderly patients with dementia. AJNR Am J Neuroradiol 2005;26(6):1512‐1520. [PMC free article] [PubMed] [Google Scholar]
- 61. Lyndon D, Davagnanam I, Wilson D, et al. MRI‐visible perivascular spaces as an imaging biomarker in Fabry disease. J Neurol 2021;268(3):872‐878. [DOI] [PMC free article] [PubMed] [Google Scholar]
- 62. Fang Y, Qin T, Liu W, et al. Cerebral small‐vessel disease and risk of incidence of depression: A meta‐analysis of longitudinal cohort studies. J Am Heart Assoc 2020;9(15):e016512. [DOI] [PMC free article] [PubMed] [Google Scholar]
- 63. Spalice A, Guido CA, Nicita F, Di BC, Zicari AM, Giannini L. Dilated Virchow‐Robin spaces in children with seizures. A possible correlation? Med Hypotheses 2020;136:109481. [DOI] [PubMed] [Google Scholar]
- 64. Boxerman JL, Hawash K, Bali B, Clarke T, Rogg J, Pal DK. Is rolandic epilepsy associated with abnormal findings on cranial MRI? Epilepsy Res 2007;75(2–3):180‐185. [DOI] [PMC free article] [PubMed] [Google Scholar]
- 65. Wu D, Yang X, Zhong P, Ye X, Li C, Liu X. Insulin resistance is independently associated with enlarged perivascular space in the basal ganglia in nondiabetic healthy elderly population. Am J Alzheimer's Dis Other Demenr 2020;35:153331752091212. [DOI] [PMC free article] [PubMed] [Google Scholar]
- 66. Liu C, Habib T, Salimeen M, et al. Quantification of visible Virchow–Robin spaces for detecting the functional status of the glymphatic system in children with newly diagnosed idiopathic generalized epilepsy. Seizure 2020;78:12‐17. [DOI] [PubMed] [Google Scholar]
- 67. Betting LE, Mory SB, Lopes‐Cendes I, et al. MRI reveals structural abnormalities in patients with idiopathic generalized epilepsy. Neurology 2006;67(5):848‐852. [DOI] [PubMed] [Google Scholar]
- 68. Dadas A, Washington J, Janigro D. Cerebral waste accumulation and glymphatic clearance as mechanisms of human neurological diseases. J Neurol Neuromedicine 2016;1(7):15‐19. [DOI] [PMC free article] [PubMed] [Google Scholar]
- 69. Puvenna V, Engeler M, Banjara M, et al. Is phosphorylated tau unique to chronic traumatic encephalopathy? Phosphorylated tau in epileptic brain and chronic traumatic encephalopathy. Brain Res 2016;1630:225‐240. [DOI] [PMC free article] [PubMed] [Google Scholar]
- 70. Li L, Chopp M, Ding G, et al. MRI detection of impairment of glymphatic function in rat after mild traumatic brain injury. Brain Res 2020;1747:147062. [DOI] [PMC free article] [PubMed] [Google Scholar]
- 71. Christensen J, Wright DK, Yamakawa GR, Shultz SR, Mychasiuk R. Repetitive mild traumatic brain injury alters Glymphatic clearance rates in limbic structures of adolescent female rats. Sci Rep 2020;10(1):1‐9. [DOI] [PMC free article] [PubMed] [Google Scholar]
- 72. Koo HW, Oh M, Kang HK, et al. High‐degree centrum semiovale‐perivascular spaces are associated with development of subdural fluid in mild traumatic brain injury. PLoS One 2019;14(9):e0221788. [DOI] [PMC free article] [PubMed] [Google Scholar]
- 73. Eide PK, Valnes LM, Pripp AH, Mardal K‐A, Ringstad G. Delayed clearance of cerebrospinal fluid tracer from choroid plexus in idiopathic normal pressure hydrocephalus. J Cereb Blood Flow Metab 2020;40(9):1849‐1858. [DOI] [PMC free article] [PubMed] [Google Scholar]
- 74. Jacobsen HH, Sandell T, Jørstad ØK, Moe MC, Ringstad G, Eide PK. In vivo evidence for impaired glymphatic function in the visual pathway of patients with normal pressure hydrocephalus. Investig Ophthalmol Vis Sci 2020;61(13):24. [DOI] [PMC free article] [PubMed] [Google Scholar]
- 75. Barisano G, Sepehrband F, Collins H, et al. The effect of prolonged spaceflight on cerebrospinal fluid and perivascular spaces of astronauts and cosmonauts. PNAS 2022;119:e2120439119. [DOI] [PMC free article] [PubMed] [Google Scholar]
- 76. Potter G, Morris Z, Wardlaw J. Enlarged perivascular spaces (EPVS): A visual rating scale and user. 1‐48.
- 77. Rowley HA. The alphabet of imaging in acute stroke does it spell improved selection and outcome? Stroke 2013;6:1732‐1735. [DOI] [PMC free article] [PubMed] [Google Scholar]
- 78. Laveskog A, Wang R, Bronge L, Wahlund LO, Qiu C. Perivascular spaces in old age: Assessment, distribution, and correlation with white matter hyperintensities. Am J Neuroradiol 2018;39(1):70‐76. [DOI] [PMC free article] [PubMed] [Google Scholar]
- 79. Salzman KL, Osborn AG, House P, et al. Giant tumefactive perivascular spaces. Am J Neuroradiol 2005;26:298‐305. [PMC free article] [PubMed] [Google Scholar]
- 80. Dubost F, Yilmaz P, Adams H, et al. Enlarged perivascular spaces in brain MRI: Automated quantification in four regions. Neuroimage 2019;185:534‐544. [DOI] [PubMed] [Google Scholar]
- 81. Schwartz DL, Boespflug EL, Lahna DL, Pollock J, Roese NE, Silbert LC. Autoidentification of perivascular spaces in white matter using clinical field strength T1 and FLAIR MR imaging. Neuroimage 2019;15(202):116126. [DOI] [PMC free article] [PubMed] [Google Scholar]
- 82. Sepehrband F, Barisano G, Sheikh‐Bahaei N, et al. Image processing approaches to enhance perivascular space visibility and quantification using MRI. Sci Rep 2019;9(1):1‐12. [DOI] [PMC free article] [PubMed] [Google Scholar]
- 83. Wang X, Valdés Hernández M d C, Doubal F, et al. Development and initial evaluation of a semi‐automatic approach to assess perivascular spaces on conventional magnetic resonance images. J Neurosci Methods 2016;257:34‐44. [DOI] [PMC free article] [PubMed] [Google Scholar]
- 84. Cavallari M, Egorova S, Healy BC, et al. Evaluating the association between enlarged perivascular spaces and disease worsening in multiple sclerosis. J Neuroimaging 2018;28(3):273‐277. [DOI] [PubMed] [Google Scholar]
- 85. Spijkerman JM, Zwanenburg JJM, Bouvy WH, et al. Automatic quantification of perivascular spaces in T2‐weighted images at 7 T MRI. Cereb Circ Cogn Behav 2022;3:100142. [DOI] [PMC free article] [PubMed] [Google Scholar]
- 86. Zong X, Park SH, Shen D, Lin W. Visualization of perivascular spaces in the human brain at 7 T: Sequence optimization and morphology characterization. Neuroimage 2016;125:895‐902. [DOI] [PubMed] [Google Scholar]
- 87. Zhang J, Gao Y, Park SH, Zong X, Lin W, Shen D. Structured learning for 3D perivascular spaces segmentation using vascular features. IEEE Trans Biomed Eng 2017;64(12):2803. [DOI] [PMC free article] [PubMed] [Google Scholar]
- 88. Boespflug EL, Schwartz DL, Lahna D, et al. MR imaging‐based multimodal autoidentification of perivascular spaces (mMAPS): Automated morphologic segmentation of enlarged perivascular spaces at clinical field strength. Radiology 2018;286(2):632‐642. [DOI] [PMC free article] [PubMed] [Google Scholar]
- 89. Ballerini L, Lovreglio R, Valdés Hernández MDC, et al. Perivascular spaces segmentation in brain MRI using optimal 3D filtering. Sci Rep 2018;8(1):1‐11. [DOI] [PMC free article] [PubMed] [Google Scholar]
- 90. Hou Y, Park SH, Wang Q, et al. Enhancement of perivascular spaces in 7 T MR image using Haar transform of non‐local cubes and block‐matching filtering. Sci Rep 2017;7(1):8569. [DOI] [PMC free article] [PubMed] [Google Scholar]
- 91. Park SH, Zong X, Gao Y, Lin W, Shen D. Segmentation of perivascular spaces in 7T MR image using auto‐context model with orientation‐normalized features HHS public access. Neuroimage 2016;134:223‐235. [DOI] [PMC free article] [PubMed] [Google Scholar]
- 92. Boutinaud P, Tsuchida A, Laurent A, et al. 3D segmentation of perivascular spaces on T1‐weighted 3 tesla MR images with a convolutional autoencoder and a U‐shaped neural network. Front Neuroinform 2021;15:641600. [DOI] [PMC free article] [PubMed] [Google Scholar]
- 93. Lian C, Zhang J, Liu M, et al. Multi‐channel multi‐scale fully convolutional network for 3D perivascular spaces segmentation in 7T MR images. Med Image Anal 2018;46:106‐117. [DOI] [PMC free article] [PubMed] [Google Scholar]
- 94. Zaitsev M, Maclaren J, Herbst M. Motion artifacts in MRI: A complex problem with many partial solutions. J Magn Reson Imag 2015;42:887‐901. [DOI] [PMC free article] [PubMed] [Google Scholar]
- 95. Pollock H, Hutchings M, Weller RO, Zhang E‐T. Perivascular spaces in the basal ganglia of the human brain: Their relationship to lacunes. J Anat 1997;191(3):337‐346. [DOI] [PMC free article] [PubMed] [Google Scholar]
- 96. Li Y, Zhu Z, Chen J, Zhang M, Yang Y, Huang P. Dilated perivascular space in the midbrain may reflect dopamine neuronal degeneration in Parkinson's disease. Front Aging Neurosci 2020;12:161. [DOI] [PMC free article] [PubMed] [Google Scholar]
- 97. Frangi AF, Niessen WJ, Vincken KL, Viergever MA. Multiscale vessel enhancement filtering. Lect Notes Comput Sci 1998;1496:130‐137. [Google Scholar]
- 98. Dubost F, Adams H, Bortsova G, et al. 3D regression neural network for the quantification of enlarged perivascular spaces in brain MRI. Med Image Anal 2019;51:89‐100. [DOI] [PubMed] [Google Scholar]