

Abstract
This study considers the exposure of the population of the most contaminated Gomel and Mogilev Oblasts in Belarus to prolonged sources of irradiation resulting from the Chernobyl accident. Dose reconstruction methods were developed and applied in this study to estimate the red bone-marrow doses (RBMs) from (i) external irradiation from gamma-emitting radionuclides deposited on the ground and (ii) 134Cs, 137Cs and 90Sr ingestion with locally produced foodstuffs. The mean population-weighted RBM doses accumulated during 35 years after the Chernobyl accident were 12 and 5.7 mGy for adult residents in Gomel and Mogilev Oblasts, respectively, while doses for youngest age groups were 20–40% lower. The highest mean area-specific RBM doses for adults accumulated in 1986–2021 were 63, 56 and 46 mGy in Narovlya, Vetka and Korma raions in Gomel Oblast, respectively. For most areas, external irradiation was the predominant pathway of exposure (60–70% from the total dose), except for areas with an extremely high aggregated 137Cs soil to cow’s milk transfer coefficient (≥ 5.0 Bq L−1 per kBq m−2), where the contribution of 134Cs and 137Cs ingestion to the total RBM dose was more than 70%. The contribution of 90Sr intake to the total RBM dose did not exceed 4% for adults and 10% for newborns in most raion in Gomel and Mogilev Oblasts. The validity of the doses estimated in this study was assessed by comparison with doses obtained from measurements by thermoluminescence dosimeters and whole-body counters done in 1987–2015. The methodology developed in this study can be used to calculate doses to target organs other than RBM such as thyroid and breast doses. The age-dependent and population-weighted doses estimated in this study are useful for ecological epidemiological studies, for projection of radiation risk, and for justification of analytical epidemiological studies in populations exposed to Chernobyl fallout.
Keywords: Chernobyl, Red bone marrow, External irradiation, Ingestion, 134Cs, 137Cs, 90Sr
Introduction
After the accident on the Chernobyl nuclear power plant (NPP), radiation doses to the population of Belarus resulted from (i) exposure to the thyroid gland from intake of 131I and short-lived 132I, 133I, 135I, 131mTe and 132Te, and prolonged sources of exposure from (ii) external irradiation from gamma-emitting radionuclides deposited on the ground, and (iii) internal irradiation from 134Cs, 137Cs and 90Sr intake with locally produced foodstuffs. The increase in the incidence of thyroid cancer among individuals exposed to the radioiodine isotopes at childhood and adolescence was the main health effect of the accident (UNSCEAR 2011). However, there is a need for post-Chernobyl radiation epidemiology studies to estimate doses from prolonged sources of exposure to organs other than the thyroid gland, e.g., red bone marrow (RBM) (Davis et al. 2006; Ivanov et al. 1996; Liubarets et al. 2019) or female breast (Cahoon et al. 2021; Rivkind et al. 2020; Zupunski et al. 2021).
Dose reconstruction models have been developed to assess the radiation doses from prolonged exposure pathways to the population living in Ukraine and the Russian Federation in the territories contaminated after the Chernobyl accident (e.g., Bruk et al. 1998; Golikov et al. 2002; Likhtarev et al. 2000, 2002; Travnikova et al. 2001). Similar work has been done in Belarus. This paper describes the corresponding methodology and provides dose estimates from prolonged sources of exposure accumulated over 35 years after the Chernobyl accident by the population of the most contaminated Gomel and Mogilev Oblasts1 in Belarus.
Materials and methods
Since 90Sr intake was considered a prolonged exposure pathway, radiation RBM doses from 90Sr intake were estimated in this study and combined with RBM doses from external irradiation and ingestion of radiocaesium isotopes to assess the overall doses to the exposed population resulting from all exposure pathways. The RBM doses from external irradiation and ingestion of radiocaesium isotopes correlate with doses absorbed in other radiation-sensitive organs, i.e., the thyroid gland and the female breast. Within the range of photon energy of major gamma-emitting radionuclides from Chernobyl fallout (0.2–2.3 MeV), the difference between external RBM doses and thyroid doses does not exceed 10%, while for female breast doses this difference does not exceed 15% (ICRP 2010). For internal doses from 134Cs ingestion, the difference between the RBM doses and thyroid doses is 0% and 20% for adults and newborns, respectively, while for breast doses this difference is 36% and 17% for the same age groups. The difference for doses from 137Cs ingestion is even smaller (ICRP 1993).
In the present study, mean values of the parameters of the dose reconstruction models were used to estimate mean doses to representative individuals of different ages for the settlement under consideration. From these values, the raion- and oblast-averaged population-weighted doses to representative individuals were calculated.
The following information was used to reconstruct the radiation doses from prolonged sources of exposure in Gomel and Mogilev Oblasts:
Gamma-spectrometric measurements of radionuclide activity concentrations, mainly of 95Zr, 95Nb, 103Ru, 106Ru, 131I, 134Cs, 136Cs, 137Cs, 140Ba, 140La, 141Ce, and 144Ce, in 5,652 soil samples performed from 6 May to 31 July 1986, and of 95Zr, 95Nb, 103Ru, 106Ru, 134Cs, 137Cs, 141Ce, and 144Ce in 4,526 soil samples performed from 1 August to 31 December 1986 (Drozdovitch et al. 2013);
137Cs ground deposition density measured in each settlement (SCHRB 2001);
90Sr ground deposition density measured in almost every settlement (SCHRB 1998);
134Cs, 137Cs and 90Sr activity concentrations derived from measurements of total beta-activity in 10,631 cow’s milk samples done between 29 April and 31 May 1986 (Minenko et al. 2020);
137Cs activity concentration measured in 60,247 samples of cow’s milk, potato, and other foodstuffs in 1986–1994 (MHRB 1992, 1994);
90Sr activity concentration measured in 3728 samples of cow’s milk and potato in 1987–1994 (MHRB 1992, 1994);
More than 650,000 whole-body counter (WBC) measurements of radiocaesium body-burden done in 1986–1996 (e.g., Drozdovitch et al. 1996; Drozdovitch and Minenko 1996; Minenko et al. 2006).
Table 1 summarizes the number of measurements done in Gomel and Mogilev Oblasts, which were used to derive the parameters of the dose reconstruction models, and the number of settlements in which the measurements were made. Although the measurements available in this study were performed in 1986–1996, around 75–85% of the doses received in 1986–2021 were realized during the first 10 years after the accident (Bouville et al. 2007).
Table 1.
Number of measurements done in Gomel and Mogilev Oblasts that were used in the present study to derive the parameters of the dose reconstruction models
| Type of measurements | Time period | Number of measurements |
Number of settlements where measurements were done |
||||
|---|---|---|---|---|---|---|---|
| Gomel Oblast | Mogilev Oblast | Total | Gomel Oblast | Mogilev Oblast | Total | ||
| Gamma-spectrometry of soila | 28 Apr 1986–31 July 1986 | 4025 | 1627 | 5652 | 560 | 315 | 875 |
| Gamma-spectrometry of soilb | 1 Aug 1986–28 Nov 1986 | 2628 | 1898 | 4526 | 467 | 250 | 717 |
| 137Cs deposition density | –c | – | – | – | 2707 | 3415 | 6122 |
| 90Sr deposition density | –c | – | – | – | 2450 | 2602 | 5052 |
| Total beta-activity in cow’s milkd | 29 Apr 1986–31 May 1986 | 9735 | 896 | 10,631 | 892 | 167 | 1059 |
| 137Cs activity in cow’s milk | 25 June 1986–06 Dec 1994 | 32,241 | 7540 | 39,781 | 1690 | 840 | 2530 |
| 137Cs activity in potato | 2 Sep 1986–06 Dec 1994 | 10,249 | 2034 | 12,283 | 1110 | 424 | 1534 |
| 137Cs activity in other foodstuffs | 25 June 1986–12 Apr 1993 | 8183 | – | 8183 | 412 | – | 412 |
| 90Sr activity in cow’s milk | 8 May 1987–9 Dec 1994 | 1666 | 1110 | 2776 | 1343 | 591 | 1934 |
| 90Sr activity in potato | 14 Sep 1987–9 Dec 1994 | 872 | 80 | 952 | 725 | 80 | 805 |
| WBCe of caesium body-burden | 8 June 1986–28 Aug 1986 | 636 | 177 | 813 | 49 | 21 | 70 |
| WBC of caesium body-burden | 28 Sep 1986–12 Dec 1996 | 484,763 | 173,163 | 657,926 | 1645 | 1161 | 2806 |
Measurements included activity concentrations of 95Zr, 95Nb, 103Ru, 106Ru, 131I, 134Cs, 136Cs, 137Cs, 140Ba, 140La, 141Ce, and 144Ce
Measurements included activity concentrations of 95Zr, 95Nb, 103Ru, 106Ru, 134Cs, 137Cs, 141Ce, and 144Ce
Measurements were done during the entire post-accident period
Activity concentrations of 134Cs, 137Cs and 90Sr in cow’s milk were derived from these measurements
WBC whole-body counter
Study population
This study aimed to assess age-dependent RBM doses for members of the general population in Gomel and Mogilev Oblasts for the following age groups considered by the International Commission on Radiological Protection (ICRP): newborns, children of 1, 5, 10, 15 years old, and adults. These age groups correspond to the time of the accident (ATA), and the aging of the study population over time since the accident was considered in dose calculations. Therefore, the present study did not account for individuals born after the Chernobyl accident. Figure 1 shows the 137Cs ground deposition density (SCHRB 2001) and the administrative centers of selected raions in Gomel and Mogilev Oblasts, which are mentioned in this paper.
Fig. 1.

137Cs ground deposition density in Belarus (SCHRB 2001) and administrative centers of selected raions in Gomel and Mogilev Oblasts that are mentioned in this paper
Red bone-marrow doses from external irradiation
The RBM dose due to external irradiation from gamma-emitting radionuclides deposited on the ground was calculated as:
| (1) |
where is the annual RBM dose from external irradiation for an individual from age group k (mGy); 10−3 is a unit conversion factor (mGy ); is the behavioral factor that takes into account occupancy factors, describing the fraction of time spent by individual at locations of different types in the settlement (living house, working building, outdoors, etc.), and location factors, which are defined as the ratio of the dose rate at locations of different types in the settlement and the dose rate at an undisturbed lawn far from any buildings, for age group k given in Table 2 (unitless); is the initial absorbed dose rate in RBM per unit activity of i-th radionuclide in soil for age group k ( per kBq m−2); is the ground deposition density of i-th radionuclide at time t in given settlement (kBq m−2); is the attenuation function that reflects the decreasing dose rate due to radionuclides migration in soil; t1,t2 are times corresponding to the beginning and end of each calendar year between 1986 and 2021, counting from the date of the Chernobyl accident (26 April 1986) (d).
Table 2.
Age-dependent behavior factor, BFk (unitless), for an individual from different age groups resided in settlements of different types
| Type of settlement and year of exposure | Newborn | 1 year | 5 year | 10 year | 15 year | Adult |
|---|---|---|---|---|---|---|
| Rural settlement | ||||||
| Evacuated settlement | 0.22 | 0.22 | 0.23 | 0.34 | 0.34 | 0.34 |
| 1986 | 0.19 | 0.19 | 0.21 | 0.28 | 0.28 | 0.28 |
| 1987+ | 0.18 | 0.18 | 0.19 | 0.25 | 0.25 | 0.25 |
| Semirural settlement | ||||||
| 1986 | 0.15 | 0.15 | 0.17 | 0.21 | 0.21 | 0.21 |
| 1987+ | 0.13 | 0.13 | 0.15 | 0.18 | 0.18 | 0.19 |
| City | ||||||
| 1986 | 0.11 | 0.11 | 0.13 | 0.15 | 0.15 | 0.13 |
| 1987+ | 0.10 | 0.10 | 0.11 | 0.13 | 0.13 | 0.12 |
The initial absorbed dose rates in RBM per unit deposition density of i-th radionuclide on the ground for adults from an effective plane source located at an initial depth of 0.5 g cm−2, which accounted for soil roughness and initial radionuclide migration, are given in Table 3 based on (Eckerman and Ryman 1993). The age-dependence of the absorbed dose rate in RBM was derived from ICRP Publication 144 (ICRP 2020) assuming that it is of the same pattern as for the effective dose rate.
Table 3.
Age-depended initial red bone marrow (RBM) external dose rate, DFi,k, per unit activity of i-th radionuclide in soil (Eckerman and Ryman 1993; ICRP 2020)
| Radio-nuclide | Half-lifea | Decay product (yield) | Emitted photon energy per disintegration (MeV)a | Initial RBM external dose rate per unit ground deposition of radionuclide (μGy d−1 per kBq m−2) for age group |
|||||
|---|---|---|---|---|---|---|---|---|---|
| Newborn | 1 year | 5 year | 10 year | 15 year | Adult | ||||
| 95Zr | 64.032 d | 95Nb (0.993) | 0.732 | 6.51 × 10⁻² | 5.83 × 10⁻² | 5.37 × 10⁻² | 4.93 × 10⁻² | 4.63 × 10⁻² | 4.47 × 10⁻² |
| 95Nb | 34.991 d | 0.765 | 6.81 × 10⁻² | 6.08 × 10⁻² | 5.61 × 10⁻² | 5.15 × 10⁻² | 4.85 × 10⁻² | 4.66 × 10⁻² | |
| 99Mob | 65.94 h | 0.148 | 2.15 × 10⁻² | 1.93 × 10⁻² | 1.77 × 10⁻² | 1.63 × 10⁻² | 1.52 × 10⁻² | 1.47 × 10⁻² | |
| 103Rub | 39.26 d | 0.496 | 4.07 × 10⁻² | 3.67 × 10⁻² | 3.39 × 10⁻² | 3.08 × 10⁻² | 2.88 × 10⁻² | 2.80 × 10⁻² | |
| 106Rub | 373.59 d | 0.206 | 1.77 × 10⁻² | 1.59 × 10⁻² | 1.46 × 10⁻² | 1.33 × 10⁻² | 1.23 × 10⁻² | 1.19 × 10⁻² | |
| 132Te | 3.204 d | 132I (1.0) | 0.234 | 1.80 × 10⁻² | 1.62 × 10⁻² | 1.49 × 10⁻² | 1.34 × 10⁻² | 1.25 × 10⁻² | 1.17 × 10⁻² |
| 131I | 8.02 d | 0.383 | 3.32 × 10⁻² | 2.97 × 10⁻² | 2.76 × 10⁻² | 2.50 × 10⁻² | 2.33 × 10⁻² | 2.23 × 10⁻² | |
| 132I | 2.295 h | 2.265 | 2.00 × 10⁻¹ | 1.79 × 10⁻¹ | 1.65 × 10⁻¹ | 1.52 × 10⁻¹ | 1.42 × 10⁻¹ | 1.38 × 10⁻¹ | |
| 133I | 20.8 h | 0.612 | 5.30 × 10⁻² | 4.76 × 10⁻² | 4.38 × 10⁻² | 4.01 × 10⁻² | 3.74 × 10⁻² | 3.63 × 10⁻² | |
| 135I | 6.57 h | 1.582 | 1.34 × 10⁻¹ | 1.21 × 10⁻¹ | 1.12 × 10⁻¹ | 1.04 × 10⁻¹ | 9.80 × 10⁻² | 9.50 × 10⁻² | |
| 134Cs | 2.065 y | 1.555 | 1.36 × 10⁻¹ | 1.21 × 10⁻¹ | 1.12 × 10⁻¹ | 1.03 × 10⁻¹ | 9.63 × 10⁻² | 9.33 × 10⁻² | |
| 136Cs | 13.16 d | 2.128 | 1.89 × 10⁻¹ | 1.70 × 10⁻¹ | 1.57 × 10⁻¹ | 1.45 × 10⁻¹ | 1.36 × 10⁻¹ | 1.31 × 10⁻¹ | |
| 137Csb | 30.167 y | 0.596 | 4.94 × 10⁻² | 4.41 × 10⁻² | 4.08 × 10⁻² | 3.72 × 10⁻² | 3.49 × 10⁻² | 3.39 × 10⁻² | |
| 140Ba | 12.752 d | 140La (1.0) | 0.183 | 1.54 × 10⁻² | 1.39 × 10⁻² | 1.28 × 10⁻² | 1.16 × 10⁻² | 1.08 × 10⁻² | 1.05 × 10⁻² |
| 140La | 1.678 d | 2.308 | 2.00 × 10⁻¹ | 1.80 × 10⁻¹ | 1.67 × 10⁻¹ | 1.55 × 10⁻¹ | 1.45 × 10⁻¹ | 1.41 × 10⁻¹ | |
| 141Ce | 32.508 d | 0.0768 | 5.66 × 10⁻³ | 5.17 × 10⁻³ | 4.73 × 10⁻³ | 4.27 × 10⁻³ | 3.99 × 10⁻³ | 3.78 × 10⁻³ | |
| 144Ceb | 284.9 d | 0.0194 | 4.26 × 10⁻³ | 3.87 × 10⁻³ | 3.56 × 10⁻³ | 3.19 × 10⁻³ | 2.95 × 10⁻³ | 2.80 × 10⁻³ | |
| 239Np | 2.3565 d | 0.185 | 1.29 × 10⁻² | 1.18 × 10⁻² | 1.09 × 10⁻² | 9.86 × 10⁻³ | 9.23 × 10⁻³ | 8.70 × 10⁻³ | |
Dose rate includes contribution from the short-lived progeny 99mTc, 103mRh, 106Rh, 137mBa, and 144Pr of 99Mo, 103Ru, 106Ru, 137Cs, and 144Ce, respectively, assuming that they are in radioactive equilibrium
The deposition density of i-th radionuclide at time t was calculated as (Eq. (2)):
| (2) |
where is the deposition density of i-th radionuclide at the time of deposition (kBq m−2), and is the radioactive decay rate of i-th radionuclide (d−1).
It should be noted that Eq. (2) does not consider the horizontal migration of radionuclides on paved urban territories. According to Jacob et al. (1987) and Roed et al. (1996), during the first few days after the deposition about 60% of the caesium was removed from asphalt, concrete and granite pavements due to traffic and surface run-off water, and the lowest residual levels of radioactivity were found on asphalt, which are the main type of pavement in urban settlements in Belarus. However, residents of urban settlements spent only 4–8% of the day on paved urban areas (Golikov et al. 2002).
For radionuclides 95Nb, 132I, and 140La, that are decay products of 95Zr, 132Te, and 140Ba, the deposition density was calculated under the condition of radioactive equilibrium of parent and daughter radionuclides:
| (3) |
where is the deposition density of parent to i-th radionuclide at the time of deposition (kBq m−2); fi is the daughter radionuclide production yield (unitless); is the radioactive decay rate of parent to i-th radionuclide (d−1).
The deposition density of i-th radionuclide at the time of deposition was calculated as (Eq. (4)):
| (4) |
where is the deposition density of 137Cs on 1 May 1986 (kBq m−2); is the ratio of activity of i-th radionuclide in deposition to that of 137Cs at the time of deposition given in Table 4 (unitless) (Minenko et al. 2006).
Table 4.
Ratios of activity of i-th radionuclide in ground deposition to that of 137Cs, Ri/Cs137, at the time of deposition (Minenko et al. 2006)
| Radionuclide | Region |
|||||
|---|---|---|---|---|---|---|
| 1a | 2b | 3c | 4d | 5e | 6f | |
| 0.5 g | 1.8 | 1.8 | 2.8 | 2.4 | 2.4 | |
| 95Zr | 2.4 | 3.6 | 0.17 | 1.3 | 4.0 | 0.34 |
| 95Nb | 2.4 | 3.6 | 0.17 | 1.3 | 4 | 0.34 |
| 99Mo | 9.3 | 7.7 | 2.0 | 4.4 | 4.4 | 2.4 |
| 103Ru | 3.3 | 3.7 | 1.6 | 2.8 | 2.4 | 1.9 |
| 106Ru | 0.71 | 0.93 | 0.42 | 1.0 | 0.85 | 0.34 |
| 132Te | 10 | 8 | 11 | 2.6 | 4.2 | 4.2 |
| 131I | 13 | 16 | 8.3 | 17 | 21 | 21 |
| 132I | 10 | 8 | 11 | 2.6 | 4.2 | 4.2 |
| 133I | 14 | 7.5 | 3.4 | 3.4 | 5 | 5 |
| 135I | 5.2 | 1 | 0.12 | 0.017 | 0.13 | 0.13 |
| 134Cs | 0.5 | 0.5 | 0.5 | 0.5 | 0.5 | 0.5 |
| 136Cs | 0.3 | 0.27 | 0.27 | 0.26 | 0.26 | 0.26 |
| 137Cs | 1 | 1 | 1 | 1 | 1 | 1 |
| 140Ba | 5 | 4.7 | 0.76 | 6.0 | 7.6 | 1.3 |
| 140La | 5 | 4.7 | 0.76 | 6.0 | 7.6 | 1.3 |
| 141Ce | 3.1 | 3.9 | 0.14 | 2.4 | 3.8 | 0.33 |
| 144Ce | 2 | 2.8 | 0.12 | 1.1 | 3 | 0.27 |
| 239Np | 3 | 4 | 0.2 | 2.4 | 4 | 0.3 |
Chernobyl 30 km zone
Bragin, Khoiniki, Elsk, Kalinkovichi, Lelchitsy, Loev Mozyr, Narovlya, and Rechitsa raions
Gomel-Mogilev caesium spot (see Fig. 1): Buda-Koshelevo, Chechersk, Dobrush, Korma, and Vetka raions in Gomel Oblast and Bykhov, Klimovichi, Kostyukovichi, Krasnopolie, Slavgorod, and Cherikov raions in Mogilev Oblast
Gomel-City
The remainder of Gomel and Mogilev Oblasts (except for Mogilev-City)
Mogilev-City
Time of main deposition in given zone, given in days after the accident
The attenuation function, p(t), which reflects the decreasing dose rate due to radionuclides migration in soil, was applied only for 134Cs and 137Cs (Eq. (5)):
| (5) |
where , , , are the parameters of the attenuation function (Likhtarev et al. 2002).
Red bone-marrow doses from 134Cs and 137Cs ingestion
The RBM dose from 134 and 137Cs ingestion was calculated as (Eq. (6)):
| (6) |
where is the annual RBM dose due ingestion of radiocaesium isotopes (mGy); is the RBM ingestion dose coefficient of r-th Cs isotope for an individual from age group k (ICRP 1993) (mGy Bq−1); is the intake function of r-th Cs isotope with foodstuffs for an individual of age k normalized to 137Cs deposition density (Bq d−1 per kBq m−2); is the 137Cs deposition density in the settlement of residence (kBq m−2).
An initial activity ratio of 134Cs to 137Cs of 0.5 (Minenko et al. 2006) was used to estimate the normalized 134Cs intake function:
| (7) |
where and are the intake functions of 134Cs and 137Cs, respectively, with diet for an individual of age k at time t after the accident (Bq); and are the radioactive decay rates of 134Cs and 137Cs, respectively.
The following sections describe the calculation of doses only from 137Cs ingestion. The doses from 134Cs ingestion were calculated by analogy with 137Cs using the 134Cs intake function given by Eq. (7).
Ingestion dose for rural and semirural populations
Two time periods of contamination of food products consumed by residents of rural and semirural2 settlements were considered: (i) the first period included April–mid July 1986 when the contamination of vegetation and hence cow’s milk was caused by direct deposition of radionuclides on the grassland surface; and (ii) the second period, which began from around mid-July 1986 and has continued until now, when the intake of caesium with foodstuffs by residents of contaminated areas was defined by the root uptake of radionuclides by vegetation, the processes of sorption of radionuclides in the soil and the transfer of radionuclides to food.
Dose from 137Cs intake for rural and semirural populations from April to 15 July 1986
During the first few months after the accident, the time-dependent 137Cs activity concentration in cow’s milk, which was the main source of 137Cs intake, can be described reasonably well using a modified Garner model (Savkin et al. 1996):
| (8) |
where is the time-dependent 137Cs activity concentration in cow’s milk (Bq L−1); C0 is an empirical coefficient (Bq L−1); is the numerical value of , the 137Cs deposition density in the settlement where milk was produced; is the rate of loss of 137Cs activity by pasture grass due to weathering and growth dilution (Ulanovsky et al. 2004); is the time between the dates of deposition and the beginning of the pasture grazing season (d), which varied from 0 for Gomel Oblast, except Chechersk and Korma raions (see Fig. 1), up to 7 for pastures in the northern part of Mogilev Oblast; aj equal to 2.9, −5.6, −12.5, 13.5, 1.5 and 1.34 (unitless), and equal to 1.84, 0.69, 0.17, 0.05, 0.023 and 0.0072 (d−1) are parameters of the modified Garner model for index j equal to 1, 2, 3, 4, 5 and 6, respectively (Eq. (8)).
According to Minenko et al. (2006), the 137Cs intake function with diet normalized to 137Cs deposition density, (see Eq. (6)), was similar to Eq. (8) describing the 137Cs activity concentration in cow’s milk:
| (9) |
where is a scaling factor that reflects the difference between 137Cs intake with the entire diet and intake with cow’s milk (L d−1). It should be noted that there was no substantial difference (only around 25–30%) in radioactivity measured in milk samples from privately owned cows and from collective farm produced in the same settlement (Savkin et al. 2004).
The scaling factor for adults, , was derived from WBC measurements done from 8 June to 28 August 1986 among 813 adults living in 70 settlements in Bragin, Kalinkovichi, Narovlya, and Khoiniki raions in Gomel Oblast and Krasnopolye raion in Mogilev Oblast, as (Eq. (10)):
| (10) |
where is the average 137Cs body burden measured in given settlement at time T normalized to 137Cs deposition density =25.9 ± 25.8 (Bq d−1); and Radults (T – t) is the 137Cs retention function for adults (ICRP 1993).
The age-dependent values of were calculated from for adults as (Eq. (11)):
| (11) |
where is a scaling factor that was defined as the ratio of 137Cs intake by an individual from age group k to that for an adult individual. The -values were obtained from WBC measurements performed from September to December 1986 among population of different ages and were 0.15, 0.35, 0.45, 0.50, and 0.80 for newborns and children aged 1, 5, 10, and 15 y, respectively.
Dose from 137Cs intake after 16 July 1986
At later times, the 137Cs intake and the 137Cs body burden depended on the agricultural and radioecological conditions of the region, on the processes of migration and sorption of radionuclides in soil, as well as on the transfer of radionuclides to food. The radioecological situation in the region was characterized in this study by an aggregated 137Cs soil to cow’s milk transfer coefficient, defined as the ratio of the 137Cs activity concentration (Bq L−1) in cow’s milk produced in the given settlement to the 137Cs deposition density (kBq m−2) in that settlement. Four areas were defined based on wide-scale monitoring of 137Cs activity concentration in cow’s milk done in 1991–1992: low aggregated 137Cs soil to cow’s milk transfer coefficient (<0.3 Bq L−1 per kBq m−2), intermediate (0.3–1.0 Bq L−1 per kBq m−2), high (1.0–5.0 Bq L−1 per kBq m−2), and extremely high (≥ 5.0 Bq L−1 per kBq m−2). Figure 2 shows the geographical pattern of the aggregated 137Cs soil to cow’s milk transfer coefficient in Gomel and Mogilev Oblasts (MHRB 1992).
Fig. 2.

Geographical pattern of the aggregated 137Cs soil to cow’s milk transfer coefficient in 1991–1992 (MHRB 1992)
The aggregated 137Cs soil to cow’s milk transfer coefficient was determined by the 137Cs transfer from soil to grass and depends on the bioavailability of caesium, soil type, potassium content in the soil, irrigation, and other factors (e.g., IAEA 1994; Rigol et al. 2008; Smith et al. 1993). An extremely high aggregated 137Cs soil to cow’s milk transfer was observed in Zhitkovichi and Lelchitsy raions with a predominant peat-boggy soil of varying degrees of water-logging. Such high 137Cs soil-to-plant transfer in this area called ‘Belarusian Polesye’ was found in the 1960s after atmospheric nuclear weapons testing (Marey et al. 1974).
The 137Cs intake also depended on the origin of the consumed foodstuffs: a private farm (the main source for residents of rural settlements and for a fraction of semi-rural population) or a commercial trade network (for a part of semirural population and for residents of cities3). Therefore, the 137Cs intake was considered accounting to (i) residence in a rural or semirural settlement or city; and (ii) different aggregated 137Cs soil to cow’s milk transfer coefficient in the rural settlements.
Because first-order differential equation adequately describes the retention function of the 137Cs body-burden in individuals of different ages, Eq. (12) was used to calculate the 137Cs activity in the body:
| (12) |
where qCs137,k is the 137Cs activity in the body of an individual of age k (Bq); ICs137,k(t) is the 137Cs intake function (Bq d−1); and λCs,k is the rate constant (d−1) corresponding to the biological half-time of Cs in the body of an individual of age k.
The 137Cs intake function was described as (Minenko et al. 2006):
| (13) |
where , (Bq d−1) and λ1,k, λ2,k are the parameters of the 137Cs intake function.
Solution of Eq. (12) for the initial condition of qCs137,k(0) = 0 is (Eq. (14)):
| (14) |
To combine WBC measurements performed in 1986–1996 in different settlements, the results of caesium body-burden measurements in residents were normalized to the 137Cs deposition density in the settlement of residence. Normalized WBC measurements were fitted by the following function:
| (15) |
where a1,k, a2,k are the best fit parameters (Bq per kBq m−2) and λ1,k, λ2,k are the best fit rate constants (d−1) derived by fitting the function to the data using the technique of least square deviations.
From Eqs. (14) and (15), the 137Cs intake function for an individual of age k, ICs137,k (Bq d−1 per kBq m−2), can be written as (Eq. (16)):
| (16) |
Table 5 gives the parameters of the 137Cs intake function (Eq. (16)) obtained in this study for residents of rural and semirural settlements with different aggregated 137Cs soil to cow’s milk transfer coefficients.
Table 5.
Age-dependent parameters of the 137Cs intake function (Eq. 16) for residents of rural and semirural settlements
| Parameter | Age group |
|||||
|---|---|---|---|---|---|---|
| Newborn | 1 year | 5 year | 10 year | 15 year | Adult | |
| 0.043 | 0.053 | 0.028 | 0.017 | 0.0075 | 0.0063 | |
| Rural settlements | ||||||
| Aggregated 137Cs soil to cow’s milk transfer coefficient less than 0.3 Bq L−1 per kBq m−2 | ||||||
| , Bq per kBq m−2 | 9 | 15 | 40 | 80 | 440 | 740 |
| , Bq per kBq m−2 | 0.6 | 1 | 2.5 | 4.5 | 13 | 20 |
| 3.18 × 10⁻³ | ||||||
| 1.1 × 10⁻⁴ | ||||||
| Aggregated 137Cs soil to cow’s milk transfer coefficient of 0.3 – 1.0 Bq L−1 per kBq m−2 | ||||||
| , Bq per kBq m−2 | 8 | 14 | 36 | 70 | 400 | 700 |
| , Bq per kBq m−2 | 0.6 | 1 | 2.5 | 5 | 15 | 23 |
| 2.53 × 10⁻³ | ||||||
| 1.1 × 10⁻⁴ | ||||||
| Aggregated 137Cs soil to cow’s milk transfer coefficient of 1.0 – 5.0 Bq L−1 per kBq m−2 | ||||||
| , Bq per kBq m−2 | 34 | 80 | 220 | 420 | 1650 | 2400 |
| , Bq per kBq m−2 | 6 | 8 | 20 | 38 | 114 | 190 |
| 2.53 × 10⁻³ | ||||||
| 7.0 × 10⁻⁵ | ||||||
| Aggregated 137Cs soil to cow’s milk transfer coefficient more than 5.0 Bq L−1 per kBq m−2 | ||||||
| , Bq per kBq m−2 | 180 | 400 | 1320 | 2500 | 9500 | 14,400 |
| , Bq per kBq m−2 | 30 | 50 | 120 | 228 | 600 | 900 |
| 2.53 × 10⁻³ | ||||||
| 7.0 × 10⁻⁵ | ||||||
| Semirural settlement | ||||||
| , Bq per kBq m−2 | 4 | 7 | 21 | 41 | 180 | 280 |
| , Bq per kBq m−2 | 0.3 | 0.5 | 1.2 | 3 | 7 | 11 |
| 3.18 × 10⁻³ | ||||||
| 1.1 × 10⁻⁴ | ||||||
Ingestion dose for population of cities
The 137Cs activity concentration measured in foodstuffs from the commercial trade network in the cities in Gomel and Mogilev Oblasts was practically the same and did not correlate with the 137Cs deposition density in the vicinity of the city (Drozdovitch and Minenko 1996). These foodstuffs were produced outside cities and were monitored for compliance with permissible levels of radioactivity concentration. Therefore, in the present study the RBM doses from 134 and 137Cs ingestion were obtained from WBC measurements of residents of the cities in Gomel and Mogilev Oblasts, and these doses did not depend on the 137Cs deposition density in the cities (Table 6).
Table 6.
Annual red bone-marrow (RBM) doses from 134 and 137Cs ingestion to residents of cities in Gomel and Mogilev Oblasts
| Year | Annual doses from 134 and 137Cs ingestion (mGy) for age group |
|||||
|---|---|---|---|---|---|---|
| Newborn | 1 year | 5 year | 10 year | 15 year | Adult | |
| 1986 | 0.130 | 0.166 | 0.205 | 0.249 | 0.445 | 0.496 |
| 1987 | –a | 0.098 | 0.119 | 0.150 | 0.259 | 0.294 |
| 1988 | – | – | 0.047 | 0.064 | 0.102 | 0.122 |
| 1989 | – | – | 0.025 | 0.037 | 0.055 | 0.069 |
| 1990 | – | – | 0.018 | 0.028 | 0.039 | 0.051 |
| 1991 | – | – | 0.015 | 0.024 | 0.033 | 0.043 |
| 1992 | – | – | 0.013 | 0.022 | 0.030 | 0.039 |
| 1993 | – | – | – | 0.020 | 0.028 | 0.036 |
| 1994 | – | – | – | 0.019 | 0.026 | 0.034 |
| 1995 | – | – | – | 0.018 | 0.024 | 0.032 |
| 1996 | – | – | – | 0.017 | 0.023 | 0.031 |
| 1997 | – | – | – | 0.016 | 0.022 | 0.029 |
| 1998 | – | – | – | – | 0.021 | 0.028 |
| 1999 | – | – | – | – | 0.020 | 0.027 |
| 2000 | – | – | – | – | 0.019 | 0.025 |
| 2001 | – | – | – | – | 0.018 | 0.024 |
| 2002 | – | – | – | – | 0.018 | 0.023 |
| 2003 | – | – | – | – | – | 0.022 |
| 2004 | – | – | – | – | – | 0.022 |
| 2005 | – | – | – | – | – | 0.021 |
| 2006 | – | – | – | – | – | 0.020 |
| 2007 | – | – | – | – | – | 0.020 |
| 2008 | – | – | – | – | – | 0.019 |
| 2009 | – | – | – | – | – | 0.019 |
| 2010 | – | – | – | – | – | 0.018 |
| 2011 | – | – | – | – | – | 0.018 |
| 2012 | – | – | – | – | – | 0.017 |
| 2013 | – | – | – | – | – | 0.017 |
| 2014 | – | – | – | – | – | 0.017 |
| 2015 | – | – | – | – | – | 0.016 |
| 2016 | – | – | – | – | – | 0.016 |
| 2017 | – | – | – | – | – | 0.016 |
| 2018 | – | – | – | – | – | 0.015 |
| 2019 | – | – | – | – | – | 0.015 |
| 2020 | – | – | – | – | – | 0.015 |
| 2021 | – | – | – | – | 0.015 | |
Doses take into account the aging of the study population over time after the accident, i.e., dose for newborns is not shown for 1987 as newborns moved to the next 1 year age group in 1987
Red bone-marrow doses from 90Sr ingestion
The RBM dose from 90Sr ingestion for an individual of age k was calculated as (Eq. (17)):
| (17) |
where is the annual RBM dose due 90Sr ingestion in a given year for an individual of age k (mGy); is the RBM dose coefficient per ingestion of 90Sr activity realized in a given year after the 90Sr intake occurred in year n for an individual of age k (mGy Bq−1); N is the number of years counted from the year of 90Sr intake until the given year; is the 90Sr deposition density in the settlement of residence (kBq m−2); Isr90,k(t) is the 90Sr intake function with foodstuffs for an individual of age k normalized to the 90Sr deposition density (Bq d−1 per kBq m−2);t1,n,t2,n are times corresponding to the beginning and end of year n(d).
Unlike radiocaesium isotopes with their relatively short biological half-life in the human body (half-time varies from 13 d for 1y child to about 100 d for adults (ICRP 1993)), 90Sr is accumulated in the human body, specifically in the bones and, consequently, RBM exposure lasted for a long time. Therefore, the annual age-dependent RBM committed dose coefficients from ingestion of 90 Sr given by ICRP (1993) until age of 70 y were derived for each year after 90Sr intake. Table 7 gives the RBM committed dose coefficient per unit of 90Sr ingestion for each year after intake in representatives of different age groups, . These values were calculated using the DCAL software (DCAL 2018).
Table 7.
Annual dose coefficient for red bone marrow (RBM) after a single intake due to ingestion of 90Sr for an individual of age k,
| Year after intake of 90Sr |
90Sr annual ingestion dose coefficient for RBM (mGy Bq −1) for age group |
|||||
|---|---|---|---|---|---|---|
| Newborn | 1 year | 5 year | 10 year | 15 year | Adult | |
| 1a | 9.7 × 10⁻⁴ | 2.4 × 10⁻⁴ | 1.2 × 10⁻⁴ | 1.1 × 10⁻⁴ | 1.1 × 10⁻⁴ | 3.5 × 10⁻⁵ |
| 2 | 3.0 × 10⁻⁴ | 8.9 × 10⁻⁵ | 5.8 × 10⁻⁵ | 6.8 × 10⁻⁵ | 7.8 × 10⁻⁵ | 2.4 × 10⁻⁵ |
| 3 | 1.2 × 10⁻⁴ | 3.9 × 10⁻⁵ | 3.3 × 10⁻⁵ | 4.5 × 10⁻⁵ | 5.7 × 10⁻⁵ | 2.0 × 10⁻⁵ |
| 4 | 5.4 × 10⁻⁵ | 1.9 × 10⁻⁵ | 1.9 × 10⁻⁵ | 3.2 × 10⁻⁵ | 4.2 × 10⁻⁵ | 1.6 × 10⁻⁵ |
| 5 | 2.7 × 10⁻⁵ | 1.0 × 10⁻⁵ | 1.2 × 10⁻⁵ | 2.3 × 10⁻⁵ | 3.2 × 10⁻⁵ | 1.4 × 10⁻⁵ |
| 6 | 1.5 × 10⁻⁵ | 5.7 × 10⁻⁶ | 7.6 × 10⁻⁶ | 1.7 × 10⁻⁵ | 2.5 × 10⁻⁵ | 1.1 × 10⁻⁵ |
| 7 | 8.4 × 10⁻⁶ | 3.4 × 10⁻⁶ | 5.3 × 10⁻⁶ | 1.3 × 10⁻⁵ | 2.0 × 10⁻⁵ | 9.3 × 10⁻⁶ |
| 8 | 5.0 × 10⁻⁶ | 2.1 × 10⁻⁶ | 3.9 × 10⁻⁶ | 1.0 × 10⁻⁵ | 1.7 × 10⁻⁵ | 7.8 × 10⁻⁶ |
| 9 | 3.1 × 10⁻⁶ | 1.3 × 10⁻⁶ | 2.8 × 10⁻⁶ | 7.9 × 10⁻⁶ | 1.4 × 10⁻⁵ | 6.5 × 10⁻⁶ |
| 10 | 1.9 × 10⁻⁶ | 8.6 × 10⁻⁷ | 2.1 × 10⁻⁶ | 6.1 × 10⁻⁶ | 1.1 × 10⁻⁵ | 5.4 × 10⁻⁶ |
| 11 | 1.3 × 10⁻⁶ | 6.1 × 10⁻⁷ | 1.7 × 10⁻⁶ | 4.9 × 10⁻⁶ | 9.6 × 10⁻⁶ | 4.5 × 10⁻⁶ |
| 12 | 9.6 × 10⁻⁷ | 4.5 × 10⁻⁷ | 1.3 × 10⁻⁶ | 4.1 × 10⁻⁶ | 8.1 × 10⁻⁶ | 3.7 × 10⁻⁶ |
| 13 | 7.1 × 10⁻⁷ | 3.4 × 10⁻⁷ | 1.1 × 10⁻⁶ | 3.4 × 10⁻⁶ | 6.9 × 10⁻⁶ | 3.1 × 10⁻⁶ |
| 14 | 5.3 × 10⁻⁷ | 2.6 × 10⁻⁷ | 8.3 × 10⁻⁷ | 2.9 × 10⁻⁶ | 5.8 × 10⁻⁶ | 2.6 × 10⁻⁶ |
| 15 | 4.2 × 10⁻⁷ | 2.0 × 10⁻⁷ | 6.7 × 10⁻⁷ | 2.4 × 10⁻⁶ | 5.0 × 10⁻⁶ | 2.2 × 10⁻⁶ |
| 16 | 3.3 × 10⁻⁷ | 1.7 × 10⁻⁷ | 5.4 × 10⁻⁷ | 2.0 × 10⁻⁶ | 4.2 × 10⁻⁶ | 1.8 × 10⁻⁶ |
| 17 | 2.6 × 10⁻⁷ | 1.3 × 10⁻⁷ | 4.4 × 10⁻⁷ | 1.7 × 10⁻⁶ | 3.6 × 10⁻⁶ | 1.5 × 10⁻⁶ |
| 18 | 2.1 × 10⁻⁷ | 1.1 × 10⁻⁷ | 3.7 × 10⁻⁷ | 1.5 × 10⁻⁶ | 3.1 × 10⁻⁶ | 1.3 × 10⁻⁶ |
| 19 | 1.6 × 10⁻⁷ | 8.3 × 10⁻⁸ | 3.1 × 10⁻⁷ | 1.3 × 10⁻⁶ | 2.7 × 10⁻⁶ | 1.1 × 10⁻⁶ |
| 20 | 1.3 × 10⁻⁷ | 6.7 × 10⁻⁸ | 2.7 × 10⁻⁷ | 1.1 × 10⁻⁶ | 2.3 × 10⁻⁶ | 9.3 × 10⁻⁷ |
| 21 | 1.1 × 10⁻⁷ | 5.6 × 10⁻⁸ | 2.3 × 10⁻⁷ | 9.4 × 10⁻⁷ | 2.0 × 10⁻⁶ | 7.9 × 10⁻⁷ |
| 22 | 9.1 × 10⁻⁸ | 4.8 × 10⁻⁸ | 1.9 × 10⁻⁷ | 8.1 × 10⁻⁷ | 1.8 × 10⁻⁶ | 6.7 × 10⁻⁷ |
| 23 | 7.7 × 10⁻⁸ | 4.1 × 10⁻⁸ | 1.6 × 10⁻⁷ | 7.1 × 10⁻⁷ | 1.6 × 10⁻⁶ | 5.8 × 10⁻⁷ |
| 24 | 6.5 × 10⁻⁸ | 3.5 × 10⁻⁸ | 1.4 × 10⁻⁷ | 6.2 × 10⁻⁷ | 1.4 × 10⁻⁶ | 4.9 × 10⁻⁷ |
| 25 | 5.6 × 10⁻⁸ | 3.0 × 10⁻⁸ | 1.2 × 10⁻⁷ | 5.4 × 10⁻⁷ | 1.2 × 10⁻⁶ | 4.2 × 10⁻⁷ |
| 26 | 4.7 × 10⁻⁸ | 2.5 × 10⁻⁸ | 1.1 × 10⁻⁷ | 4.8 × 10⁻⁷ | 1.1 × 10⁻⁶ | 3.7 × 10⁻⁷ |
| 27 | 4.0 × 10⁻⁸ | 2.2 × 10⁻⁸ | 9.1 × 10⁻⁸ | 4.2 × 10⁻⁷ | 9.7 × 10⁻⁷ | 3.2 × 10⁻⁷ |
| 28 | 3.5 × 10⁻⁸ | 1.9 × 10⁻⁸ | 7.9 × 10⁻⁸ | 3.7 × 10⁻⁷ | 8.7 × 10⁻⁷ | 2.7 × 10⁻⁷ |
| 29 | 3.0 × 10⁻⁸ | 1.6 × 10⁻⁸ | 7.0 × 10⁻⁸ | 3.3 × 10⁻⁷ | 7.9 × 10⁻⁷ | 2.4 × 10⁻⁷ |
| 30 | 2.6 × 10⁻⁸ | 1.4 × 10⁻⁸ | 6.2 × 10⁻⁸ | 3.0 × 10⁻⁷ | 7.2 × 10⁻⁷ | 2.1 × 10⁻⁷ |
| 31 | 2.2 × 10⁻⁸ | 1.2 × 10⁻⁸ | 5.5 × 10⁻⁸ | 2.7 × 10⁻⁷ | 6.6 × 10⁻⁷ | 1.9 × 10⁻⁷ |
| 32 | 2.0 × 10⁻⁸ | 1.1 × 10⁻⁸ | 4.9 × 10⁻⁸ | 2.5 × 10⁻⁷ | 6.0 × 10⁻⁷ | 1.7 × 10⁻⁷ |
| 33 | 1.7 × 10⁻⁸ | 9.3 × 10⁻⁹ | 4.3 × 10⁻⁸ | 2.2 × 10⁻⁷ | 5.6 × 10⁻⁷ | 1.5 × 10⁻⁷ |
| 34 | 1.5 × 10⁻⁸ | 8.3 × 10⁻⁹ | 3.9 × 10⁻⁸ | 2.1 × 10⁻⁷ | 5.1 × 10⁻⁷ | 1.3 × 10⁻⁷ |
| 35 | 1.3 × 10⁻⁸ | 7.3 × 10⁻⁹ | 3.5 × 10⁻⁸ | 1.9 × 10⁻⁷ | 4.7 × 10⁻⁷ | 1.2 × 10⁻⁷ |
| Sumb | 1.5 × 10⁻³ | 4.2 × 10⁻⁴ | 2.7 × 10⁻⁴ | 3.7 × 10⁻⁴ | 4.8 × 10⁻⁴ | 1.8 × 10⁻⁴ |
First year after intake of 90Sr occurred
Equal to ingestion dose coefficient for RBM per unit activity intake of 90Sr given by ICRP (1993)
The 90Sr intake function for an individual of age k normalized to the 90Sr deposition density was described by Pogodin et al. (2002) as:
| (18) |
where 4.5 × 10⁴ is an empirical coefficient (Bq per kBq m−2); Kk is a factor to calculate 90Sr intake for an individual from age group k relatively to the intake of an adult (unitless); tacc is the time since 1986 (y); 365 is the number of days in a year (d).
The 90Sr intake function for adults was obtained from the 90Sr activity measured in 1991–1995 in ribs bone ash from adult residents of Gomel Oblast (Khramchenkova 1996; Pogodin et al. 1996). The Kk values were 0.40, 0.75, 0.88, 1.0, and 1.0, for newborns and children aged 1, 5, 10, and 15 y, respectively (Pogodin et al. 2002).
Ratios of 137Cs and 90Sr intake with the diet for adults calculated using Eqs. (16) and (18) were compared with the ratios of 137Cs and 90Sr activity concentration measured in the same cow’s milk sample from 1398 settlements in Gomel and Mogilev Oblasts in 1991–1992. The use of cow’s milk is reasonable because: (i) cow’s milk was one of the main sources of radionuclides intake with diet for the population of Belarus (Minenko et al. 1996a), and (ii) a similar relative dynamic of 137Cs and 90Sr activity concentration in cow’s milk measured in 1987–1994 (Khramchenkova 1996). This comparison showed that the 90Sr intake function (Eq. (18)) overestimated the 90Sr intake (Fig. 3), and, therefore, it was adjusted as (Eq. (19)):
| (19) |
where is the realistic 90Sr intake function (Bq d−1 per kBq m−2); AFSR90 is the adjustment factor for 90Sr intake function that was calculated using Eq. (18) (unitless).
Fig. 3.

Comparison of settlement-specific ratio of 137Cs intake calculated using Eq. (16) and 90Sr intake calculated using Eq. (18) with diet for adults, with ratio of 137Cs and 90Sr activity concentrations measured in cow’s milk in 1991–1992 (MHRB 1992). Solid line shows the agreement between ratios while dashed lines show a factor of 3 difference between ratios
Table 8 gives the AF SR90-values obtained in this study depending on the geographical area and the aggregated 137Cs soil to cow’s milk transfer coefficient. It should be noted that 137Cs and 90Sr intake with the diet did not correlate with each other for residents of different settlements. Therefore, an adjustment factor for 90Sr intake function was derived using the measurements of 137Cs and 90Sr activity concentration in cow’s milk produced in different geographical areas with different aggregated 137Cs soil to cow’s milk transfer coefficients.
Table 8.
Adjustment factor for 90Sr intake function, AF SR90, (Eq. (19))
| Oblast | Raion | Adjustment factor for 90Sr intake function (unitless) for residents of the settlements with aggregated 137Cs soil to cow’s milk transfer coefficient (Bq L−1 per kBq m−2) of |
|||
|---|---|---|---|---|---|
| <0.3 | 0.3–1.0 | 1.0–5.0 | ≥5.0 | ||
| Gomel | Bragin | 0.19 | 0.16 | 0.33 | – |
| Gomel | Vetka, Dobrush, Korma, Chechersk | 0.35 | 0.11 | 0.56 | – |
| Gomel | Elsk, Narovlya | 0.67 | 0.26 | 0.47 | – |
| Gomel | Zhitkovichi, Lelchitsy, Petrikov | 0.30 | 0.11 | 0.34 | 0.92 |
| Gomel | Loev | 0.21 | 0.081 | – | – |
| Gomel | Mozyr | 0.28 | 0.12 | 0.79 | – |
| Gomel | Khoiniki | 0.080 | 0.28 | – | – |
| Gomel | Other raions | 0.21 | 0.10 | 0.27 | 1.0 |
| Mogilev | Bobruisk, Glusk, Kirov, Osipovichi | 0.064 | 0.011 | – | – |
| Mogilev | Klimovichi, Klichev, Kostyukovichi, Krichev, Slavgorod, Khotimsk | 0.13 | 0.035 | 0.057 | – |
| Mogilev | Other raions | 0.064 | 0.034 | 0.13 | – |
Population-weighted raion-averaged annual doses
This study assessed the settlement-specific mean RBM doses received during each calendar year in 1986–2021 by individuals of different ages ATA. In addition, cumulative raion-averaged population-weighted doses were calculated for 42 raions within Gomel and Mogilev Oblasts and for three cities (Gomel, Mogilev, and Bobruisk) using Eq. (20):
| (20) |
where is the cumulative mean RBM dose for exposure pathway p (external irradiation, ingestion of radiocaesium isotopes or 90Sr ingestion) for an individual of age k ATA in raion r at year T after the Chernobyl accident (mGy); S is the number of settlements in raion r; is the annual mean RBM dose for the pathway p for an individual of age j, which accounts for aging of an individual since the accident, in settlement s at year T after the Chernobyl accident (mGy); ωR,s is the fraction of population in a settlement s in raion r at year T after the accident.
The population in each settlement in each calendar year in 1986–2021 was estimated by interpolating the population recorded during 1979, 1989, 1999, 2009 and 2019 censuses (e.g., SCAS 1990; MSARB 2000). For settlements relocated in 1990–1999 from the zone of ‘mandatory relocation’ (zones with a 137Cs deposition density of more than 1480 kBq m−2) and the zone ‘with the right to relocation’ (zones with a 137Cs deposition density of 555–1480 kBq m−2) interpolation between the 1989 and 1999 census did not provide adequate population data. Therefore, the population size of these settlements was taken from annual statistical reports issued in 1990–1999 (e.g., SCASRB 1992, 1993). The total annual (or cumulative) RBM dose from all exposure pathways was calculated as the sum of the annual (or cumulative) RBM from each exposure pathway.
Results
Table 9 gives the distribution of total RBM doses from all exposure pathways received in 1986–2021 by age of individuals ATA for selected raions in Gomel and Mogilev Oblasts. The highest RBM doses were estimated for adults, while doses for younger age groups were 20–40% lower, depending on predominant exposure pathway: external irradiation or ingestion of radiocaesium isotopes. Figure 4 compares the contribution of exposure pathways to the total RBM dose received in 1986–2021 by individuals of different ages ATA who resided in Korma raion in Gomel Oblast. The contribution of external irradiation to the total dose was highest (more than 75%) among young children and decreased with age, while the contribution of ingestion of radiocaesium isotopes increased with age. The highest contribution of 90Sr intake to the total RBM dose was for newborns (2.2% of the total dose), while for adults it was 0.9%.
Table 9.
Distribution of the total mean population-weighted red bone-marrow (RBM) doses received in 1986–2021 by age groups of individuals in 1986 for selected raions in Gomel and Mogilev Oblasts
| Raion | 137Cs deposition density (kBq m−2) | 90Sr deposition density (kBq m−2) | Total mean population-weighted RBM doses (mGy) received in 1986–2021 by age group as of 1986 |
|||||
|---|---|---|---|---|---|---|---|---|
| Newborn | 1 year | 5 year | 10 year | 15 year | Adult | |||
| Gomel Oblast | ||||||||
| – Bragina | 840 | 65 | 30 | 29 | 30 | 34 | 36 | 37 |
| – Vetka | 755 | 24 | 43 | 42 | 44 | 48 | 54 | 56 |
| – Korma | 510 | 9.9 | 35 | 35 | 36 | 40 | 44 | 46 |
| – Lelchitsy | 120 | 6.2 | 18 | 18 | 20 | 23 | 27 | 28 |
| – Narovlyaa | 815 | 52 | 51 | 49 | 51 | 57 | 61 | 63 |
| – Rechitsa | 75 | 13 | 5.7 | 5.4 | 5.7 | 6.5 | 7.3 | 7.5 |
| – Khoinikia | 1,060 | 125 | 26 | 25 | 26 | 30 | 32 | 33 |
| – Chechersk | 595 | 14 | 32 | 31 | 33 | 37 | 42 | 45 |
| Mogilev Oblast | ||||||||
| – Bykhov | 190 | 4.0 | 13 | 13 | 13 | 15 | 17 | 18 |
| – Krasnopolie | 700 | 10 | 28 | 27 | 28 | 32 | 37 | 39 |
| – Krichev | 92 | 1.8 | 2.7 | 2.5 | 2.6 | 3.0 | 3.3 | 3.4 |
| – Slavgorod | 480 | 7.5 | 28 | 27 | 28 | 31 | 35 | 37 |
| – Cherikov | 540 | 8.7 | 24 | 24 | 25 | 28 | 31 | 33 |
Including settlements evacuated in 1986 from the 30 km zone around the Chernobyl nuclear power plant (NPP)
Fig. 4.

Comparison of the contribution of exposure pathways to total red bone-marrow (RBM) dose received in 1986–2021 by individuals of different ages resided in Korma raion in Gomel Oblast
Table 10 gives the distribution of the number of settlements and the population according to the settlement-averaged RBM doses from all exposure pathways for adults received in 1986–2021. For 78.8% of residents of Gomel and Mogilev Oblasts, the RBM dose was less than 10 mGy, while 0.5% of residents received doses more than 100 mGy.
Table 10.
Distribution of number of settlements according to mean-settlement total red bone-marrow (RBM) dose for adults in 1986–2021 in Gomel and Mogilev Oblasts
| Dose interval (mGy) | Gomel Oblasta |
Mogilev Oblast |
Both oblasts |
|||
|---|---|---|---|---|---|---|
| Number of settlements | Populationb (individuals) | Number of settlements | Population (individuals) | Number of settlements | Population (individuals) | |
| < 3 | 321 | 87,795 | 1952 | 1,009,613 | 2,273 | 1,097,408 |
| 3–9.99 | 879 | 1,130,078 | 534 | 107,550 | 1413 | 1,237,628 |
| 10–19.9 | 562 | 200,626 | 375 | 74,308 | 937 | 274,934 |
| 20–29.9 | 312 | 89,346 | 215 | 45,133 | 527 | 134,479 |
| 30–39.9 | 231 | 58,368 | 118 | 13,929 | 349 | 72,297 |
| 40–49.9 | 115 | 33,114 | 70 | 8656 | 185 | 41,770 |
| 50–59.9 | 68 | 20,973 | 41 | 5235 | 109 | 26,208 |
| 60–69.9 | 83 | 25,133 | 29 | 4015 | 112 | 29,148 |
| 70–79.9 | 50 | 17,467 | 18 | 2206 | 68 | 19,673 |
| 80–89.9 | 25 | 6535 | 10 | 1310 | 35 | 7845 |
| 90–99.9 | 26 | 4691 | 18 | 2475 | 44 | 7166 |
| 100+ | 35 | 9745 | 35 | 5760 | 70 | 15,505 |
| Total | 2707 | 1,683,871 | 3415 | 1,280,190 | 6122 | 2,964,061 |
Including settelements evacuated in 1986 from the 30 km zone
The entire oblast population is given as of 1 January 1986
Figure 5 shows the geographical pattern of total RBM doses for adults accumulated in 1986–2021. In general, the RBM doses follow the pattern of the 137Cs deposition density (see Fig. 1). Residents of settlements evacuated from the 30-km zone around the Chernobyl NPP, in the Southern radiocaesium spot (e.g., Bragin, Narovlya, Khoiniki raions), and in high contaminated settlements located in the North-eastern radiocaesium spot in Gomel and Mogilev Oblasts (e.g., Vetka, Korma, Chechersk, Krasnopolie, Slavgorod, Cherikov raions) received the highest doses. However, in some settlements in Elsk, Lelchitsy and Zhitkovichi raions with a low 137Cs deposition density (< 185 kBq m−2), relatively high doses were realized because of high aggregated 137Cs soil to cow’s milk transfer coefficients.
Fig. 5.

Geographical pattern of red bone-marrow (RBM) doses for adults from all exposure pathways accumulated in 1986–2021 in Gomel and Mogilev Oblasts
Table 11 shows the distribution of RBM doses for adults in 1986 and 1986–2021 from different exposure pathways depending on the 137Cs deposition density. The oblast-averaged RBM dose received by adults in 1986–2021 was 12 mGy and 5.7 mGy in Gomel and Mogilev Oblasts, respectively. External irradiation accounted for more than 60% of the total dose in areas with 137Cs deposition densities of more than 185 kBq m−2. The dose received in 1986 was around 1/3 of the dose accumulated over 35 years after the accident. Doses from external irradiation and 134Cs and 137Cs ingesiton received in settlements with different levels of 137Cs deposition density were consistent between Gomel and Mogilev Oblasts, with the exception of the areas with a deposition density of more than 1480 kBq m−2, where the total dose was almost twice higher in Mogilev Obalsts (112 mGy) than in Gomel Oblats (65 mGy). This can be explained by the fact that 30 out of 71 settlements (42.3% of the total) with a 137Cs deposition density of more than 1480 kBq m−2 in Gomel Oblasts were evacuated in 1986, while all high contaminated settlements in Mogilev Oblast were relocated later, in 1990–1992.
Table 11.
Red bone-marrow (RBM) doses for adults in 1986 and 1986–2021 from different exposure pathways depending on 137Cs deposition density in Gomel and Mogilev Oblasts
| 137Cs deposition density (kBq m−2) | Number of settlements | Populationa (individuals) | RBM doses (mGy) for adults from |
|||||||
|---|---|---|---|---|---|---|---|---|---|---|
| External irradiation |
134Cs, 137Cs ingestion |
90Sr ingestion |
Total dose |
|||||||
| 1986 | 1986–2021 | 1986 | 1986–2021 | 1986 | 1986–2021 | 1986 | 1986–2021 | |||
| Gomel Oblast | ||||||||||
| < 37 | 740 | 223,037 | 0.55 | 1.5 | 1.1 | 2.1 | 5.1 × 10⁻³ | 0.17 | 1.6 | 3.8 |
| 37–185 | 1022 | 1,203,542 | 1.1 | 3.5 | 1.2 | 3.3 | 8.2 × 10⁻³ | 0.28 | 2.3 | 7.0 |
| 185–555 | 603 | 156,063 | 5.1 | 18 | 5.3 | 14 | 9.5 × 10⁻³ | 0.31 | 10 | 32 |
| 555–1480 | 271 | 88,523 | 13 | 38 | 9.3 | 22 | 0.017 | 0.50 | 22 | 61 |
| > 1480 | 71 | 12,706 | 30 | 46 | 10 | 19 | 0.011 | 0.14 | 40 | 65 |
| Entire Oblast | 2707 | 1,683,871 | 2.2 | 6.7 | 2.1 | 5.2 | 8.4 × 10⁻³ | 0.28 | 4.3 | 12 |
| Mogilev Oblast | ||||||||||
| < 37 | 2262 | 1,077,569 | 0.20 | 0.66 | 0.58 | 1.35 | 1.6 × 10⁻³ | 0.053 | 0.78 | 2.1 |
| 37–185 | 579 | 104,073 | 1.9 | 6.5 | 2.5 | 4.9 | 2.2 × 10⁻³ | 0.075 | 4.4 | 11 |
| 185–555 | 386 | 74,315 | 3.5 | 16 | 4.9 | 11 | 3.0 × 10⁻³ | 0.10 | 8.4 | 27 |
| 555–1480 | 135 | 16,760 | 11 | 41 | 10 | 23 | 3.6 × 10⁻³ | 0.10 | 21 | 64 |
| > 1480 | 53 | 7,473 | 24 | 69 | 20 | 43 | 3.3 × 10⁻³ | 0.064 | 44 | 112 |
| Entire Oblast | 3415 | 1,280,190 | 0.80 | 2.9 | 1.2 | 2.7 | 1.7 × 10⁻³ | 0.058 | 2.0 | 5.7 |
The entire population is given as of 1 January 1986
Figure 6 compares the contributions of each exposure pathway to the total RBM dose for adult residents of selected raions. External irradiation was the predominant (60–70% from the total dose) pathway for the residents of highly contaminated Bragin, Khoiniki, Vetka and Cherikov raions with a low or intermediate aggregated 131Cs soil to cow’s milk transfer coefficients. On the contrary, the intake of radiocaesium isotopes was the main pathway (more than 70% of the total dose) for the residents of Zhitkovichi and Lelchitsy raions that are characterized by a high or extremely high aggregated 131Cs soil to cow’s milk transfer coefficient. The contribution of 90Sr ingestion to the total RBM dose for adults typically did not exceed 3–4%. Figure 7 shows, as example, the time variation of the annual RBM doses from different exposure pathways for adult residents of Narovlya raion in Gomel Oblast.
Fig. 6.
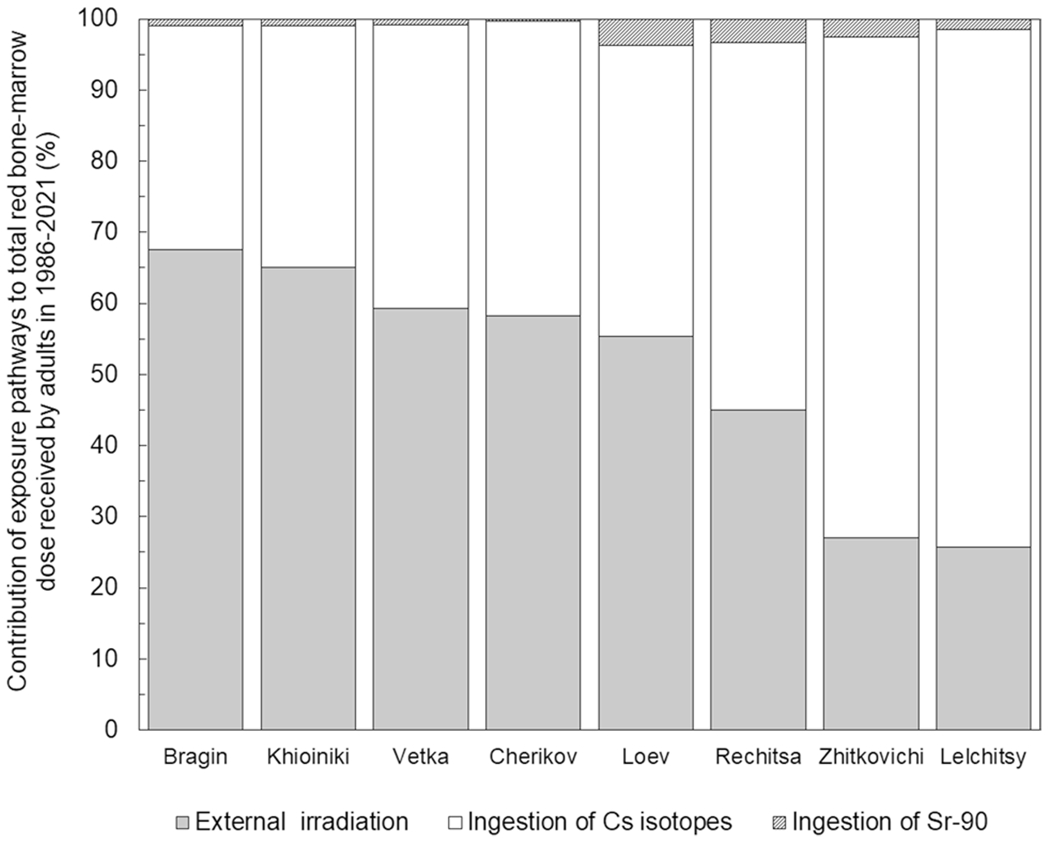
Contribution (%) of exposure pathways to total red bone-marrow (RBM) dose for adult residents of selected raions
Fig. 7.

Variation with time of annual red bone-marrow (RBM) doses from different exposure pathways for adult residents of Narovlya raion in Gomel Oblast
Discussion
Figure 8 compares the model-based settlement-specific annual doses from external irradiation estimated in the present study with the measurement-based doses obtained from the measurements done in 1987–1995 among residents of 63 settlements in 11 raions in Gomel and Mogilev Oblasts using individual thermoluminescence dosimeters (TLDs) (Drozdovitch et al. 2002; Minenko et al. 1996b). A reasonable agreement was observed between the two approaches: 73 out of 82 dose-values (89.0%) are consistent within a factor of 2. The distribution of ratios of the model- to measurement-based doses has an arithmetic mean ± SD of 0.95 ± 0.44 and a median of 0.81; Spearman’s rank correlation coefficient between these doses is ρ = 0.92 (p < 0.001).
Fig. 8.

Comparison of the annual settlement-specific doses from external irradiation in 1987–1995 estimated in this study with the doses derived from TLD measurements (Drozdovitch et al. 2002; Minenko et al. 1996b). Solid line shows the agreement between doses while dashed lines show a factor of 2 difference between doses
Figure 9 compares the settlement- and raion-specific annual model-based doses from 134 and 137Cs ingestion estimated in the present study with measurement-based doses derived from WBC measurements done in 1990–2015 among residents in 57 settlements and 22 raions in Gomel and Mogilev Oblasts (Averin et al. 2017; Drozd 2017; Eventova et al. 2016; Minenko et al. 1996b; Pogodin et al. 2001; Vlasova et al. 2009; Vlasova 2014). The distribution of ratios of the model- to measurement-based doses has an arithmetic mean ± SD of 1.0 ± 0.47 and a median of 0.90; Spearman’s rank correlation coefficient between these doses is ρ = 0.85 (p < 0.001). There is no difference in agreement between model-based and measurement-based doses for 1990–1996 (the period for which individual dose-related measurements were available for the present study to develop a dose reconstruction model), the arithmetic mean ± SD of the ratios of two types of doses is 1.0 ± 0.35 (median = 0.93) and for 1997–2015 (period for which the model was interpolated) the ratio is 1.0 ± 0.51 (median = 0.90).
Fig. 9.

Comparison of the annual settlement- and raion-specific doses from ingestion of radiocaesium isotopes in 1990–2015 estimated in this study with the doses derived from WBC measurements (Averin et al. 2017; Drozd 2017; Eventova et al. 2016; Minenko et al. 1996b; Pogodin et al. 2001; Vlasova et al. 2009; Vlasova 2014). Solid line shows the agreement between doses while dashed lines show a factor of 2 difference between doses
Table 12 compares the annual RBM doses from 90Sr intake in 1994 and 1996 calculated on the basis of 90Sr activity in ribs bone ash of adults measured in 11 raions in Gomel Oblast (Khramchenkova 1996; Minenko et al. 1996b) with the model-based doses estimated in the present study. There is reasonable agreement between the two types of dose-values: the arithmetic mean ± SD of the ratios of model-based to measurement-based doses is 0.94 ± 0.27 and the median is 0.88; Spearman’s rank correlation coefficient between these doses is ρ = 0.56 (p = 0.070).
Table 12.
Comparison of raion-averaged annual red bone-marrow (RBM) doses from 90Sr intake for adults calculated in this study with those estimated using measurements of 90Sr in ribs bone ash of adults
| Raion in Gomel Oblast | Raion-averaged annual RBMa (μGy) from 90Sr intake for adults |
Ratio of doses estimated in this study to be derived from measured 90Sr activity | |
|---|---|---|---|
| Derived from 90Sr activity measured in ribs bone ash | Estimated in the present study | ||
| Bragin | 24.5 | 21.4 | 0.87 |
| Buda-Koshelevo | 11.2 | 14.3 | 1.3 |
| Vetkab | 26.4 | 19.5 | 0.74 |
| Gomel | 12.0 | 10.6 | 0.88 |
| Gomel-City | 12.0 | 16.0 | 1.3 |
| Dobrushb | 25.1 | 17.4 | 0.69 |
| Zhlobinb | 22.1 | 10.8 | 0.49 |
| Kormab | 24.3 | 24.1 | 1.0 |
| Loev | 15.8 | 12.8 | 0.81 |
| Rechitsa | 14.4 | 14.5 | 1.0 |
| Checherskb | 11.6 | 14.6 | 1.3 |
Annual dose in 1994 according to (Khramchenkova 1996) unless otherwise indicated
Annual dose in 1996 according to (Minenko et al. 1996b)
The present study assessed the average dose for each raion of interest. There are obviously uncertainties associated with the assessed doses. Individual doses show significant variability within the settlement, and their distributions are characterized by a geometric standard deviation (GSD) of 1.3–1.7 (Drozdovitch et al. 2002; Minenko et al. 1996a). However, the uncertainty of raion-averaged doses is lower because of the raion size that typically includes 100–160 settlements, except for Bragin, Narovlya and Khoiniki raions where some settlements were evacuated in 1986. In the present study, the GSD of the raion-averaged annual RBM dose was estimated to be in the range 1.2–1.3.
The present study did not consider the intake of long-lived radionuclides such as 238Pu (half-life T1/2=87.7 y), 239Pu (T1/2=2.41 × 104 y), 240Pu (T1/2=6564 y), and 241Am (T1/2=432.2 y). The RBM dose per unit activity ingestion due to ingestion of these radioisotopes is higher for some age groups than that for 90Sr: for example, it is higher by a factor 2 for adults and by about a factor 8 for newborns (ICRP 1993). Furthermore, the ratio of 239,240,240Pu to 90Sr activity deposited in close vicinity to the Chernobyl NPP was about 0.01–0.03, and much lower at large distances from the Chernobyl NPP areas (SCHRB 2004; UNSCEAR 2011). The contribution of transuranium isotopes to the total RBM dose was small because (i) the transfer coefficient from feed to cow’s milk, TFm, for transuranium isotopes (1.0 × 10⁻⁵ d L−1 for Pu and 6.9 × 10⁻⁶ d L−1 for 241Am) is two to three orders of magnitude lower than that for 90Sr (1.5 × 10⁻³ d L−1 (IAEA 2009)); this is consistent with TFm-values of 2.8 × 10⁻⁶ d L−1 for Pu and 2.0 × 10⁻⁶ d L−1 for 241Am measured in Belarus (Averin et al. 2011); and (ii) a 239,240,240Pu deposition density of more than 3.7 kBq m−2 occurred only in the 30 km zone around the Chernobyl NPP (SCHRB 2004) where all residents were evacuated within 10 days after the accident; consequently, their annual doses in the following years due to inhalation of transuranium isotopes before evacuation was of the order of several μGy (Minenko et al. 1996b).
The strength of the present study is the use of the results of numerous measurements of radioactivity in the environment and food samples as well as in humans. Comparison with doses derived from TLD and WBC measurements showed that the doses estimated in the present study show a high degree of reliability.
However, this study has also some limitations:
The RMB doses from 134 and 137Cs ingestion realized in a given year were calculated in this study based on the intake of radiocaesium isotopes during this year and the dose coefficient from ICRP Publication 67 (ICRP 1993). Although the ICRP dose coefficient represents the committed dose expected to be realized up to age 70 years, the difference between the committed dose and the dose received during the year of intake is around 10% for adults and less than 6% for younger age groups.
The present study considered the accumulation of doses from 90Sr ingestion with time according to the model of ICRP Publication 67 (ICRP 1993). However, this model does not consider the significant increase in the rate of strontium elimination from the human body after age of 45–55 year (Shagina et al. 2003). Nevertheless, this has a minor effect on the total dose estimated in the present study since the RBM doses from 90Sr intake for adults accumulated during 1986–2021 even by residents of the most contaminated settlements were very low, typically, less than 1 mGy.
Conclusion
In summary, this paper presents the results of assessment of RBM doses from external irradiation and 134Cs, 137Cs and 90Sr ingestion to the population of Gomel and Mogilev Oblasts in Belarus accumulated over 35 years after the Chernobyl accident. The results of measurements of radionuclides in environmental samples and humans were used to determine the parameters of dose reconstruction models as well as to assess the reliability of dose estimates. The mean population-weighted RBM doses accumulated during 35 years after the Chernobyl accident were estimated to be 12 and 5.7 mGy for adult residents in Gomel and Mogilev Oblasts, respectively. RBM doses for younger age groups were about 20–40% lower than those for adults. For most regions, external exposure from radionuclides deposited on the ground was the predominant pathway of exposure (60–70% of the total dose), except for regions with an abnormally high aggregated 137Cs soil to cow’s milk transfer coefficient (≥ 5.0 Bq L−1 per kBq m−2), where the contribution of the intake of radiocaesium isotopes to the total RBM dose was more than 70%. The contribution of 90Sr intake to the total RBM dose did not exceed 4% for adults and 10% for newborns in most of the raions in Gomel and Mogilev Oblasts. The RBM doses from external irradiation and 134Cs and 137Cs ingestion are representative of whole-body exposure.
The methodology developed in this study can be used to estimate doses from prolonged sources of post-Chernobyl exposure to target organs other than RBM such as thyroid and breast doses. The age-dependent and population-weighted doses estimated in this study are useful for ecological epidemiological studies, for projection of radiation risk, and for justification of analytical epidemiological studies in populations exposed to Chernobyl fallout.
Funding
This work was supported by the Intra-Agency Agreement between the National Institute of Allergy and Infectious Diseases (NIAID, USA) and the NCI, NIAID agreement # DCC–OD–12–900, and by the Intramural Research Program, Division of Cancer Epidemiology and Genetics, National Cancer Institute, National Institutes of Health (NCI, NIH, USA).
Footnotes
Conflict of interest The authors declare that this work was carried out in the absence of any personal, professional, or financial relationships that could potentially be construed as a conflict of interest.
An oblast is the largest administrative unit in Belarus with a typical size of 30,000–40,000 km2 and a population of 1.1–1.5 million persons. There are six oblasts in Belarus each sub-divided into about 20 raions of about similar size and population.
Semirural settlement is an administrative center of raion with population less than 100,000 that have both single-family rural houses with private farm and multistore urban buildings.
City is considered a purely urban settlement, an administrative center of oblast or a settlement of republican authority, with population more than 100,000 persons, it consists of multistore buildings and has supply of foodstuffs from the commercial trade network.
References
- Averin VS, Buzdalkin KN, Tsarenok AA, Tagai SA, Kukhtsevich AB, Makarovets IV, Nilova EK (2011) Transfer of transuranic elements to cow milk. Med Biolog Problems Life Activit 1(5): 144–152 (in Russian) [Google Scholar]
- Averin VS, Batyan AN, Buzdalkin KN, Masyakin VB, Kopyltsova EV, Nilova EK, Tsurankov EN (2017) Radiation and hygienic examination of some settlements where annual dose to residents can exceed 1 mSv in 2015 per according to Dose Catalogue. Med Biolog Problems Life Activit 18(2):37–43 (in Russian) [Google Scholar]
- Bouville A, Likhtarev I, Kovgan L, Minenko V, Shinkarev S, Drozdovitch V (2007) Radiation dosimetry for highly contaminated Ukrainian, Belarusian and Russian populations, and for less contaminated populations in Europe. Health Phys 93:487–501 [DOI] [PubMed] [Google Scholar]
- Bruk GY, Shutov VN, Balonov MI, Basalayeva LN, Kislov MV (1998) Dynamics of 137Cs content in agricultural food products produced in regions of Russia contaminated after the Chernobyl accident. Radiat Prot Dosim 76:169–178 [Google Scholar]
- Cahoon EK, Preston D, Zhang R, Vij V, Little MP, Mabuchi K, Drozdovitch V, Chizhov K, Yauseyenka VV, Rozhko AV, Velalkin IV (2021) Breast cancer risk in residents of Belarus exposed to Chernobyl fallout while pregnant or lactating: standardized incidence ratio analysis, 1997 to 2016. Int J Epidemiol 23:2dyab26. 10.1093/ije/dyab226 [DOI] [PMC free article] [PubMed] [Google Scholar]
- Davis S, Day RW, Kopecky KJ, Mahoney MC, McCarthy PL, Michalek AM, Moysich KB, Onstad LE, Stepanenko VF, Voillequé PG, Chegerova T, Falkner K, Kulikov S, Maslova E, Ostapenko V, Rivkind N, Shevchuk V, Tsyb AF (2006) Childhood leukaemia in Belarus, Russia, and Ukraine following the Chernobyl power station accident: results from an international collaborative population-based case-control study. Int J Epidemiol 35:386–396 [DOI] [PubMed] [Google Scholar]
- DCAL – Dose and Risk Calculation System (2018) Version 9.6 32/64 bit (May 2018). U.S. Environmental Protection Agency. https://www.epa.gov/radiation/dcal-software-and-resources [Google Scholar]
- Drozd EA (2017) On the factors influencing the formation of the internal radiation dose. Med Biolog Problems Life Activit 17(1):64–69 (in Russian) [Google Scholar]
- Drozdovitch VV, Minenko VF (1996) Internal exposure due to the consumption of foodstuffs contaminated with radiocesium. Report II: doses to urban population of Belarus. Med Biol Aspect Chernobyl Accid 3:3–8 (in Russian) [Google Scholar]
- Drozdovitch VV, Minenko VF, Ulanovsky AV, Kukhta TS (1996) Internal exposure due to the consumption of foodstuffs contaminated with radiocesium. Report I: doses to rural population of Belarus. Med Biol Aspect Chernobyl Accid 2:12–16 (in Russian) [Google Scholar]
- Drozdovitch VV, Shevchuk CE, Mirkhaidarov AK (2002) Uncertainties in external radiation doses used to assess the radiological consequences of an accident on nuclear power plant. Preprint IPEP-70. Minsk: IPEP; (in Russian). [Google Scholar]
- Drozdovitch V, Zhukova O, Germenchuk M, Khrutchinsky A, Kukhta T, Luckyanov N, Minenko V, Podgaiskaya M, Savkin M, Vakulovsky S, Voillequé P, Bouville A (2013) Database of meteorological and radiation measurements made in Belarus during the first three months following the Chernobyl accident. J Environ Radioact 116:84–92 [DOI] [PMC free article] [PubMed] [Google Scholar]
- Eckerman KF, Ryman JC (1993) External exposures to radionuclides in air, water, and soil. Federal Guidance Report No 12. EPA US. Washington DC. [Google Scholar]
- Eventova LN, Drozdov DN, Mataras AN, Drozd EA, Visenberg YV, Vlasova NG (2016) The monitoring of internal exposure doses in populations in the remote period after the accident at the Chernobyl nuclear power plant. Med Biolog Problems Life Activit 1(15):138–144 (in Russian) [Google Scholar]
- Golikov VY, Balonov MI, Jacob P (2002) External exposure of the population living in areas of Russia contaminated due to the Chernobyl accident. Radiat Environ Biophys 41:185–193 [DOI] [PubMed] [Google Scholar]
- IAEA – International Atomic Energy Agency (1994) Handbook of parameter values for radionuclide transfer in the temperate environments. Technical Report Series No. 364. Vienna: IAEA. [Google Scholar]
- IAEA – International Atomic Energy Agency (2009) Quantification of radionuclide transfer in terrestrial and freshwater environments for radiological assessments. IAEA-TECDOC-1616. Vienna: IAEA. [DOI] [PubMed] [Google Scholar]
- ICRP – International Commission on Radiological Protection (1993) Age-dependent doses to members of the public from intake of radionuclides: Part 2. Ingestion dose coefficients: ICRP Publication 67. Ann ICRP 23(3–4). [PubMed] [Google Scholar]
- ICRP – International Commission on Radiological Protection (2008) International Commission on Radiological Protection (2008) Nuclear decay data for dosimetric calculations. ICRP Publication 107. Ann ICRP 38(3). [DOI] [PubMed] [Google Scholar]
- ICRP – International Commission on Radiological Protection (2010) Conversion coefficients for radiological protection quantities for external radiation exposures. ICRP Publication 116. Ann ICRP 40(2–5). [DOI] [PubMed] [Google Scholar]
- ICRP – International Commission on Radiological Protection (2020) Dose coefficients for external exposures to environmental sources. ICRP Publication 144. Ann ICRP 49(2). [DOI] [PubMed] [Google Scholar]
- Ivanov EP, Tolochko GV, Shuvaeva LP, Becker S, Nekolla E, Kellerer AM (1996) Childhood leukemia in Belarus before and after the Chernobyl accident. Radiat Environ Biophys 35:75–80 [DOI] [PubMed] [Google Scholar]
- Jacob P, Meckbach R, Müller HM (1987) Reduction of external exposure from deposited Chernobyl activity by run-off, weathering, street cleaning and migration in the soil. Radiat Prot Dosim 21:51–57 [Google Scholar]
- Khramchenkova OM (1996) Some regularities of 90Sr intake into the human body and its role in the doses from internal irradiation after the accident at the Chernobyl Nuclear Power Plant. Ph.D. Thesis. Gomel, Belarus: Gomel Branch of Research Institute for Radiation Medicine; (in Russian). [Google Scholar]
- Likhtarev IA, Kovgan LN, Vavilov SE, Perevoznikov ON, Litvinets LN, Anspaugh LR, Jacob P, Pröhl G (2000) Internal exposure from the ingestion of foods contaminated by 137Cs after the Chernobyl accident. Report 2. Ingestion doses of the rural population of Ukraine up to 12 y after the accident (1986–1997). Health Phys 79:341–357 [DOI] [PubMed] [Google Scholar]
- Likhtarev IA, Kovgan LN, Jacob P, Anspaugh LR (2002) Chernobyl accident: retrospective and prospective estimates of external dose of the population of Ukraine. Health Phys 82:290–303 [DOI] [PubMed] [Google Scholar]
- Liubarets TF, Shibata Y, Saenko VA, Bebeshko VG, Prysyazhnyuk AE, Bruslova KM, Fuzik MM, Yamashita S, Bazyka DA (2019) Childhood leukemia in Ukraine after the Chornobyl accident. Radiat Environ Biophys 58:553–562 [DOI] [PubMed] [Google Scholar]
- Marey AN, Barkhudarov RM, Novikova NY (1974) Global fallout of cesium-137 and people. Atomizdat, Moscow: (in Russian) [Google Scholar]
- Minenko VF, Drozdovitch VV, Tretyakevich SS (1996a) Methodological approaches to calculating the annual effective dose of irradiation for residents of settlements in Belarus. Radiat Risk 7:246–252 [Google Scholar]
- Minenko VF, Ulanovsky AV, Drozdovitch VV, Tretyakevich SS, Trofimik SV, Pogodin RI, Mirkhaidarov AK (1996b) To study features of formation of current radiation doses to the population. Final Report of Research Institute for Radiation Medicine. Minsk, Belarus: NIIRM; (in Russian). [Google Scholar]
- Minenko VF, Ulanovsky AV, Drozdovitch VV, Shemiakina EV, Gavrilin YI, Khrouch VT, Shinkarev SS, Voillequé PG, Bouville A, Anspaugh LR, Luckyanov N (2006) Individual thyroid dose estimates for a case-control study of Chernobyl-related thyroid cancer among children of Belarus. Part II. Contributions from long-lived radionuclides and external radiation. Health Phys 90:312–327 [DOI] [PubMed] [Google Scholar]
- Minenko V, Viarenich K, Zhukova O, Kukhta T, Podgaiskaya M, Khrutchinsky A, Kutsen S, Bouville A, Drozdovitch V (2020) Activity concentrations of 131I and other radionuclides in cow’s milk in Belarus during the first month after the Chernobyl accident. J Environ Radioact 220–221:106264. [DOI] [PMC free article] [PubMed] [Google Scholar]
- MHRB – Ministry of Health of the Republic of Belarus (1992) Catalog of radiation doses for residents of settlements of the Republic of Belarus. Minsk, Belarus: MHRB; (in Russian). [Google Scholar]
- MHRB – Ministry of Health of the Republic of Belarus (1994) Catalog of radiation doses for residents of settlements of the Republic of Belarus. Minsk, Belarus: MHRB; (in Russian). [Google Scholar]
- MSARB – Ministry of Statistics and Analysis of the Republic of Belarus (2000) Data on the number of inhabitants of settlements of the Republic of Belarus according to the results of the 1999 population census. Minsk, Belarus: MSARB; (in Russian) [Google Scholar]
- Pogodin RI, Khramchenkova OM, Leshcheva SV, Vlasov PA, Kutkov VA (1996) ‘Hot’ particles, strontium-90 and plutonium isotopes and problem of radiation safety of population affected by the Chernobyl accident. Chernobyl 1:71–81 (in Russian) [Google Scholar]
- Pogodin RI, Skryabin AM, Vlasova NG, Leshcheva SV, Tsurikov GA, Stavrov VV (2001) Conduct a comparative analysis of incidence in the population of Belarus in areas with different radio-ecological situations. Report of Gomel Branch of Research Institute for Radiation Medicine and Endocrinology. Gomel, Belarus: GBRIRME; (in Russian). [Google Scholar]
- Pogodin RI, Skryabin AM, Vlasova NG, Leshcheva SV, Tsurikov GA, Stavrov VV (2002) Determine the dynamics of the intake of Sr-90 and Pu into the human body to predict dose loads. Report of Gomel Branch of Research Institute for Radiation Medicine and Endocrinology. Gomel, Belarus: GBRIRME; (in Russian). [Google Scholar]
- Roed J, Andersson KG, Sobotovitch E, Garger E, Matveenko II (1996) Distribution of radionuclides in urban areas and their removal. In Karaoglou A, Desmet G, Kelly GN, Menzel HG (Eds). The radiological consequences of the Chernobyl accident. EUR-16544. Brussel: European Commission, 49–58. [Google Scholar]
- Rigol A, Camps M, De Juan A, Rauret G, Vidal M (2008) Multivariate soft-modeling to predict radiocesium soil-to-plant transfer. Environ Sci Technol 42:4029–4036 [DOI] [PubMed] [Google Scholar]
- Rivkind N, Stepanenko V, Belukha I, Guenthoer J, Kopecky KJ, Kulikov S, Kurnosova I, Onstad L, Porter P, Shklovskiy-Kordi N, Troshin V, Voillequé P, Davis S (2020) Female breast cancer risk in Bryansk Oblast, Russia, following prolonged low dose rate exposure to radiation from the Chernobyl power station accident. Int J Epidemiol 49:448–456 [DOI] [PMC free article] [PubMed] [Google Scholar]
- Savkin MI, Titov AV, Lebedev AN (1996) Distribution of individual and collective exposure doses for the population of Belarus in the first year after the Chernobyl accident. Radiat Risk 7:87–113 [Google Scholar]
- Savkin M, Titov A, Lebedev A, Germenchuk M, Bouville A, Luckyanov N (2004) Current status of the study on assessment of 131I specific activity in milk, milk products, and leafy vegetables based on total beta-activity measurements conducted in Belarus after the Chernobyl accident. In: Full Papers of 11th International Congress of the IRPA, 23–28 May 2004, Madrid, Spain, ISBN 84-87078-05-2. [Google Scholar]
- SCAS – State Committee for Analysis and Statistics (1990) Data on the number of inhabitants of settlements of the Byelorussian SSR according to the results of the 1989 population census. Minsk, Belarus: SCAS of the BSSR; (in Russian). [Google Scholar]
- SCASRB – State Committee for Analysis and Statistics of the Republic of Belarus (1992) Data on the population living in the zones of radioactive contamination after the Chernobyl accident by oblasts, raions and settlements as of January 1, 1992. Minsk, Belarus: SCASRB; (in Russian). [Google Scholar]
- SCASRB – State Committee for Analysis and Statistics of the Republic of Belarus (1993) Data on the population living in the zones of radioactive contamination after the Chernobyl accident by oblasts, raions and settlements as of January 1, 1993. Minsk, Belarus: SCASRB; (in Russian). [Google Scholar]
- SCHRB – State Committee for Hydrometeorology of the Republic of Belarus (1998) Deposition density of 90Sr in the settlements of the Republic of Belarus. Minsk, Belarus: Belgeodezy. [Google Scholar]
- SCHRB – State Committee for Hydrometeorology of the Republic of Belarus (2001) Deposition density of 137Cs in the settlements of the Republic of Belarus. Minsk, Belarus: Belgeodezy. [Google Scholar]
- SCHRB – State Committee for Hydrometeorology of the Republic of Belarus (2004) Radiation situation on the territory of Belarus: Deposition density of 238,239,240Pu in 2015: Prognosis. Minsk, Belarus: Belgeodezy. [Google Scholar]
- Shagina NB, Tolstykh EI, Zalyapin VI, Degteva MO, Kozheurov VP, Tokareva EE, Anspaugh LR, Napier BA (2003) Evaluation of age and gender dependences of the rate of strontium elimination 25–45 years after intake: analysis of data from residents living along the Techa river. Radiat Res 159:239–246 [DOI] [PubMed] [Google Scholar]
- Smith JT, Fesenko SV, Howard BJ, Horrill AD, Sanzharova NI, Alexahin RM, Elder DG, Naylor C (1993) Temporal change in fallout 137Cs in terrestrial and aquatic systems: a whole ecosystem approach. Environ Sci Technol 33:49–54 [Google Scholar]
- Travnikova IG, Bruk GJ, Shutov VN, Bazjukin AB, Balonov MI, Rahola T, Tillander M (2001) Contribution of different foodstuffs to the internal exposure of rural inhabitants in Russia after the Chernobyl accident. Radiat Prot Dosim 93:331–339 [DOI] [PubMed] [Google Scholar]
- Ulanovsky A, Drozdovitch V, Bouville A (2004) Influence of radionuclides distributed in the whole body on the thyroid dose estimates obtained from direct thyroid measurements made in Belarus after the Chernobyl accident. Radiat Prot Dosim 112:405–418 [DOI] [PubMed] [Google Scholar]
- UNSCEAR – United Nations Scientific Committee on the Effects of Atomic Radiation (2011) Sources and Effects of Ionizing Radiation, UNSCEAR 2008 Report. Annex D: Health effects due to radiation from the Chernobyl accident. Sales No. E.11.IX.3. New York: United Nations. [Google Scholar]
- Vlasova NG (2014) Dose assessment for population in the remote period after the Chernobyl accident. Radiat Hygiene 7(3):9–18 (in Russian) [Google Scholar]
- Vlasova NG, Chunikhin LA, Drozdov DN (2009) Statistical analysis of the results of WBC measurements to assess the internal radiation dose of rural residents in the remote period of the Chernobyl accident. Radiat Biol Radioecol 4:397–406 (in Russian) [PubMed] [Google Scholar]
- Zupunski L, Yaumenenka A, Ryzhov A, Veyalkin I, Drozdovitch V, Masiuk S, Ivanova O, Kesminiene A, Pukkala E, Moiseev P, Prysyazhnyuk A, Schüz J, Ostroumova E (2021) Breast cancer incidence in the regions of Belarus and Ukraine most contaminated by the Chernobyl accident: 1978–2016. Int J Cancer 148:1839–1849 [DOI] [PMC free article] [PubMed] [Google Scholar]