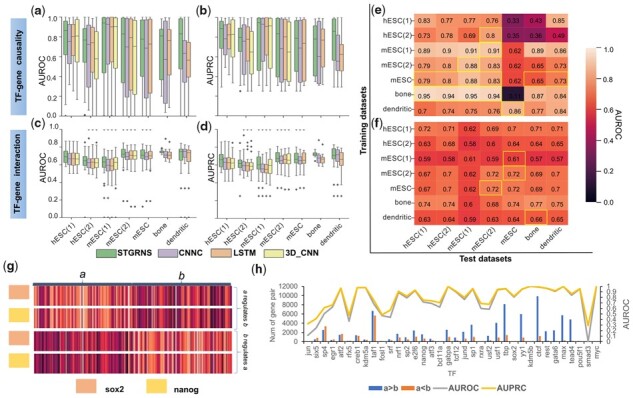
Figure 5.

Comparison of STGRNS with other methods and the interpretation of STGRNS on the TF–gene prediction task. (a and b) Comparison results on the TF–gene causality task. (c and d) Comparison results on the TF–gene interaction task. (e) Transferability of STGRNS on the causality prediction task. (f) Transferability of STGRNS on the interaction prediction task. (g) Two sets of samples. (h) The performance of each TF and the number of a > b, a < b in gene pairs
