Abstract
Background: Gastric cancer (GC) is one of the most common malignancies worldwide with a poor prognosis due to the lack of early detection and effective treatments. As a biomarker, collagen type I alpha 1 (COL1A1) is often dysregulated in some cancer types. However, the expression profile of COL1A1 and functional mechanism in GC is still unclear. Methods: To screen for the different expression genes of GC vs. adjacent tissues, an RNA-seq dataset containing 30 clinical samples and multi-omics datasets of 478 samples were obtained from Gene Expression Omnibus (GEO) and The Cancer Genome Atlas (TCGA) databases, respectively. Then the functional enrichment analysis and survival analysis of dysregulated genes were performed. Furthermore, through constructing the protein-protein interactive network, the function mode of COL1A1 was studied. Finally, a prognostic model was built by least absolute shrinkage and selection operator (LASSO) Cox algorithm to assess the clinical value of COL1A1-network. Results: Firstly, a total of 89 different expression genes (58 down-regulated and 31 up-regulated) that appeared simultaneously in both GEO and TCGA datasets were detected and enriched in some functions regarding the extracellular matrix. However, only 12 genes were significantly correlative with overall survival of GC patients. Among them, ASPN, COL1A1, COL12A1, FNDC1, INHBA and MMP12 could form a network that might activate the epithelial-mesenchymal transition (EMT) pathway. Meanwhile, a prognostic model containing ASPN and INHBA was able to divide GC patients into 2 groups with different risks and predict 5-years survival accurately (AUC = 0.732, 95% CI (0.619, 0.845)). Conclusion: COL1A1 is up-regulated in GC and may result in a poor prognosis with a higher mRNA level. Moreover, the COL1A1-network may promote malignant metastasis via EMT pathway activation and act as a prognostic marker.
Keywords: Gastric cancer, COL1A1, EMT pathway, prognostic model
Introduction
In China, about 380,000 new GC patients are diagnosed annually. The incidence of GC ranks NO. 3 among all malignant tumors [1]. Although the incidence and mortality of GC have been declining recently, GC remains one of the most common and lethal malignancies [2,3]. Although chemo/radiotherapy and targeted therapy have improved response rates, surgical resection is the most curative therapy currently. Due to the aggressive invasion, most patients are diagnosed in an advanced stage without specific early-stage symptoms. Advanced GC patients are generally incurable with a poor prognosis. The 5-year survival rate is only 20% [4-7]. The invasion and metastasis of tumor cells are the main causes of GC recurrence and death, which also seriously affect the therapeutic effect [8]. A better understanding of the mechanism of GC carcinogenesis and progression is significant for improving early diagnosis and treatment efficacies. In addition, the discovery of key molecules regulating the invasion and metastasis of GC cells is conducive to the design of targeted therapy to improve the prognosis.
Recent evidence has proven that the aberrant activation of epithelial-mesenchymal transition (EMT) plays a crucial role in the genesis, invasion and metastasis of various tumors [9,10], like GC [11]. EMT is a process with a transformation from epithelial cells into cells with mesenchymal phenotypes, characterized by lost cellular polarity and adhesion while enhancing invasive and migratory properties. In GC aggressiveness, the EMT was also an important mode of responding to the tumor microenvironment. It might regulate malignant behaviors via EMT [12,13]. A detailed investigation into the role of EMT in GC could further our understanding of GC initiation, invasion, and metastasis.
Type I collagen (COL-1), found in most connective and embryonic tissue, is an important member of the collagen family [14]. COL-1 has the function of creating matrix structural skeletons and forms the interstitial portion of most solid tumors [15]. Typically, type I collagen is composed of 2 COL1A1 chains and 1 COL1A2 chain [16]. Recently, similar to the other collagen family members, abnormal expression of COL1A1 has been reported in various cancer types [17-19], which was believed to be involved in carcinogenesis [20-22]. However, the regulation of COL1A1 in normal epithelium and tumor lesions of the stomach was rarely mentioned. Although via gene set enrichment analysis (GSEA) analysis, Zhao et al. [23] have demonstrated that in GC, COL1A1 may regulate the EMT pathway. The clinical significance and mechanism of COL1A1 in GC remains unclear. Meanwhile, the regulatory mode of COL1A1 in the EMT pathway also need further study.
In the present study, high-throughput sequencing data of 15 pair’s of clinical samples (GC vs. adjacent tissues) were analyzed. The differential expression genes were screened followed by functional enrichment analysis. Through the construction of the PPI protein interaction network, the key pivotal proteins in GC were identified, which were also used to build a prognostic model of GC and preliminarily explore the clinical value and mechanism of COL1A1.
Methods
Sequencing datasets
The public GC sequencing dataset (GSE118916) was obtained from the GEO database. According to the corresponding study [24], tumor and matched normal tissues samples were obtained from the GC patients at the Affiliated Hospital of Xuzhou Medical University in 2014. These tissues were stored at 4°C until full penetration of RNAlater into the tissues and transferred to -80°C for storage. The selection criteria were as follows: (1) The subject presented was diagnosed with GC and had no history of other tumors; (2) Complete demographic and clinical data including age, gender, clinical manifestations, tumor size, the extent of resection, and date of relapse and/or death have been collected. The legal surrogates of those participants provided their written informed consent. This study was approved by the Medical Ethics Committee of the Affiliated Hospital of Xuzhou Medical University. The demographic and clinical features of the patient were summarized in Table 1.
Table 1.
The clinical data of GC patients
| Age | Median 43, Range 23-66 |
| Gender | Male (n = 20), Female (n = 10) |
| Race | Ethnic Han |
| Stage | I 5 (~17%); II 8 (~27%); III 11 (~37%); IV 6 (~20%) |
Additionally, the RNA-seq data of STADs from the TCGA database were downloaded from the NIH National Cancer Institute GDC Data Portal (https://portal.gdc.cancer.gov/). Overall survival (OS) was identified from the diagnosis date until death or the end of follow up.
Microarray data and enrichment analysis
Total RNA from cells and tissues was isolated using Trizol extractions (Invitrogen). A total of 100 ng of total RNA was amplified using the Ambion® WT Expression Kit (4411973, Life Technologies). Then 5.5 μg of the cDNA was fragmented and labeled with the GeneChip® WT Terminal Labeling kit (901525, Affymetrix). Libraries were sequenced on Illumina HiSeq 2500 using v3 chemistry. Followed by background deletion, quantile normalization, and probe assembly. Differentially expression genes (DEGs) were detected [25]. The p-values were adjusted for multiple comparisons using the Benjamini-Hochberg procedure [26]. Genes with adjusted p-value < 0.05 and |log FC| ≥ 2.0 were considered as DEGs. Enrichment analysis of DEGs was performed with DAVID [27]. The enriched GO (BP: biological process; CC: cellular component; MF: molecular function) and pathway terms were listed with participant genes [28]. Some other databases used are listed in Table 2.
Table 2.
List of database
| Database ID | URL |
|---|---|
| GEO Dataset | https://www.ncbi.nlm.nih.gov/gds/?term= |
| TCGA | https://www.cancer.gov/ |
| Pathview | https://pathview.uncc.edu/ |
| cBioportal of cancer genomics | https://www.cbioportal.org/ |
| TCPA | https://www.tcpaportal.org/tcpa/ |
| DSA | http://cancer.digitalslidearchive.net/ |
| The Human Protein Atlas | https://www.proteinatlas.org/ |
| STRING | https://string-db.org/ |
| GEPIA | http://gepia.cancer-pku.cn/index.html |
| GO | http://geneontology.org/ |
| CAMOPI | https://www.camoip.net/ |
The protein-protein interaction network construction
The Retrieval of Interacting Genes (STRING v10) was used to analyze the interactive relationships among DEGs and construct a protein-protein interaction (PPI) network. Only experimentally validated interactions with a combined score (> 0.4) were selected as significant [29]. Cytoscape was used to construct the PPI network and Gephi was used for network visualization. The plug-in Molecular Complex Detection (MCODE) was used to select the prime module from the PPI network. The p-values < 0.05 were considered to be significant.
Immunohistochemistry (IHC)
Before IHC staining, GC specimens and normal tissues were fixed with 10% formalin and embedded with paraffin. IHC staining followed a standard protocol to evaluate the expression level of COL1A1 in human tissues. Staining was graded on a scale of 0-3 according to the intensity and the percentage of immune-positive cells.
Survival curves
Overall survival analyses were performed using the R package survival [30], and the patients were dichotomized based on the median expression. Kaplan-Meier estimator of survival was used to construct the survival curves. Log-rank tests (corresponding to a two-sided z test) were used to compare overall survival between patients in different groups. The hazard ratio (HR) (95% confidence interval) was provided for comparison of the two groups. The p-values were adjusted for multiple testing based on the false discovery rate (FDR) according to the Benjamini-Hochberg method [31]. Proportional hazard assumptions were tested.
Statistical analyses
Available samples from TCGA data were adequate because sufficient power using equivalent tests was observed in a previous study [32]. To test for differential expression across the two groups (tumor and normal), the R package DESeq2 was used on raw count data [33]. For comparison of two patient groups, the two-sided Student’s t-test and Wilcoxon-rank sum test was used. Distributions of data are shown either as individual data points, as box-and-whisker plots, or as violin plots. The p-values were adjusted according to the Benjamini-Hochberg method.
Results
The DEGs of GC vs. adjacent tissue
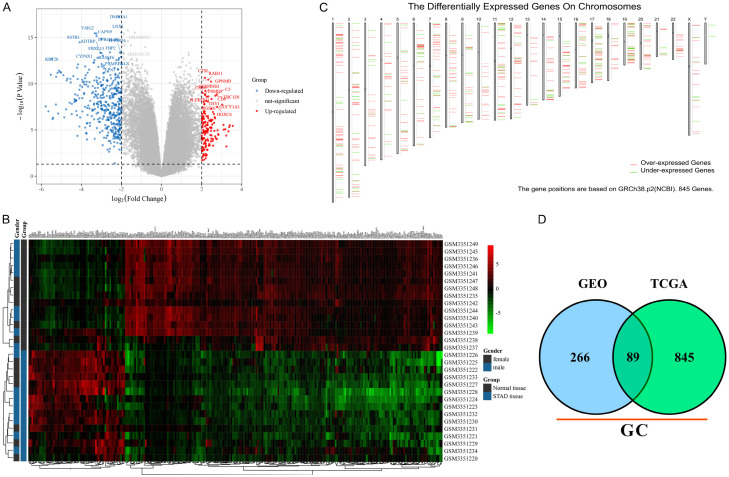
Cell carcinogenesis is often accompanied by abnormal regulatory modes of abundant genes which can be reflected by transcriptome (mRNA level). The transcriptomic difference analysis between tumors and normal tissues is useful for studying pathogenesis and screening novel targets. To identify transcriptome differences between GC and adjacent tissues, one RNA-seq dataset containing 30 clinical samples (GSE118916) was used for DEG screening. A total of 204 down-regulated and 62 up-regulated genes were identified with the classical thresholds (|log FC| ≥ 2.0 and adjusted p-value < 0.05). The top 10 significant up- and down-regulated genes were marked with symbols (eg. KRT20 and GUCY1A3) (Figure 1A). In addition, the standard RNA sequencing reads of each DEG in normal and GC tissues were shown in a heatmap with the word. D2 cluster analysis (Figure 1B).
Figure 1.
The DEGs of GC vs. adjacent tissue. A. The volcano plot of DEGs in GSE118916. The red points represent up-regulated genes and the blue ones represent down-regulated genes. The gray points represent genes without significant difference. B. The cluster heatmap of DEGs in GSE118916. The color shade represents the gene expression level. The legend was listed on the right. C. The DEG positions on a sketch map of chromosomes based on TCGA. The red segments represent up-regulated genes and the green ones represent down-regulated genes. D. The Venn diagram of GC DEGs in both GSE118916 and TCGA datasets.
However, 15 pairs of clinical samples were too few to fully reflect the changes of gene expression profile in GC patients. In this study, the GC patient transcriptome sequencing data from the TCGA database were also analyzed for DEG screening. A total of 845 DEGs were identified with |log FC| ≥ 2.0 and p-value < 0.05. The DEGs positions in chromosomes are shown by a sketch map based on GRCh38.p2 (Figure 1C). After comparison, a total of 89 DEGs (58 down-regulated and 31 up-regulated) that appeared simultaneously in both GEO and TCGA datasets were regarded as the key genes involved in GC pathology (Figure 1D). Followed by function enrichment analysis, the down-regulated genes were enriched in 12 MF, 11 BP, 2 CC and 2 pathways like gastric acid secretion (Figure S1), while the up-regulated genes were enriched in 15 MF, 89 BP, 13 CC and 6 pathways like cell migration (Figure S2). The results suggested that some DEGs may participate in the GC process via these enriched functions.
The correlation between DEGs level and prognosis
The main reference index for evaluating the clinical application value of a gene is the correlation between expression level and survival time. Thus, the overall survival curves of 89 DEGs were drawn. According to the expression level of each gene, the samples were equally divided into high and low expression groups (n = 190). After analyzing, only 12 DEGs (ASPN, C16orf89, CCKBR, COL1A1, COL12A1, DNER, ETNPPL, FNDC1, GHRL, INHBA, KLK11 and MMP12) were found to significantly affect prognosis with different expression levels (p-value < 0.05) (Figure 2). Among them, only KLK11 (p-value = 0.037) and MMP12 (p-value = 0.026) may result in a worse prognosis with lower expression levels, while the other genes have the opposite trend (p-value < 0.05). In addition, the level of FNDC1 (p-value = 0.0058) was the most significantly correlative with prognosis.
Figure 2.
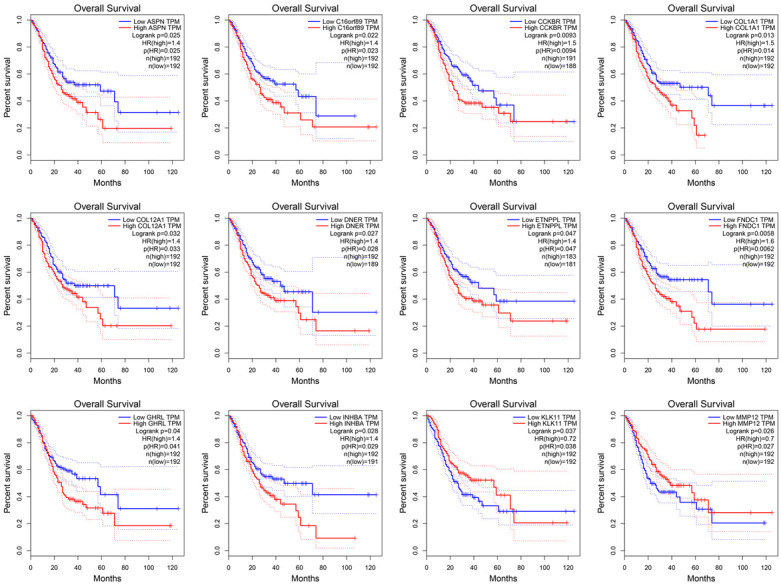
The overall survival curves of 12 DEGs. The red line represents the samples with a higher level of gene expression and the blue one represents the samples with a lower level, respectively. The legend was listed on the right.
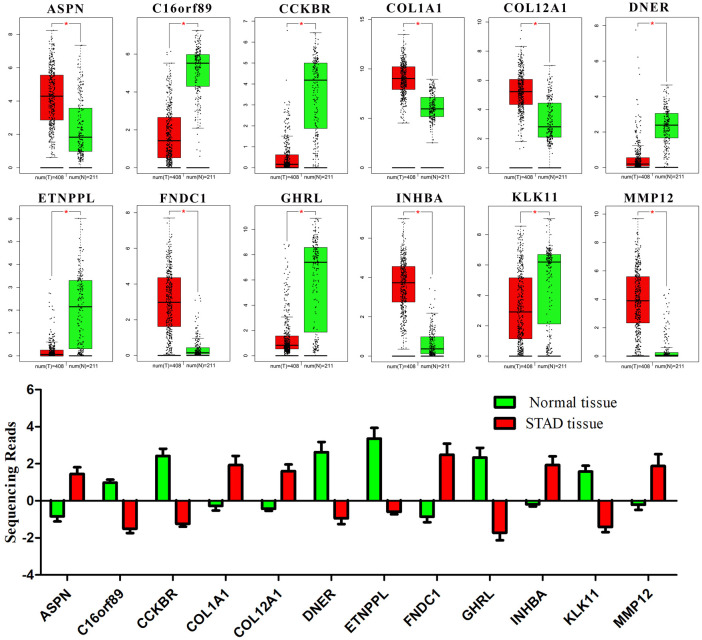
In the carcinogenesis process, gene expression alterations are often beneficial for cancer progression and lead to poor prognosis. Based on both GEO and TCGA datasets, the ASPN, COL1A1, COL12A1, FNDC1, INHBA and MMP12 were up-regulated while the others were down-regulated when compared with normal tissue (p-value < 0.05) (Figure 3). Combined with survival analysis results, it may suggest that only ASPN, COL1A1, COL12A1, FNDC1, INHBA and KLK11 could promote GC progression when their expression levels were altered. Notably, in this study, only the correlation between the expression of key genes and the prognosis of patients was calculated. The specific underlying molecular mechanism needs to be further studied.
Figure 3.
The expression of 12 DEGs in normal and GC tissues. The sequencing data were obtained from GEO and TCGA databases. The red box represents GC tissue and the green one represents normal tissue. In the TCGA dataset, there were 408 GC samples and 211 normal samples. *, p-value < 0.05.
The molecular aberrations of DEGs in GC samples
The correlation between expression level of DEGs and overall survival has been calculated. Moreover, in multi-type tumors, gene expression profile might often be regulated by molecular aberration like mutation, copy number and methylation. To further study the clinical function of DEGs, multi-omics data of 443 GC patients in the TCGA database were analyzed (Figure 4). A total of 148 (33%) patients have molecular aberration of the 12 DEGs. After analysis, it was shown that the gene aberration has no significant correlation with clinical parameters like gender, age or cancer stage. Among those genes, COL12A1 is the most prone to aberration (15%) like missense mutation. In addition, there were 68 mutation types have been detected in all cancer types containing 51 missenses, 15 truncating and 2 splice mutations (Figure S3). Interestingly, there was no mutation site in MMP12 DNA sequence which implied it is highly conserved. Certainly, the copy number alteration occurs in each gene containing both amplification and deep deletion. Furthermore, according to the methylation analysis, it was demonstrated that in GC samples, ASPN, C16orf89, CCKBR and COL1A1 have high methylation levels. Followed by drawing the overall survival curve of the altered (n = 146) and unaltered (n = 289) group, the median months overall (95% CI) was 30.88 and 28.55 without significant difference (Log rank Test p-value: 0.33).
Figure 4.
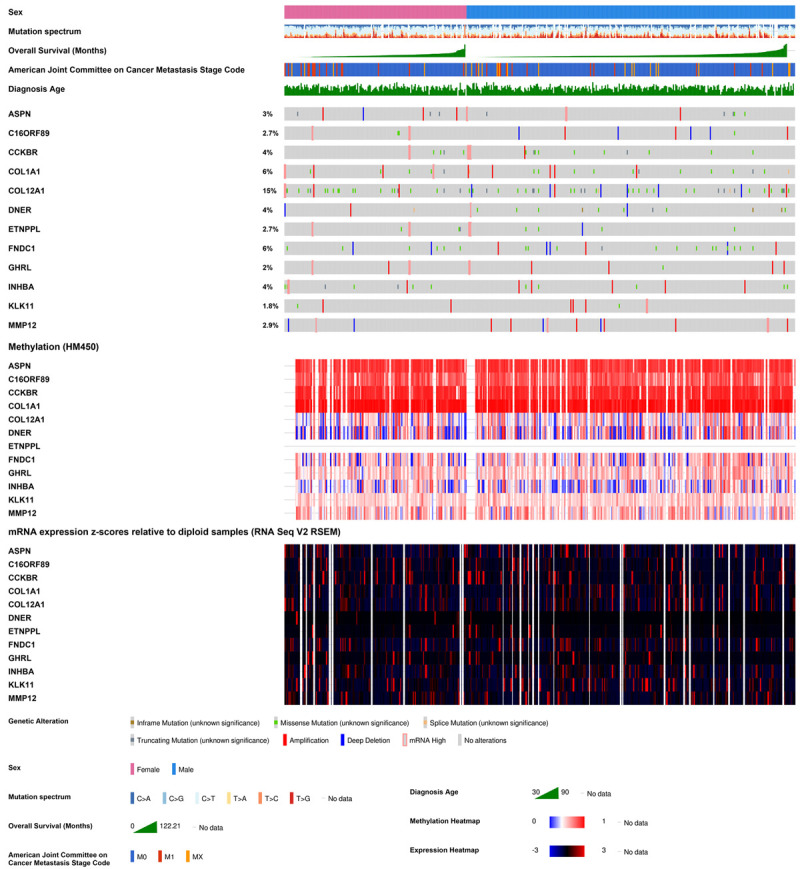
12 DEGs in GC patients based on TCGA. The integrated plot of clinical data and molecular aberrations of DEGs in 443 GC samples. From top to bottom panels indicate: sex, mutation spectrum, American Joint Committee on Cancer tumor stage code, diagnosis age, overall survival (months), the heatmap of DEGs’ aberrations, methylation and RNA expression. The key to the color-coding is at the bottom.
The correlation between DEGs and classical cancer pathways
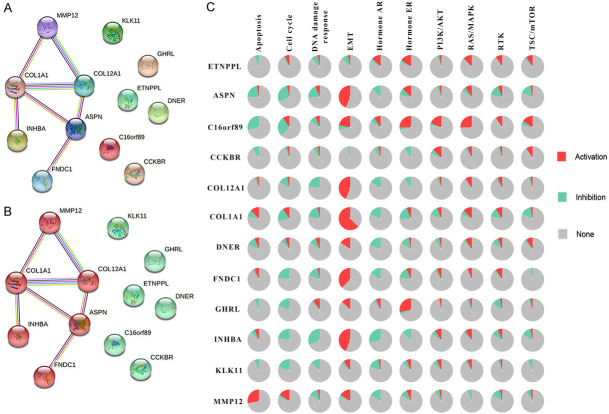
Genes often interact with each other to form a molecular network and participate in multi biological processes. To further study the function mode of the above 12 DEGs, a PPI analysis was performed according to STRING database [34]. Those genes were be clustered into 2 groups. Among them, COL1A1, COL12A1, ASPN, FNDC1, INHBA and MMP12 could construct a network while there was no proven correlation among the other genes (Figure 5A and 5B). To study the function of this network, an enrichment analysis was performed. A total of 3 MF, 9 BP, 8 CC and 1 pathway were enriched which are most interrelated with the extracellular matrix (Figure S4). The GC has a strong invasion ability and abnormal regulation of extracellular matrix would promote metastasis of cancer cells. Among the 10 classic cancer signaling pathways, the EMT pathway is closely related to the extracellular matrix. By calculating the relationship between genes and pathway status in GC patients, it was found that all genes in the PPI network can activate the EMT pathway more frequently than their inhibitory effects, besides ETNPPL and CCKBR (Figure 5C). Of course, there may not be a change in EMT status in the majority of patients. Interestingly, COL1A1 was the gene with the highest frequency of activating the EMT pathway (> 50%). Therefore, it is believed that the molecular network composed of these 12 differential genes may promote the malignant transformation of GC cells by activating the EMT pathway.
Figure 5.
The function analysis of DEGs network. A, B. The PPI network of 12 DEGs. Each circle represents one single gene. The edge with different colors represents different interactions. C. The pie chart shows the activation and inhibition percentage of each pathway among GC patients. The legend was listed on the right.
Notably, in the PPI network, COL1A1 has the most interaction relationships (MMP12, CLO12A1, ASPN and INHBA) and activates the EMT pathway in most GC patients simultaneously (> 50%). It may be suggested that the COL1A1 was the central gene in this molecular network. Moreover, in this network, the ASPN, COL12A1, INHBA and MMP12 interact with COL1A1 directly. The correlation calculation results indicated that the ASPN (R = 0.42), COL12A1 (R = 0.74) and INHBA (R = 0.63) had positive correlative with COL1A1 (p-value < 0.001) while MMP12 was uncorrelated (R = 0.061, p-value = 0.2) (Figure 6A-D). The immunohistochemical pictures of normal and GC tissues showed that the protein level of COL1A1 was increased and the cell morphology was more irregular with increased intercellular space and less compact arrangement (Figure 6E). This was probably because COL1A1 activating the EMT pathway results in cellular polarity/adhesion being lost and invasive/migratory properties being enhanced.
Figure 6.
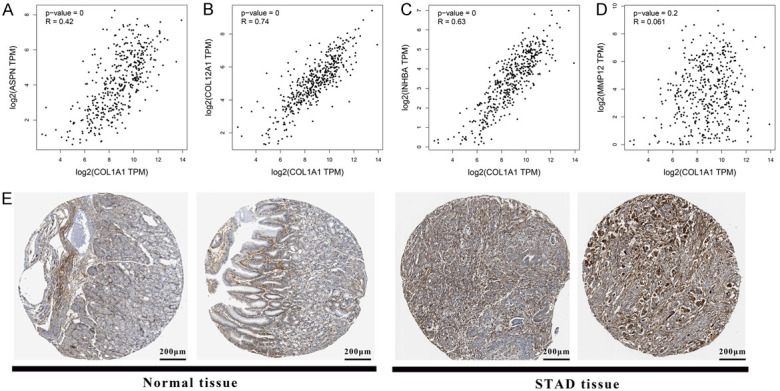
The correlation between COL1A1 and interactive genes. A-D. The correlation between COL1A1 and ASPN, COL12A1, INHBA and MMP12, respectively. Each point represents one single sample. The p-value and R-value were listed on the left. E. The immunohistochemical pictures of normal and tumor tissues which were stained by COL1A1 antibody.
Construction of a prognostic model based on the COL1A1-network
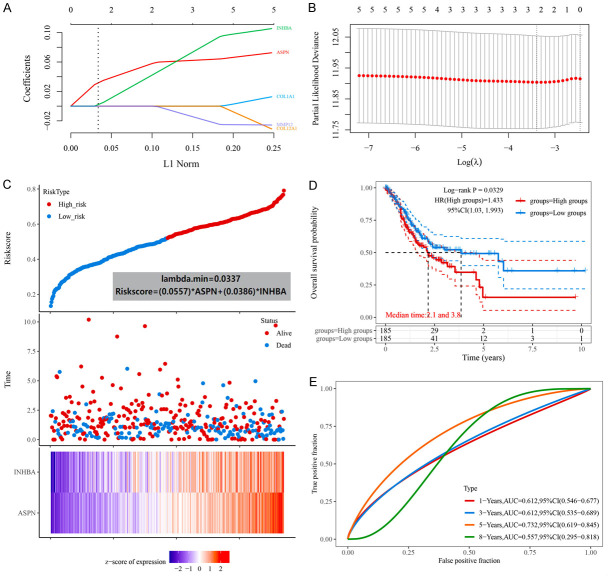
The expression level of each gene in the COL1A1-network was significantly correlative with prognosis and the network has been confirmed to potentially active the EMT pathway, a key mechanism of GC metastasis. To determine the value of the network in the prognosis estimation of GC patients, a prognostic model based on COL1A1-network was constructed with the LASSO Cox regression model. In this model, all GC patients could be divided into 2 groups with different risk scores (high and low risk) based on the expression of ASPN and INHBA (Figure 7A-C). This indicated that the expression levels of ASPN and INHBA are the most important for patient prognosis in this molecular network prognostic model. The formula of risk score was:
Figure 7.
The prognostic mode based on COL1A1-network. A. The coefficients of selected features are shown by lambda parameter. The abscissa represents the value of lambda, and the ordinate represents the coefficients of the independent variable. B. The relationship between partial likelihood deviance and log (λ) is plotted using LASSO Cox regression model. C. The Riskscore, survival time and survival status of selected dataset. The top scatterplot represents the Riskscore from low to high. Different colors represent different groups. The scatter plot distribution represents the Riskscore of different samples correspond to the survival time and survival status. The buttom heatmap show the expression of ASPN and INHBA. D. Kaplan-Meier survival analysis of different groups was made by log-rank test. HR (High exp) represents the hazard ratio of the low-expression sample relatives to the high-expression sample. E. The ROC curve and AUC of the gene. The higher values of AUC corresponding to higher predictive power.
Riskscore = (0.0557) * ASPN + (0.0386) * INHBA
According to the risk score, the patients were divided into high-risk and low-risk groups (n = 185). The median survival times were 2.1 and 3.8 years, respectively (Figure 7D). The Log-rank p-value = 0.0329, HR (high group) = 1.433 and 95% CI (1.03, 1.993). This indicated that the prognostic model can divide patients into 2 groups with significant differences in survival. To evaluate whether this model can objectively predict prognosis, the AUC values of 1-years (0.612, 95% CI (0.546, 0.677)), 3-years (0.612, 95% CI (0.535, 0.689)), 5-years (0.732, 95% CI (0.619, 0.845)) and 8-years (0.557, 95% CI (0.295, 0.818)) were calculated (Figure 7E). Among them, the AUC value greater than 0.7 indicated that this model had a better prognostic evaluation effect and clinical reference value. In conclusion, this prognostic model based on the COL1A1-network could predict 5-years prognosis of GC patients. However, although ASPN and INHBA may increase the risk of GC in patients as main factors in this prognostic model based on the COL1A1 molecular network, this indirectly indicates the clinical value of COL1A1 in the diagnosis and treatment of GC.
Discussion
The GC has a high degree of malignancy. Due to the lack of early diagnostic markers, the pathological tissue is difficult to detect in time only by gastroscopy. The GC patients were often in the advanced stage when diagnosed, accompanied by multiple organ metastases of tumor cells. Currently, gastrectomy is the common clinical treatment, which seriously affects the life quality and has poor efficacy. Therefore, screening effective early diagnostic markers and potential therapeutic targets are important for the prevention and treatment of GC.
In the present study, the DEGs of GC vs. adjacent tissues were screened firstly. After enrichment analysis, the DEGs may be involved in GC carcinogenesis and regarded as potential markers or therapeutic targets. To improve the accuracy, the bulk RNA-seq datasets of GC and adjacent from both GEO and TCGA databases were obtained for transcriptome analysis. There were 89 overlapping DEGs which were detected followed by functional enrichment and survival analysis. Among them, only 12 genes were significantly correlative with overall survival in different expression levels. In addition, once C16orf89, CCKBR, DNER, ETNPPL, GHRL and MMP12 were dysregulated in GC, the prognosis may be better. For example, in a study by Li et al. [35], it was confirmed that stable downregulation of CCKBR could result in reduced proliferation, migration and invasion of GC cell lines (BGC-823 and SGC-7901). Downregulation of CCKBR also inhibited the growth of gastric tumors in vivo. This is consistent with the results of our study, suggesting that CCKBR can improve the prognosis of GC patients. However, the evidence verifying the correlation between other genes and GC is scant.
COL1A1 is a member of the collagen family, and the abnormal expression of COL1A1 has been confirmed to be associated with the occurrence of some cancers [18,36]. In addition, it has also been proven to promote the progression of multiple cancers [22]. COL1A1 is a reliable biomarker and a potential therapeutic target for hepatocellular carcinogenesis and metastasis [37]. However, the role and molecular mechanism of COL1A1 in GC development remain unclear. According to the PPI network in our study, the ASPN was correlative with both COL1A1 and COL12A1, which belong to the collagen family. In Marco et al.’s study [38], an Aspn-/- mouse model and the investigation of the Aspn-/- skin phenotype were constructed successfully. Functionally, Aspn-/- mice had an increased skin mechanical toughness, although there were no structural changes present on histology or immunohistochemistry. Electron microscopy showed 7% thinner collagen fibrils in Aspn-/- mice. Several matrix genes were up-regulated, including collagens COL1A1. It further confirmed that the ASPN may negatively regulate COL1A1. In conclusion, it suggested the ASPN might be the upstream regulator of the collagen family.
Among those 12 DEGs, COL1A1 was an activating gene of the EMT pathway with the most frequency. Nevertheless, the mechanism is still unknown. In Guo et al.’s study [39], it was detected that the COL1A1 was upregulated in GC tissue, while the miR-133b was significantly down-regulated. Overexpression of miR-133b could suppress the migration and invasion of GC cells. In addition, the EMT process was inhibited as well. COL1A1 has been verified as a target gene of miR-133b and its overexpression had a significant impact on the prognosis of GC patients. GSEA pathway enrichment results showed that COL1A1 was markedly enriched in the TGF-β signaling pathway. In addition, COL1A1 overexpression induced the activation of the TGF-β signaling pathway to promote proliferation and migration of GC cells. As well known, the correlation between the TGF-β signaling pathway and EMT pathway has been proved adequately [40]. In Wang et al.’s study [41], it has also been proved in colon cancer, the overexpression of COL1A1 promoted cell viability, migration, invasion and EMT pathway. In conclusion, these findings may offer new insights into the development of new treatments against GC. Our results may also assist in identifying potential biomarkers for the timely diagnosis and prognosis of GC. In addition, more basic experiments may be needed to elucidate the mechanism.
Acknowledgements
The authors are grateful to the school health care staff who participated in this study. This study was approved by the Medical Ethics Committee of the Affiliated Hospital of Xuzhou Medical University.
Disclosure of conflict of interest
None.
Abbreviations
- GC
Gastric Carcinoma
- EMT
Epithelial-Mesenchymal Transition
- CSCs
Cancer Stem Cells
- COL-1
Type I Collagen
- GSEA
Gene Set Enrichment Analysis
- BP
Biological Process
- CC
Cellular Component
- MF
Molecular Function
- PPI
Protein-Protein Interaction
- MCODE
Molecular Complex Detection
- HR
Hazard Ratio
- FDR
False Discovery Rate
- IHC
Immunohistochemistry
- HSD
Honest Significant Difference
Supporting Information
References
- 1.Zhu X, Li J. Gastric carcinoma in China: current status and future perspectives (review) Oncol Lett. 2010;1:407–412. doi: 10.3892/ol_00000071. [DOI] [PMC free article] [PubMed] [Google Scholar]
- 2.Jemal A, Bray F, Center MM, Ferlay J, Ward E, Forman D. Global cancer statistics. CA Cancer J Clin. 2011;61:69–90. doi: 10.3322/caac.20107. [DOI] [PubMed] [Google Scholar]
- 3.Xu AM, Huang L, Liu W, Gao S, Han WX, Wei ZJ. Neoadjuvant chemotherapy followed by surgery versus surgery alone for gastric carcinoma: systematic review and meta-analysis of randomized controlled trials. PLoS One. 2014;9:e86941. doi: 10.1371/journal.pone.0086941. [DOI] [PMC free article] [PubMed] [Google Scholar]
- 4.Memon MA, Subramanya MS, Khan S, Hossain MB, Osland E, Memon B. Meta-analysis of D1 versus D2 gastrectomy for gastric adenocarcinoma. Ann Surg. 2011;253:900–911. doi: 10.1097/SLA.0b013e318212bff6. [DOI] [PubMed] [Google Scholar]
- 5.Xu AM, Huang L, Zhu L, Wei ZJ. Significance of peripheral neutrophil-lymphocyte ratio among gastric cancer patients and construction of a treatment-predictive model: a study based on 1131 cases. Am J Cancer Res. 2014;4:189–195. [PMC free article] [PubMed] [Google Scholar]
- 6.Huang L, Xu A, Li T, Han W, Wu S, Wang Y. Detection of perioperative cancer antigen 72-4 in gastric juice pre- and post-distal gastrectomy and its significances. Med Oncol. 2013;30:651. doi: 10.1007/s12032-013-0651-3. [DOI] [PubMed] [Google Scholar]
- 7.Xu AM, Huang L, Han WX, Wei ZJ. Monitoring of peri-distal gastrectomy carbohydrate antigen 19-9 level in gastric juice and its significance. Int J Clin Exp Med. 2014;7:230–238. [PMC free article] [PubMed] [Google Scholar]
- 8.Chaffer CL, Weinberg RA. A perspective on cancer cell metastasis. Science. 2011;331:1559–1564. doi: 10.1126/science.1203543. [DOI] [PubMed] [Google Scholar]
- 9.Montemayor-Garcia C, Hardin H, Guo Z, Larrain C, Buehler D, Asioli S, Chen H, Lloyd RV. The role of epithelial mesenchymal transition markers in thyroid carcinoma progression. Endocr Pathol. 2013;24:206–212. doi: 10.1007/s12022-013-9272-9. [DOI] [PMC free article] [PubMed] [Google Scholar]
- 10.Liang Q, Li L, Zhang J, Lei Y, Wang L, Liu DX, Feng J, Hou P, Yao R, Zhang Y, Huang B, Lu J. CDK5 is essential for TGF-β1-induced epithelial-mesenchymal transition and breast cancer progression. Sci Rep. 2013;3:2932. doi: 10.1038/srep02932. [DOI] [PMC free article] [PubMed] [Google Scholar]
- 11.Zhao L, Li W, Zang W, Liu Z, Xu X, Yu H, Yang Q, Jia J. JMJD2B promotes epithelial-mesenchymal transition by cooperating with β-catenin and enhances gastric cancer metastasis. Clin Cancer Res. 2013;19:6419–6429. doi: 10.1158/1078-0432.CCR-13-0254. [DOI] [PubMed] [Google Scholar]
- 12.Sleeman JP, Thiery JP. SnapShot: the epithelial-mesenchymal transition. Cell. 2011;145:162.e1. doi: 10.1016/j.cell.2011.03.029. [DOI] [PubMed] [Google Scholar]
- 13.Huang L, Xu AM, Liu S, Liu W, Li TJ. Cancer-associated fibroblasts in digestive tumors. World J Gastroenterol. 2014;20:17804–17818. doi: 10.3748/wjg.v20.i47.17804. [DOI] [PMC free article] [PubMed] [Google Scholar]
- 14.Chowdhury SR, Mh Busra MF, Lokanathan Y, Ng MH, Law JX, Cletus UC, Binti Haji Idrus R. Collagen type I: a versatile biomaterial. Adv Exp Med Biol. 2018;1077:389–414. doi: 10.1007/978-981-13-0947-2_21. [DOI] [PubMed] [Google Scholar]
- 15.Zhu X, Luo X, Jiang S, Wang H. Bone morphogenetic protein 1 targeting COL1A1 and COL1A2 to regulate the epithelial-mesenchymal transition process of colon cancer SW620 cells. J Nanosci Nanotechnol. 2020;20:1366–1374. doi: 10.1166/jnn.2020.17362. [DOI] [PubMed] [Google Scholar]
- 16.Exposito JY, Valcourt U, Cluzel C, Lethias C. The fibrillar collagen family. Int J Mol Sci. 2010;11:407–426. doi: 10.3390/ijms11020407. [DOI] [PMC free article] [PubMed] [Google Scholar]
- 17.Ibanez de Caceres I, Dulaimi E, Hoffman AM, Al-Saleem T, Uzzo RG, Cairns P. Identification of novel target genes by an epigenetic reactivation screen of renal cancer. Cancer Res. 2006;66:5021–5028. doi: 10.1158/0008-5472.CAN-05-3365. [DOI] [PubMed] [Google Scholar]
- 18.Hayashi M, Nomoto S, Hishida M, Inokawa Y, Kanda M, Okamura Y, Nishikawa Y, Tanaka C, Kobayashi D, Yamada S, Nakayama G, Fujii T, Sugimoto H, Koike M, Fujiwara M, Takeda S, Kodera Y. Identification of the collagen type 1 α 1 gene (COL1A1) as a candidate survival-related factor associated with hepatocellular carcinoma. BMC Cancer. 2014;14:108. doi: 10.1186/1471-2407-14-108. [DOI] [PMC free article] [PubMed] [Google Scholar]
- 19.Bonazzi VF, Nancarrow DJ, Stark MS, Moser RJ, Boyle GM, Aoude LG, Schmidt C, Hayward NK. Cross-platform array screening identifies COL1A2, THBS1, TNFRSF10D and UCHL1 as genes frequently silenced by methylation in melanoma. PLoS One. 2011;6:e26121. doi: 10.1371/journal.pone.0026121. [DOI] [PMC free article] [PubMed] [Google Scholar]
- 20.Kita Y, Mimori K, Tanaka F, Matsumoto T, Haraguchi N, Ishikawa K, Matsuzaki S, Fukuyoshi Y, Inoue H, Natsugoe S, Aikou T, Mori M. Clinical significance of LAMB3 and COL7A1 mRNA in esophageal squamous cell carcinoma. Eur J Surg Oncol. 2009;35:52–58. doi: 10.1016/j.ejso.2008.01.025. [DOI] [PubMed] [Google Scholar]
- 21.Wu YH, Chang TH, Huang YF, Huang HD, Chou CY. COL11A1 promotes tumor progression and predicts poor clinical outcome in ovarian cancer. Oncogene. 2014;33:3432–3440. doi: 10.1038/onc.2013.307. [DOI] [PubMed] [Google Scholar]
- 22.Ramaswamy S, Ross KN, Lander ES, Golub TR. A molecular signature of metastasis in primary solid tumors. Nat Genet. 2003;33:49–54. doi: 10.1038/ng1060. [DOI] [PubMed] [Google Scholar]
- 23.Zhao Q, Xie J, Xie J, Zhao R, Song C, Wang H, Rong J, Yan L, Song Y, Wang F, Xie Y. Weighted correlation network analysis identifies FN1, COL1A1 and SERPINE1 associated with the progression and prognosis of gastric cancer. Cancer Biomark. 2021;31:59–75. doi: 10.3233/CBM-200594. [DOI] [PubMed] [Google Scholar]
- 24.Li L, Zhu Z, Zhao Y, Zhang Q, Wu X, Miao B, Cao J, Fei S. FN1, SPARC, and SERPINE1 are highly expressed and significantly related to a poor prognosis of gastric adenocarcinoma revealed by microarray and bioinformatics. Sci Rep. 2019;9:7827. doi: 10.1038/s41598-019-43924-x. [DOI] [PMC free article] [PubMed] [Google Scholar]
- 25.Tian Y, Ma L, Cai X, Zhu J. Statistical method based on bayes-type empirical score test for assessing genetic association with multilocus genotype data. Int J Genomics. 2020;2020:4708152. doi: 10.1155/2020/4708152. [DOI] [PMC free article] [PubMed] [Google Scholar]
- 26.Chen X. False discovery rate control for multiple testing based on discrete p-values. Biom J. 2020;62:1060–1079. doi: 10.1002/bimj.201900163. [DOI] [PubMed] [Google Scholar]
- 27.Chen L, Lu D, Sun K, Xu Y, Hu P, Li X, Xu F. Identification of biomarkers associated with diagnosis and prognosis of colorectal cancer patients based on integrated bioinformatics analysis. Gene. 2019;692:119–125. doi: 10.1016/j.gene.2019.01.001. [DOI] [PubMed] [Google Scholar]
- 28.Huang da W, Sherman BT, Lempicki RA. Systematic and integrative analysis of large gene lists using DAVID bioinformatics resources. Nat Protoc. 2009;4:44–57. doi: 10.1038/nprot.2008.211. [DOI] [PubMed] [Google Scholar]
- 29.Szklarczyk D, Franceschini A, Wyder S, Forslund K, Heller D, Huerta-Cepas J, Simonovic M, Roth A, Santos A, Tsafou KP, Kuhn M, Bork P, Jensen LJ, von Mering C. STRING v10: protein-protein interaction networks, integrated over the tree of life. Nucleic Acids Res. 2015;43:D447–452. doi: 10.1093/nar/gku1003. [DOI] [PMC free article] [PubMed] [Google Scholar]
- 30.Li R, Yang YE, Yin YH, Zhang MY, Li H, Qu YQ. Methylation and transcriptome analysis reveal lung adenocarcinoma-specific diagnostic biomarkers. J Transl Med. 2019;17:324. doi: 10.1186/s12967-019-2068-z. [DOI] [PMC free article] [PubMed] [Google Scholar]
- 31.Ladas EJ, Blonquist TM, Puligandla M, Orjuela M, Stevenson K, Cole PD, Athale UH, Clavell LA, Leclerc JM, Laverdiere C, Michon B, Schorin MA, Greene Welch J, Asselin BL, Sallan SE, Silverman LB, Kelly KM. Protective effects of dietary intake of antioxidants and treatment-related toxicity in childhood leukemia: a report from the DALLT cohort. J. Clin. Oncol. 2020;38:2151–2159. doi: 10.1200/JCO.19.02555. [DOI] [PubMed] [Google Scholar]
- 32.Angelova M, Charoentong P, Hackl H, Fischer ML, Snajder R, Krogsdam AM, Waldner MJ, Bindea G, Mlecnik B, Galon J, Trajanoski Z. Characterization of the immunophenotypes and antigenomes of colorectal cancers reveals distinct tumor escape mechanisms and novel targets for immunotherapy. Genome Biol. 2015;16:64. doi: 10.1186/s13059-015-0620-6. [DOI] [PMC free article] [PubMed] [Google Scholar]
- 33.Wang Z, Tang W, Yuan J, Qiang B, Han W, Peng X. Integrated analysis of RNA-binding proteins in glioma. Cancers (Basel) 2020;12:892. doi: 10.3390/cancers12040892. [DOI] [PMC free article] [PubMed] [Google Scholar]
- 34.von Mering C, Huynen M, Jaeggi D, Schmidt S, Bork P, Snel B. STRING: a database of predicted functional associations between proteins. Nucleic Acids Res. 2003;31:258–261. doi: 10.1093/nar/gkg034. [DOI] [PMC free article] [PubMed] [Google Scholar]
- 35.Li M, Chang J, Ren H, Song D, Guo J, Peng L, Zhou X, Zhao K, Lu S, Liu Z, Hu P. Downregulation of CCKBR expression inhibits the proliferation of gastric cancer cells, revealing a potential target for immunotoxin therapy. Curr Cancer Drug Targets. 2022;22:257–268. doi: 10.2174/1568009622666220106113616. [DOI] [PubMed] [Google Scholar]
- 36.Lv J, Guo L, Wang JH, Yan YZ, Zhang J, Wang YY, Yu Y, Huang YF, Zhao HP. Biomarker identification and trans-regulatory network analyses in esophageal adenocarcinoma and Barrett’s esophagus. World J Gastroenterol. 2019;25:233–244. doi: 10.3748/wjg.v25.i2.233. [DOI] [PMC free article] [PubMed] [Google Scholar]
- 37.Ma HP, Chang HL, Bamodu OA, Yadav VK, Huang TY, Wu ATH, Yeh CT, Tsai SH, Lee WH. Collagen 1A1 (COL1A1) is a reliable biomarker and putative therapeutic target for hepatocellular carcinogenesis and metastasis. Cancers (Basel) 2019;11:786. doi: 10.3390/cancers11060786. [DOI] [PMC free article] [PubMed] [Google Scholar]
- 38.Maccarana M, Svensson RB, Knutsson A, Giannopoulos A, Pelkonen M, Weis M, Eyre D, Warman M, Kalamajski S. Asporin-deficient mice have tougher skin and altered skin glycosaminoglycan content and structure. PLoS One. 2017;12:e0184028. doi: 10.1371/journal.pone.0184028. [DOI] [PMC free article] [PubMed] [Google Scholar]
- 39.Guo Y, Lu G, Mao H, Zhou S, Tong X, Wu J, Sun Q, Xu H, Fang F. miR-133b suppresses invasion and migration of gastric cancer cells via the COL1A1/TGF-β axis. Onco Targets Ther. 2020;13:7985–7995. doi: 10.2147/OTT.S249667. [DOI] [PMC free article] [PubMed] [Google Scholar]
- 40.Song J, Shi W. The concomitant apoptosis and EMT underlie the fundamental functions of TGF-β. Acta Biochim Biophys Sin (Shanghai) 2018;50:91–97. doi: 10.1093/abbs/gmx117. [DOI] [PubMed] [Google Scholar]
- 41.Wang X, Song Z, Hu B, Chen Z, Chen F, Cao C. MicroRNA‑642a‑5p inhibits colon cancer cell migration and invasion by targeting collagen type I α1. Oncol Rep. 2021;45:933–944. doi: 10.3892/or.2020.7905. [DOI] [PMC free article] [PubMed] [Google Scholar] [Retracted]
Associated Data
This section collects any data citations, data availability statements, or supplementary materials included in this article.


