

Abstract
Introduction
Paediatric AML patients with hyperleukocytosis have a poor prognosis and higher early mortality. Therefore, more studies are needed to explore relevant prognostic indicators and develop effective prevention strategies for this type of childhood AML.
Methods
All original data were obtained from the TARGET database. First, we explored meaningful differentially expressed genes (DEGs) between the hyperleukocytosis group and the non‐hyperleukocytosis group. Next, we screened and identified valuable target genes using univariate Cox regression, Cytoscape software, and Kaplan–Meier survival curves. Finally, the coexpressed genes, functional networks, and immune‐related activities associated with the target gene were deeply analysed by the GeneMANIA, LinkedOmics, GEPIA2021, TISIDB, and GSCA databases.
Results
We selected 1229 DEGs between the hyperleukocytosis group and the non‐hyperleukocytosis group in paediatric AML patients. Among them, 495 DEGs were significantly linked with the overall survival of paediatric AML patients. Further, we discovered that CX3CR1 was a promising target gene. Meanwhile, we identified CX3CR1 as an independent prognostic predictor. Besides, we showed that CX3CR1 had strong physical interactions with CX3CL1. Additionally, functional network analysis suggested that CX3CR1 and its coexpressed genes modulated immune response pathways. Subsequent analysis found that immune cells with a high median value of CX3CR1 were monocytes, resting NK cells and CD8 T cells. Finally, we observed that CX3CR1 expression correlated with infiltrating levels of immune cells and immune signatures.
Conclusion
Elevated CX3CR1 expression may be an adverse prognostic indicator in paediatric AML patients undergoing hyperleukocytosis. Moreover, CX3CR1 may serve as an immunotherapeutic target for AML with hyperleukocytosis in children.
Keywords: acute myeloid leukaemia, CX3CR1, hyperleukocytosis, paediatric AML
1. INTRODUCTION
Acute myeloid leukaemia (AML) is a heterogeneous haematopoietic stem cell malignancy characterized by clonal proliferation and blocked differentiation of myeloid precursors. AML is highly differentiated in morphology, immunophenotype, cytogenetics, epigenetic characteristics, and response to treatment. 1 In children, the most common types of acute leukaemia are acute lymphoblastic leukaemia (ALL) and AML, accounting for 75%–80% and 15%–20% of paediatric acute leukaemia cases, respectively. 2
Compared with childhood ALL, the therapeutic effect of AML is poor, and the progress of treatment is lagging. Compared with the overall survival rate of more than 90% in paediatric ALL, the overall survival rate of AML is only 70%, and 30% of patients will relapse. It is still the main cause of death in paediatric leukaemia. 3
Hyperleukocytosis is a specific syndrome of leukaemia patients, mainly caused by the proliferation of leukaemia cells and defined by a white blood cell (WBC) count of greater than 100 × 109/L. 4 Previous evidence revealed that higher WBC counts lead to a worse prognosis in children and adults with AML. 5 , 6 Hyperleukocytosis, prominently manifested as leukostasis syndrome, is considered a medical emergency and contributes to the development of leukostasis, disseminated intravascular coagulation (DIC), and tumour lysis syndrome (TLS), increasing long‐term relapse and early‐stage mortality in leukaemia patients. 7 In clinical practice, the current main treatment options for hyperleukocytosis include emergency leukocytosis, intensive chemotherapy (IC), and hydroxyurea. 8
To date, a study has reported that hyperleukocytosis indicated unfavourable poor prognosis in paediatric AML. 9 Thus, it is of great significance to identify novel prognostic factors for paediatric AML patients with hyperleukocytosis. However, studies on the molecular markers of prognosis in paediatric AML with hyperleukocytosis are paucity. 10 Using gene expression and clinical profile data from the TARGET database in the present study, we explored the genes associated with childhood AML with hyperleukocytosis, screened out a meaningful targeted gene, and further comprehensively analysed its functional mechanism.
2. MATERIALS AND METHODS
2.1. Data sources and preprocessing
Clinical information and mRNA‐seq data for AML patients were obtained from The Therapeutically Applicable Research to Generate Effective Treatments (TARGET) dataset (http://ocg.cancer.gov/). The year of diagnosis ranged from 1996 to 2016, while the year of the last follow‐up ranged from 1997 to 2019. Criteria for exclusion were unknown WBC at diagnosis, unknown peripheral blood (PB), and bone marrow (BM) leukaemic blast percentages. A total of 1894 paediatric AML patients younger than 18 years old were included in our study. Of these, 1484 patients had a WBC count of<100 × 109/L, whereas 410 patients had hyperleukocytosis (WBC count of ≥100 × 109/L). Clinical characteristics at diagnosis were publicly available in the database, including survival status, survival time, gender, race, age, treatment protocols, PB and BM leukaemic blast percentages, central nervous system leukaemia (CNSL), chloroma, French‐American‐British (FAB) subtypes, MLL status, FLT3. ITD status, NPM status, CEBPA status, risk group, and SCT in 1st CR. OS was the primary endpoint of the research.
2.2. Identification and functional enrichment analysis of differentially expressed genes (DEGs)
First, we combined clinical information with mRNA‐seq data from AML patients using Perl. Next, we obtained data, including 1109 patient samples (WBC count of<100 × 109/L) and 293 patient samples (WBC count of ≥100 × 109/L). The R package “edgeR” was utilized to screen for differentially expressed mRNAs between WBC count of<100 × 109/L and WBC count of ≥100 × 109/L samples. Fold change (FC) ≥2 and adjusted p < 0.05 were set as the threshold values in DEGs. The volcano map was depicted by the “gplots” package on the R platform. The R packages “clusterProfiler” and “enrichplot” were used for Kyoto Encyclopedia of Genes and Genomes (KEGG) and Gene Ontology (GO) analysis.
2.3. Protein–protein, interaction (PPI) network, hub genes, and module analysis
The Search Tool for the Retrieval of Interacting Genes (STRING) database (http://string.embl.de/) is an online tool, which was used to assess the associations between different proteins. 11 Interactions with a combined score >0.7 were considered statistically significant. The PPI network of DEGs was visualized by Cytoscape software. The cytoHubba plugin and Molecular Complex Detection (MCODE) plugin of Cytoscape were performed to identify hub genes and screen the modules with the default values. Then, we used the Kaplan–Meier survival analysis to identify whether hub genes could be used as prognostic biomarkers for paediatric AML patients with hyperleukocytosis.
2.4. Uni‐ and multivariable analyses of CX3CR1 on OS
To examine whether the impact of CX3CR1 expression on the survival of paediatric AML with hyperleukocytosis was independent, we constructed univariate and multivariable Cox proportional hazard models using the R package. The expression level of CX3CR1 was dichotomized as high and low with the median as the cut‐off value.
2.5. The potential functions of CX3CR1 in AML by various databases
GeneMANIA (http://genemania.org/) is a quick and convenient website for the construction of gene interaction networks. 12 We found a relationship between the CX3CR1 gene and functionally similar gene sets using GeneMANIA in this study.
LinkedOmics (http://www.linkedomics.org) is an open multi‐omics database consisting of LinkFinder, LinkCompare, and LinkInterpreter modules, which are used to analyse and compare data within different types of cancers. 13
GEPIA2021 (http://gepia2021.cancer-pku.cn/) is a valuable platform that analyzes datasets at the cellular level based on the GEPIA database. 14 We visualized CX3CR1 expression levels in various immune cells by CIBERSORT through GEPIA2021.
GSCA (http://bioinfo.life.hust.edu.cn/GSCA/) is a flexible web server of genomic, pharmacogenomic, and immunogenomic for tumour analysis. 15 In this study, the GSVA enrichment score and immune cell infiltration presented the correlation between CXC3R1 and immunity in AML.
TISIDB (http://cis.hku.hk/TISIDB) is a powerful web portal, which studies the interaction of tumours and the immune system by integrating a variety of databases. 16 We evaluated the associations between CX3CR1 expression and immune‐related signatures in cancers.
2.6. Statistical analysis
Statistical analysis of this study was performed using R software v4.1.2. The clinical characteristics of the patients were represented by SPSS 22.6. Continuous variable datasets were described by median and range. In addition, we used the Wilcoxon‐Mann–Whitney test to compare the numerical data groups. We also used the Chi‐square test and Fisher's exact test to compare the categorical data groups. Univariate and multivariate Cox proportional hazard models were constructed for OS, which evaluated the hazard ratio (HR) with corresponding 95% confidence intervals (95% CI). A two‐tailed p < 0.05 was considered statistically significant.
3. RESULTS
3.1. Bioinformatics analysis procedure
The flow chart of this study bioinformatics analysis was shown in Figure S1. First, we acquired the original data from the TARGET database. AML patients were divided into the hyperleukocytosis group and the non‐hyperleukocytosis group, according to the WBC expression level. Second, we combined clinical data with gene expression and identified DEGs between the above groups. In addition, we demonstrated functional enrichment analysis of DEGs. Thirdly, we evaluated the prognostic significance of DEGs and selected valuable DEGs to construct a PPI network. Furthermore, we carried out hub gene and module analyses in Cytoscape. Finally, we estimated survival analysis of the hub genes and constructed univariate and multivariate Cox proportional hazard models of a target gene. Moreover, we illustrated the related functions of the target gene through a series of online databases.
3.2. Identification of DEGs
Expected as an adverse prognostic clinical parameter in paediatric AML patients, it is crucial to identify crucial mRNAs and understand the relevant processes and pathways affected by hyperleukocytosis. We screened DEGs of mRNA‐seq between 293 AML patients with hyperleukocytosis and 1109 AML patients with non‐hyperleukocytosis. Altogether, 1229 DEGs were detected (Table S1), of which 208 were upregulated (Table S2) and 1021 were downregulated (Table S3). The volcano plot of the DEGs was shown in Figure S2.
3.3. Functional and pathway enrichment analyses
To better understand the function of DEGs, GO and KEGG analyses were performed using R packages. As shown in Figure S3‐4 and Table S4–S5, for biological processes (BP), upregulated DEGs were particularly enriched in the regulation of cytokine production, response to external stimulus, immune effector process, and leukocyte mediated immunity, and downregulated DEGs were mainly enriched in axon development, synapse organization, cell junction assembly, and regulation of cell adhesion. For molecular function (MF), the upregulated DEGs were enriched in carbohydrate binding, peptide binding, and iron ion binding, and the downregulated DEGs were enriched in signalling receptor activator activity, receptor‐ligand activity, passive transmembrane transporter activity, and channel activity. In addition, cellular component (CC) analysis showed that the upregulated DEGs were enriched on the external side of the plasma membrane, and the downregulated DEGs were enriched in the collagen‐containing extracellular matrix, cell–cell junction, and apical part of a cell.
KEGG pathway analysis was conducted for total DEGs. The results showed that upregulated DEGs were enriched in pathways in amoebiasis, arachidonic acid metabolism, legionellosis, and the haematopoietic cell lineage (Figure S5, Table S6). The most significantly enriched pathways of the downregulated DEGs were ECM‐receptor interactions, malaria, protein digestion and absorption, cytokine‐cytokine receptor interaction, rheumatoid arthritis, cell adhesion molecules, focal adhesion, proximal tubule bicarbonate reclamation, axon guidance, nitrogen metabolism, PI3K‐Akt signalling pathway and viral protein interaction with cytokine and cytokine receptor (Figure S6, Table S7).
3.4. Hub gene, PPI and module analysis
Initially, through univariate Cox regression, we discovered that 495 DEGs were significantly linked with the OS of paediatric AML patients (p < 0.05) (Table S8). To unearth the interactions of the prognostic genes, PPIs with combined scores greater than 0.7 were selected for constructing PPI networks via the STRING database. Then, a PPI network, which included 22 upregulated genes and 83 downregulated genes, was visualized in Cytoscape (Figure 1A). The entire PPI network was analysed using MCODE, following which six modules were displayed according to the connective degrees (Figure 1B). Moreover, the CytoHubba plugin was used to determine the top 10 hub genes based on their MCC and MNC scores. These 10 hub genes included CD8A, CD1C, CD1B, CSF2, CD1A, CD5, CCL2, CXCL11, CX3CR1, and CXCL1. Among these 10 genes, CD1C, CD1B, CD1A, and CX3CR1 were upregulated DEGs, while CD8A, CSF2, CD5, CCL2, CXCL11, and CXCL1 were downregulated DEGs (Figure 1C).
FIGURE 1.
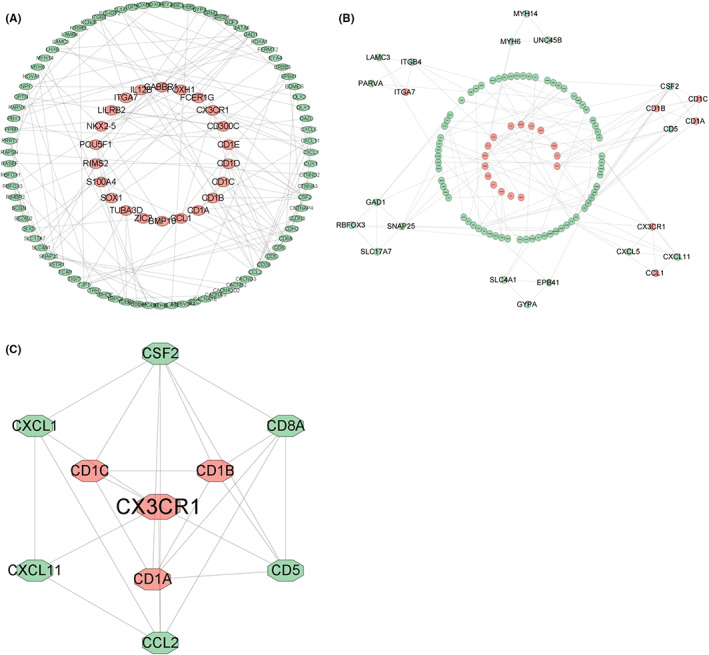
PPI network construction, module analysis and hub gene identification by Cytoscape. Red nodes: upregulated DEGs; green nodes: downregulated DEGs. (A) PPI network of DEGs linked with the OS of paediatric AML patients (p < 0.05). (B) Six modules screened from the PPI network using MCODE. (C) Ten identified hub genes from the PPI network using MCC and MNC of CytoHubba
3.5. Kaplan–Meier survival analysis of hub genes
The OS was analysed for 410 paediatric patients with hyperleukocytosis using the Kaplan–Meier survival plot. As shown in Figure 2, of upregulated DEGs, high levels of CX3CR1 (p = 0.031) and low levels of CD1C (p = 0.003) and CD1B (p = 0.004) were correlated with worse OS in patients; however, there was no significant correlation between CD1A (p = 0.128) and paediatric patients with hyperleukocytosis prognosis. Additionally, in the downregulated DEGs of hub genes, the levels of CSF2 (p = 0.083), CCL2 (p = 0.868), CXCL1 (p = 0.970), and CXCL11 (p = 0.123) showed no significant relations with prognosis; meanwhile, the high expression of CD8A (p = 0.004) and CD5 (p = 0.002) had a favourable prognosis in the patients. Based on the above integrated analyses, we finally chose CX3CR1 as a potential target gene and further explored the predictive value of the combination of expression and clinical characteristics of paediatric AML patients with hyperleukocytosis.
FIGURE 2.
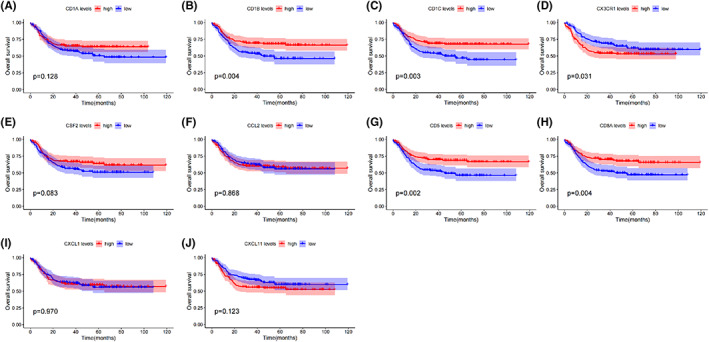
Prognostic value of hub genes for paediatric AML patients with hyperleukocytosis. Kaplan–Meier survival analysis for OS. (A) CD1A; (B) CD1B; (C) CD1C; (D) CX3CR1; (E) CSF2; (F) CCL2; (G) CD5; (H) CD8A; (I) CXCL1; (J) CXCL11
3.6. Differences in characteristics between the CX3CR1high and CX3CR1low groups
The baseline characteristics of all paediatric AML patients with hyperleukocytosis were divided into two groups according to the median CX3CR1 expression levels, as listed in Table S9. PB blast percentage, CNSL, FAB subtypes, treatment protocols, gene mutations (MLL, CEBPA), and risk group distribution were significantly different between the two subgroups. We also noticed no association of CX3CR1 expression with age, gender, race, BM leukaemic blast percentage, chloroma, or FLT3. ITD status, NPM status and SCT in 1st CR.
3.7. Independent prognostic analysis in paediatric AML patients with hyperleukocytosis
To examine whether the impact of CX3CR1 expression on paediatric AML patients with hyperleukocytosis survival was independent, we executed univariate and multivariate Cox proportional hazard models using multiple variables, including CX3CR1 expression, age, gender, race, treatment protocols, BM leukaemic blast percentage, PB leukaemic blast percentage, CNSL, chloroma, FAB subtypes, and FLT3. ITD status, MLL status, NPM status, CEBPA status, risk groups, and SCT in 1st CR (Tables S10 and S11).
In the univariate Cox analysis, high CX3CR1 expression, higher PB leukaemic blast percentage, and MLL mutation were associated with short OS (p = 0.00815, p = 0.0173, and p = 0.0122, respectively). CEBPA mutation was favourable for OS (p = 0.0125). In addition, FAB subtypes and risk groups were associated with survival. The results of multivariate Cox analysis revealed that CX3CR1 expression was an independent risk factor for OS (p = 0.02613), and PB leukaemic blast percentage, FAB subtypes, and risk groups were independent factors for prognosis prediction.
3.8. Functional enrichment and coexpression analyses of CX3CR1
To clarify the underlying mechanism of CX3CR1, we constructed a network of CX3CR1 and related gene sets using GeneMANIA. The network displayed the physical interactions (77.64%), co‐expression (8.01%), predicted (5.37%), co‐localization (3.63%), genetic interactions (2.87%), pathways (1.88%), and shared protein domains (0.60%). The results showed that 20 genes, CX3CL1, CCR8, MAF, ENDOU, GAS1, NPY5R, ZAP70, CSF1R, CYP2C9, CYP24A1, CEP112, EFHD1, IL1B, NPY1R, COL8A1, CALCOCO2, RNASE3, COL14A1, HOPX, and CCND2, were mainly related to the function of CX3CR1 (Figure 3A). CX3CR1 has strong physical interactions with CX3CL1, which is crucial in the migration of leukocytes and the pathogenesis of tumours.
FIGURE 3.
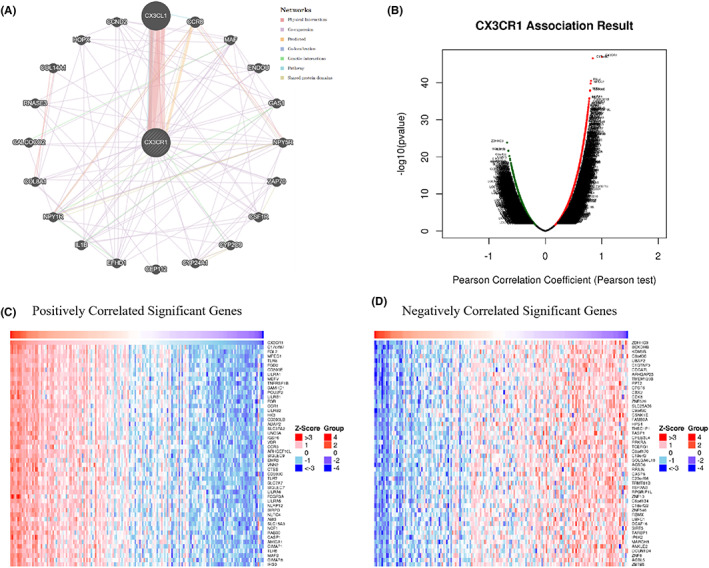
Analyses of genes that interact and are coexpressed with CX3CR1. (A) Interactive genes with CX3CR1 according to GeneMANIA. (B) The overall CX3CR1 highly correlated genes identified by Pearson's test in AML according to LinkedOmics. (C) Heatmap of the top 50 significant genes positively correlated with CX3CR1 in AML. (D) Heatmap of the top 50 significant genes negatively correlated with CX3CR1 in AML
Then, we explored the coexpressed genes of CX3CR1 in the AML cohort by LinkedOmics. As shown in the volcano plot (Figure 3B), genes (red dots) were significantly positively correlated with CX3CR1, while genes (green dots) were significantly negatively correlated with CX3CR1. Heatmaps displayed the top 50 significant gene sets positively and negatively linked with CX3CR1 (Figure 3C, D). Moreover, all coexpressed genes were shown in Table S12. We also found that SLP adaptor and CSK interacting membrane protein (C17orf87), fibrinogen like 2 (FGL2), and macrophage expressed 1 (MPEG1) were the top three genes significantly and positively correlated with CX3CR1. These results indicated that CX3CR1 has a widespread effect on the immune response.
Subsequently, we carried out GSEA of GO terms and KEGG pathways between CX3CR1 and its coexpressed genes in LinkedOmics. GO term analysis indicated that DEGs correlated with CX3CR1 were mainly located in the secretory granule membrane, ficolin‐1‐rich granules, and tertiary granules. These genes participate in neutrophil‐mediated immunity and immune response‐regulating signalling pathways. Their functions were principally enriched in cytokine receptor activity, antigen binding, cytokine binding, and immunoglobulin binding (Figure S7A‐C). KEGG pathway analysis revealed that the above genes were connected with the chemokine signalling pathway, the Toll‐like receptor signalling pathway and natural killer cell‐mediated cytotoxicity (Figure S7D).
3.9. Correlations between CX3CR1 expression and immune‐related genes and immune cell infiltrates
Based on the results of functional enrichment and coexpression analyses of CX3CR1, we found that CX3CR1 was closely related to tumour immunity. Hence, we investigated CX3CR1 expression levels in various immune cells through CIBERSORT in the GEPIA2021 database. As shown in Figure 4A, the top three types of immune cells with a high median value of CX3CR1 were monocytes (median value 5.2676), resting NK cells (median value 4.0955), and CD8 T cells (median value 2.5078). Additionally, we summarized the correlations between different types of immune cell infiltrations and the GSVA enrichment score of CX3CR1 in AML from the GSCA database (Figure 4B). CX3CR1 expression was significantly positively correlated with the infiltration levels of macrophages, monocytes, dendritic cells (DCs), cytotoxic T (Tc) cells, natural killer T (NKT) cells, neutrophils, exhausted T cells (Tex), and T helper 1 (Th1) cells. Conversely, CX3CR1 expression negatively correlated with the infiltration levels of central memory T (Tcm) cells, T helper 17 (Th17) cells, B cells, CD8(+) naive (CD8 naive) cells, CD8(+) T (CD8 T) cells, Tr1 cells, and CD4(+) T (CD4 T) cells.
FIGURE 4.
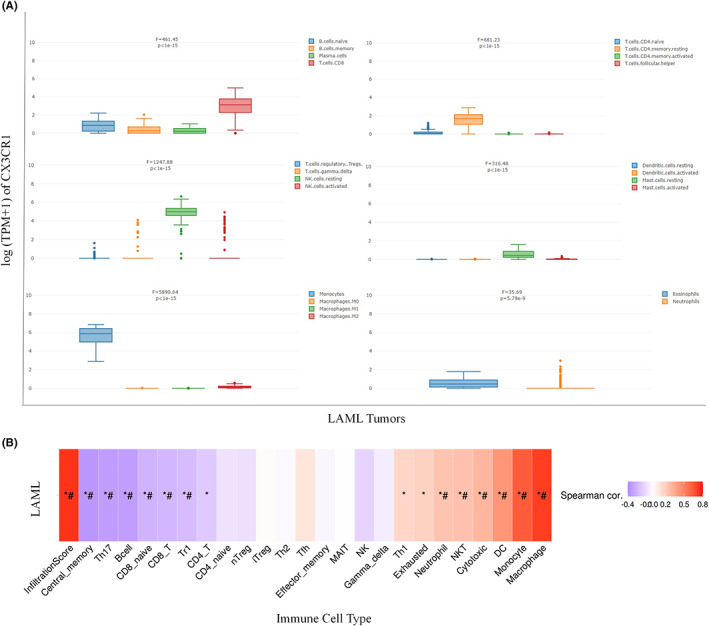
(A) CX3CR1 gene expression in various immune cells by CIBERSORT (GEPIA2021). (B) The association between immune cell infiltrates and GSVA score in AML. *p < 0.05; # FDR ≤ 0.05
To strengthen our understanding of the interrelationships between CX3CR1 expression and immunity, we presented the correlations of CX3CR1 with various immune‐related signatures across cancers from the TISIDB database. Spearman correlations between CX3CR1 and chemokines, immune inhibitors, immune stimulators, lymphocytes, MHC molecules, and chemokine receptors were shown in heatmaps (Figure 5A–F). CX3CR1 was positively correlated with the majority of these immune markers in some cancers.
FIGURE 5.
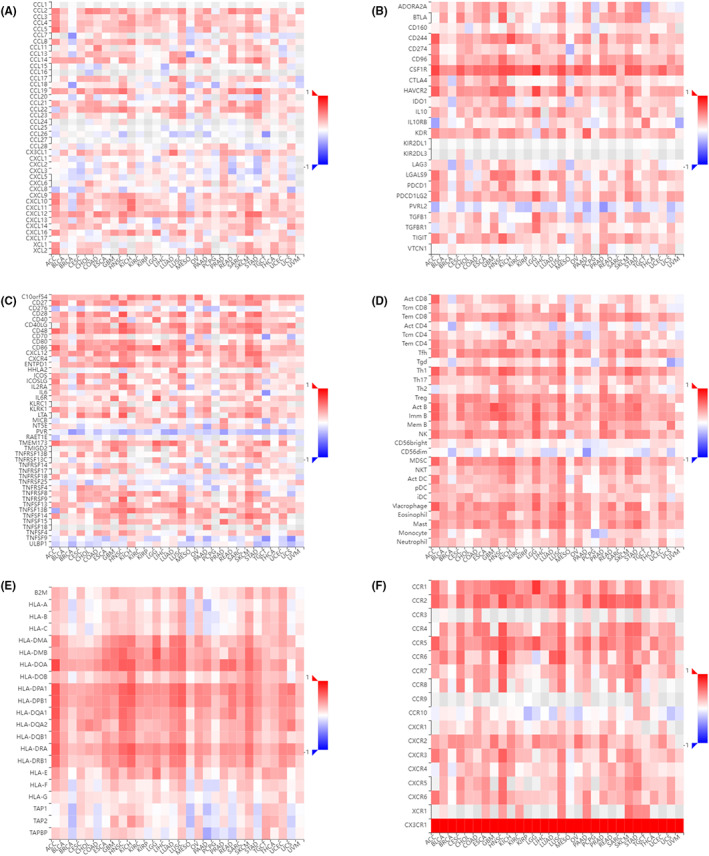
Spearman correlations between CX3CR1 and immune‐related genes across cancers in TISIDB. (A) Spearman correlations between CX3CR1 and chemokines. (B) Spearman correlations between CX3CR1 and immune inhibitors. (C) Spearman correlations between CX3CR1 and immune stimulators. (D) Spearman correlations between CX3CR1 and lymphocytes. (E) Spearman correlations between CX3CR1 and MHC molecules. (F) Spearman correlations between CX3CR1 and chemokine receptors
4. DISCUSSION
In children with AML, survival has improved with the development of individualized precision therapy models. Hyperleukocytosis is a prognostic risk factor for AML in children, and although there are traditional treatments to address the emergency syndrome, it is not enough. With the development of gene sequencing technology and the improvement of various tumour databases, studies have been conducted to analyse the prevalence, clinical manifestations, and prognosis in paediatric AML patients undergoing hyperleukocytosis. 9 This demonstrated that hyperleukocytosis is an independent prognostic factor in children with AML and predicts poor outcome. Nonetheless, no study has explored a prognostic risk model or biomarker for AML in children based on hyperleukocytosis. In this research, we identified and described CX3CR1 as an independent adverse predictor of outcomes in paediatric AML patients who underwent hyperleukocytosis.
CX3CR1 is a proinflammatory leukocyte transmembrane receptor specific to the chemokine CX3CL1 belonging to the G‐protein‐coupled receptor (GPCR) superfamily, which mainly mediates leukocyte migration and adhesion. 17 Herein, we observed that CX3CR1 had strong physical interactions with CX3CL1 by GeneMANIA, which was consistent with literature reports. Chemokines play an important role in some diseases of the body, among which the CX3CL1‐CX3CR1 axis is involved in the pathogenesis of many diseases, such as inflammatory diseases, fibrotic diseases, pain response, cancer development, neurodegenerative diseases, mental and emotional disorders, focal cerebral ischemia, pancreatic diseases, and so on. 18
Cumulative evidence has explored the relationship between CX3CR1 and solid tumours and characterized that the CX3CL1‐CX3CR1 axis drives a variety of tumour‐promoting cell responses. 19 For example, the CX3CL1/CX3CR1 axis facilitates the initiation and progression of pancreatic ductal adenocarcinoma through the JAK/STAT cascade signalling pathway. 20 Another study found that the CX3CL1/CX3CR1 axis promoted the migration of lung cancer cells by activating the Src/FAK signalling pathway. 21 Similarly, a study reported that the CX3CR1 signalling pathway affected the malignant transformation of low‐grade gliomas (LGGs) and promoted vascular proliferation and tumour‐associated microglia/macrophages (TAMs) infiltration. 22 Depending on the type of tumours, the CX3CL1/CX3CR1 axis had favourable or unfavourable effects on tumour patient prognosis. The high expression of CX3CL1, the ligand of CX3CR1, was a marker of better prognosis in colorectal cancer. It was mainly related to the infiltration of T lymphocytes and NK cells, which stimulated a strong immune response, further decreased the metastatic ability of tumour cells, and weakened the damage to target organs. 23 Conversely, high CX3CR1 expression was negatively correlated with OS in pancreatic ductal carcinoma, glioma, and lung cancer patients, and CX3CR1 was proven to be an independent poor prognostic factor. 24 , 25 , 26 Likewise, compared to nodular goitre, CX3CL1 and CX3CR1 were significantly increased in human papillary thyroid carcinoma and could be used as tumour markers. 27
CX3CR1 not only affects the prognosis of tumour patients but also participates in the metastasis and invasion of various cancers. For instance, CX3CR1 drove breast cancer circulating tumour cells to other organs. Antagonizing CX3CR1 significantly hindered the spread of breast cancer cells and enhanced the tumour suppressor effect of docetaxel. 28 Similarly, studies have pointed out that CX3CR1 is involved in bone metastasis of prostate and lung cancer cells. 29 , 30 In human ovarian cancer, HIF‐1α induced CX3CR1 expression and promoted epithelial to mesenchymal transformation of ovarian cancer cells. 31 Given the above, these data suggested that CX3CR1 promoted human cancer initiation and tumour progression. In our study, the CX3CR1high subgroup had more patients with central nervous system leukaemia. We hypothesized that CX3CR1 was involved in extramedullary migration infiltration of paediatric AML and induced the occurrence of the central nervous system in children. At present, there are few studies on CX3CR1 in haematological tumours, mainly focusing on B‐cell malignancies. It has been found that the CX3CL1/CX3CR1 axis is expressed on B‐chronic lymphocytic leukaemia cells and is involved in the interaction between leukaemia cells and the tumour microenvironment. 32 , 33 In addition, high levels of CX3CR1 are expressed in the bone marrow of MM patients and are involved in MM‐induced angiogenesis. 34
To further investigate the function of CX3CR1 in AML, we carried out GSEA of GO terms and KEGG pathways between CX3CR1 and its coexpressed genes in LinkedOmics. As a result, we found that CX3CR1 was closely related to tumour immunity, especially in cytokine receptor activity and the chemokine signalling pathway. Chemokines mainly mediate immune cell chemotaxis and lymphoid tissue development. The chemokine system regulates the number and type of infiltrating lymphocytes, synergistically forms the tumour microenvironment, induces pro‐ and anti‐immunity, and promotes or inhibits tumour growth and proliferation, angiogenesis, and metastasis. 35 Notably, tumour immunotherapy targeting the chemokine system is emerging as a new therapeutic strategy. For example, mogamulizumab, an anti‐CCR4 antibody, is clinically approved for the treatment of relapsed and refractory adult T‐cell leukaemia‐lymphoma. 36
In addition to investigating the role of CX3CR1 in antitumor immunity, we also examined CX3CR1 expression levels on the surface of immune cells by the GEPIA2021 database. We found that monocytes, resting NK cells and CD8 T cells expressed higher levels of CX3CR1. This further confirmed that CX3CL1/CX3CR1 recruits NK cells into the tumour microenvironment and plays a role in the antitumor immune response. 37 Correspondingly, CX3CL1 on the surface of liver cancer target cells stimulated the chemotactic migration and aggregation infiltration of CX3CR1+ NK cells through the STAT3 signalling pathway and enhanced the antitumor effect of immune cells. 38 In peripheral blood samples from NSCLC patients, the CX3CR1 expression level of CD8+ T cells was found to be an early dynamic biomarker of clinical response to ICI treatment. 39 Additionally, we also found that CX3CR1 was connected with the infiltration levels of immune cells and immune‐related signatures by the GSCA and TISIDB databases. CX3CR1 may become a new potential drug target for anticancer immunotherapy. Accordingly, an in‐depth understanding of the role and mechanism of CX3CR1 in childhood AML is crucial for the development of cancer therapeutics and individualized tumour therapy.
Our study had several limitations. The sample data used in the research analysis came from public databases, and there was a lack of prospective experimental design to detect the expression level of CX3CR1 in fresh samples. Although we confirmed that CX3CR1 was an effective independent prognostic factor and was closely related to tumour development and immune function, further analysis and validation experiments are needed to reveal the involvement of the CX3CR1 gene in the development and induction of mortality in paediatric AML with hyperleukocytosis.
5. CONCLUSIONS
In summary, we discovered and validated for the first time the predictive value of CX3CR1 for prognosis in paediatric AML patients with hyperleukocytosis. We also explored the possibility of CX3CR1 as a predictor of immune response using public databases, which may be a surprising finding in immunotherapy for children. Overall, we are looking forward to realizing personalized and precise treatment by optimizing the treatment management of paediatric AML undergoing hyperleukocytosis in the future.
AUTHOR CONTRIBUTIONS
Huaiyu Wang and Nan Mei conceived and designed the research. Hong Su performed the R software analysis. Sha Gong and Hanzhi Du prepared the figures and tables. Xiaojuan Zhang and Lu Wang completed the supplemental materials. Nan Mei wrote the original draft. All authors have read and approved the manuscript.
CONFLICT OF INTEREST
The authors declare that they have no competing interests.
Supporting information
Figure S1 Flowchart of data processing and analysis in the present study.
Figure S2. Volcano plot for differentially expressed genes in the hyperleukocytosis group and non‐hyperleukocytosis group. FC >2 and p < 0.05. Black: nondifferentially expressed genes in groups; red: upregulated differentially expressed genes in the hyperleukocytosis group; green: downregulated differentially expressed genes in the hyperleukocytosis group.
Figure S3. GO enrichment analyses for DEGs. Bar plot and bubble chart of upregulated genes.
Figure S4. GO enrichment analyses for DEGs. Bar plot and bubble chart of downregulated genes.
Figure S5. KEGG pathway enrichment analyses for DEGs. Barplot and bubble chart of upregulated genes.
Figure S6. KEGG pathway enrichment analyses for DEGs. Bar plot and bubble chart of downregulated genes.
Figure S7. Significantly enriched GO annotations and KEGG pathways of CX3CR1 in AML using LinkedOmics. (A) GSEA of GO_BP terms. (B) GSEA of GO_CC terms. (C) GSEA of GO_MF terms. (D) GSEA of KEGG terms.
Table S1 DEGs between the hyperleukocytosis groups and non‐hyperleukocytosis groups, FC >2 and p < 0.05.
Table S2 Upregulated DEGs of the hyperleukocytosis groups.
Table S3 Downregulated DEGs of the hyperleukocytosis groups.
Table S4 GO enrichment analyses for upregulated DEGs.
Table S5 GO enrichment analyses for downregulated DEGs.
Table S6 KEGG pathway enrichment analyses for upregulated DEGs.
Table S7 KEGG pathway enrichment analyses for downregulated DEGs.
Table S8 DEGs were significantly linked with the OS of paediatric AML patients (P < 0.05).
Table S9 Baseline patients characteristics according to CX3CR1 expression (§Fisher's exact test, †x 2 test, *Mann–Whitney test).
Table S10 Univariate analysis of OS in the patients.
Table S11 Multivariate analysis of OS in the patients.
Table S12 All genes linked with CX3CR1 in the AML cohort by LinkedOmics.
ACKNOWLEDGEMENTS
The authors appreciate the databases mentioned in this article for providing open access to the AML datasets. The authors sincerely acknowledge the publicly available datasets, including GEPIA2, UALCAN, cBioPortal, TISIDB, TIMER, GeneMANIA, and GSCA.
Mei N, Su H, Gong S, et al. High CX3CR1 expression predicts poor prognosis in paediatric acute myeloid leukaemia undergoing hyperleukocytosis. Int J Lab Hematol. 2023;45(1):53‐63. doi: 10.1111/ijlh.13963
Funding information Natural Science Foundation of Shaanxi Province, Grant/Award Number: 2020JM‐380
DATA AVAILABILITY STATEMENT
The datasets presented in this study can be found in the TARGET dataset (http://ocg.cancer.gov/), STRING database (http://string.embl.de/), GeneMANIA (http://genemania.org/), LinkedOmics (http://www.linkedomics.org), GEPIA2021 (http://gepia2021.cancer-pku.cn/), GSCA (http://bioinfo.life.hust.edu.cn/GSCA/), and TISIDB (http://cis.hku.hk/TISIDB).
REFERENCES
- 1. Newell LF, Cook RJ. Advances in acute myeloid leukemia. BMJ. 2021;375:n2026. [DOI] [PubMed] [Google Scholar]
- 2. Seth R, Singh A. Leukemias in children. Indian J Pediatr. 2015;82(9):817‐824. [DOI] [PubMed] [Google Scholar]
- 3. Bertuccio SN, Anselmi L, Masetti R, et al. Exploiting clonal evolution to improve the diagnosis and treatment efficacy prediction in pediatric AML. Cancers (Basel). 2021;13(9):1995. [DOI] [PMC free article] [PubMed] [Google Scholar]
- 4. Shallis RM, Stahl M, Bewersdorf JP, Hendrickson JE, Zeidan AM. Leukocytapheresis for patients with acute myeloid leukemia presenting with hyperleukocytosis and leukostasis: a contemporary appraisal of outcomes and benefits. Expert Rev Hematol. 2020;13(5):489‐499. [DOI] [PubMed] [Google Scholar]
- 5. Creutzig U, Rossig C, Dworzak M, et al. Exchange transfusion and leukapheresis in pediatric patients with AML with high risk of early death by bleeding and leukostasis. Pediatr Blood Cancer. 2016;63(4):640‐645. [DOI] [PubMed] [Google Scholar]
- 6. Kuo KH, Callum JL, Panzarella T, et al. A retrospective observational study of leucoreductive strategies to manage patients with acute myeloid leukaemia presenting with hyperleucocytosis. Br J Haematol. 2015;168(3):384‐394. [DOI] [PubMed] [Google Scholar]
- 7. Ganzel C, Becker J, Mintz PD, Lazarus HM, Rowe JM. Hyperleukocytosis, leukostasis and leukapheresis: practice management. Blood Rev. 2012;26(3):117‐122. [DOI] [PubMed] [Google Scholar]
- 8. Zuckerman T, Ganzel C, Tallman MS, Rowe JM. How I treat hematologic emergencies in adults with acute leukemia. Blood. 2012;120(10):1993‐2002. [DOI] [PubMed] [Google Scholar]
- 9. Xu LH, Wang JW, Wang Y, Yang FY. Hyperleukocytosis predicts inferior clinical outcome in pediatric acute myeloid leukemia. Hematology. 2020;25(1):507‐514. [DOI] [PubMed] [Google Scholar]
- 10. Bewersdorf JP, Zeidan AM. Hyperleukocytosis and leukostasis in acute myeloid leukemia: can a better understanding of the underlying molecular pathophysiology lead to novel treatments? Cells‐Basel. 2020;9(10):1995. [DOI] [PMC free article] [PubMed] [Google Scholar]
- 11. Szklarczyk D, Gable AL, Nastou KC, et al. The STRING database in 2021: customizable protein‐protein networks, and functional characterization of user‐uploaded gene/measurement sets. Nucleic Acids res. 2021;49(D1):D605‐D612. [DOI] [PMC free article] [PubMed] [Google Scholar]
- 12. Franz M, Rodriguez H, Lopes C, et al. GeneMANIA update 2018. Nucleic Acids res. 2018;46(W1):W60‐W64. [DOI] [PMC free article] [PubMed] [Google Scholar]
- 13. Vasaikar SV, Straub P, Wang J, Zhang B. LinkedOmics: analyzing multi‐omics data within and across 32 cancer types. Nucleic Acids res. 2018;46(D1):D956‐D963. [DOI] [PMC free article] [PubMed] [Google Scholar]
- 14. Li C, Tang Z, Zhang W, Ye Z, Liu F. GEPIA2021: integrating multiple deconvolution‐based analysis into GEPIA. Nucleic Acids res. 2021;49(W1):W242‐W246. [DOI] [PMC free article] [PubMed] [Google Scholar]
- 15. Liu CJ, Hu FF, Xia MX, Han L, Zhang Q, Guo AY. GSCALite: a web server for gene set cancer analysis. Bioinformatics. 2018;34(21):3771‐3772. [DOI] [PubMed] [Google Scholar]
- 16. Ru B, Wong CN, Tong Y, et al. TISIDB: an integrated repository portal for tumor‐immune system interactions. Bioinformatics. 2019;35(20):4200‐4202. [DOI] [PubMed] [Google Scholar]
- 17. Imai T, Hieshima K, Haskell C, et al. Identification and molecular characterization of fractalkine receptor CX3CR1, which mediates both leukocyte migration and adhesion. Cell. 1997;91(4):521‐530. [DOI] [PubMed] [Google Scholar]
- 18. D'Haese JG, Friess H, Ceyhan GO. Therapeutic potential of the chemokine‐receptor duo fractalkine/CX3CR1: an update. Expert Opin Ther Targets. 2012;16(6):613‐618. [DOI] [PubMed] [Google Scholar]
- 19. Rivas‐Fuentes S, Salgado‐Aguayo A, Arratia‐Quijada J, Gorocica‐Rosete P. Regulation and biological functions of the CX3CL1‐CX3CR1 axis and its relevance in solid cancer: a mini‐review. J Cancer. 2021;12(2):571‐583. [DOI] [PMC free article] [PubMed] [Google Scholar]
- 20. Huang L, Ma B, Ma J, Wang F. Fractalkine/CX3CR1 axis modulated the development of pancreatic ductal adenocarcinoma via JAK/STAT signaling pathway. Biochem Biophys Res Commun. 2017;493(4):1510‐1517. [DOI] [PubMed] [Google Scholar]
- 21. Liu W, Liang Y, Chan Q, Jiang L, Dong J. CX3CL1 promotes lung cancer cell migration and invasion via the Src/focal adhesion kinase signaling pathway. Oncol Rep. 2019;41(3):1911‐1917. [DOI] [PubMed] [Google Scholar]
- 22. Lee S, Latha K, Manyam G, Yang Y, Rao A, Rao G. Role of CX3CR1 signaling in malignant transformation of gliomas. Neuro Oncol. 2020;22(10):1463‐1473. [DOI] [PMC free article] [PubMed] [Google Scholar]
- 23. Vitale S, Cambien B, Karimdjee BF, et al. Tissue‐specific differential antitumour effect of molecular forms of fractalkine in a mouse model of metastatic colon cancer. Gut. 2007;56(3):365‐372. [DOI] [PMC free article] [PubMed] [Google Scholar]
- 24. Xu X, Wang Y, Chen J, et al. High expression of CX3CL1/CX3CR1 axis predicts a poor prognosis of pancreatic ductal adenocarcinoma. J Gastrointest Surg. 2012;16(8):1493‐1498. [DOI] [PubMed] [Google Scholar]
- 25. Erreni M, Solinas G, Brescia P, et al. Human glioblastoma tumours and neural cancer stem cells express the chemokine CX3CL1 and its receptor CX3CR1. Eur J Cancer. 2010;46(18):3383‐3392. [DOI] [PubMed] [Google Scholar]
- 26. Fan T, Liu Y, Liu H, et al. Comprehensive analysis of a chemokine‐ and chemokine receptor family‐based signature for patients with lung adenocarcinoma. Cancer Immunol Immunother. 2021;70(12):3651‐3667. [DOI] [PMC free article] [PubMed] [Google Scholar]
- 27. Wu W, Ren F, Guo M, Yang J, Xiao Y, Liu W. Increased expression of CX3CL1 and CX3CR1 in papillary thyroid carcinoma. Histol Histopathol. 2020;35(10):1189‐1196. [DOI] [PubMed] [Google Scholar]
- 28. Qian C, Worrede‐Mahdi A, Shen F, et al. Impeding circulating tumor cell reseeding decelerates metastatic progression and potentiates chemotherapy. Mol Cancer res. 2018;16(12):1844‐1854. [DOI] [PMC free article] [PubMed] [Google Scholar]
- 29. Liu P, Liang Y, Jiang L, Wang H, Wang S, Dong J. CX3CL1/fractalkine enhances prostate cancer spinal metastasis by activating the Src/FAK pathway. Int J Oncol. 2018;53(4):1544‐1556. [DOI] [PMC free article] [PubMed] [Google Scholar]
- 30. Liu Y, Ma H, Dong T, Yan Y, Sun L, Wang W. Clinical significance of expression level of CX3CL1‐CX3CR1 axis in bone metastasis of lung cancer. Clin Transl Oncol. 2021;23(2):378‐388. [DOI] [PubMed] [Google Scholar]
- 31. Singh SK, Mishra MK, Singh R. Hypoxia‐inducible factor‐1alpha induces CX3CR1 expression and promotes the epithelial to mesenchymal transition (EMT) in ovarian cancer cells. J Ovarian Res. 2019;12(1):42. [DOI] [PMC free article] [PubMed] [Google Scholar]
- 32. Ferretti E, Bertolotto M, Deaglio S, et al. A novel role of the CX3CR1/CX3CL1 system in the cross‐talk between chronic lymphocytic leukemia cells and tumor microenvironment. Leukemia. 2011;25(8):1268‐1277. [DOI] [PubMed] [Google Scholar]
- 33. Ferretti E, Pistoia V, Corcione A. Role of fractalkine/CX3CL1 and its receptor in the pathogenesis of inflammatory and malignant diseases with emphasis on B cell malignancies. Mediators Inflamm. 2014;2014:1‐10. [DOI] [PMC free article] [PubMed] [Google Scholar]
- 34. Marchica V, Toscani D, Corcione A, et al. Bone marrow CX3CL1/fractalkine is a new player of the pro‐angiogenic microenvironment in multiple myeloma patients. Cancers (Basel). 2019;11(3):321. [DOI] [PMC free article] [PubMed] [Google Scholar]
- 35. Bronger H, Magdolen V, Goettig P, Dreyer T. Proteolytic chemokine cleavage as a regulator of lymphocytic infiltration in solid tumors. Cancer Metastasis Rev. 2019;38(3):417‐430. [DOI] [PMC free article] [PubMed] [Google Scholar]
- 36. Fuji S, Utsunomiya A, Inoue Y, et al. Outcomes of patients with relapsed aggressive adult T‐cell leukemia‐lymphoma: clinical effectiveness of anti‐CCR4 antibody and allogeneic hematopoietic stem cell transplantation. Haematologica. 2018;103(5):e211‐e214. [DOI] [PMC free article] [PubMed] [Google Scholar]
- 37. Yao X, Matosevic S. Chemokine networks modulating natural killer cell trafficking to solid tumors. Cytokine Growth Factor Rev. 2021;59:36‐45. [DOI] [PubMed] [Google Scholar]
- 38. Chen EB, Zhou ZJ, Xiao K, et al. The miR‐561‐5p/CX3CL1 signaling axis regulates pulmonary metastasis in hepatocellular carcinoma involving CX3CR1(+) natural killer cells infiltration. Theranostics. 2019;9(16):4779‐4794. [DOI] [PMC free article] [PubMed] [Google Scholar]
- 39. Yamauchi T, Hoki T, Oba T, et al. T‐cell CX3CR1 expression as a dynamic blood‐based biomarker of response to immune checkpoint inhibitors. Nat Commun. 2021;12(1):1402. [DOI] [PMC free article] [PubMed] [Google Scholar]
Associated Data
This section collects any data citations, data availability statements, or supplementary materials included in this article.
Supplementary Materials
Figure S1 Flowchart of data processing and analysis in the present study.
Figure S2. Volcano plot for differentially expressed genes in the hyperleukocytosis group and non‐hyperleukocytosis group. FC >2 and p < 0.05. Black: nondifferentially expressed genes in groups; red: upregulated differentially expressed genes in the hyperleukocytosis group; green: downregulated differentially expressed genes in the hyperleukocytosis group.
Figure S3. GO enrichment analyses for DEGs. Bar plot and bubble chart of upregulated genes.
Figure S4. GO enrichment analyses for DEGs. Bar plot and bubble chart of downregulated genes.
Figure S5. KEGG pathway enrichment analyses for DEGs. Barplot and bubble chart of upregulated genes.
Figure S6. KEGG pathway enrichment analyses for DEGs. Bar plot and bubble chart of downregulated genes.
Figure S7. Significantly enriched GO annotations and KEGG pathways of CX3CR1 in AML using LinkedOmics. (A) GSEA of GO_BP terms. (B) GSEA of GO_CC terms. (C) GSEA of GO_MF terms. (D) GSEA of KEGG terms.
Table S1 DEGs between the hyperleukocytosis groups and non‐hyperleukocytosis groups, FC >2 and p < 0.05.
Table S2 Upregulated DEGs of the hyperleukocytosis groups.
Table S3 Downregulated DEGs of the hyperleukocytosis groups.
Table S4 GO enrichment analyses for upregulated DEGs.
Table S5 GO enrichment analyses for downregulated DEGs.
Table S6 KEGG pathway enrichment analyses for upregulated DEGs.
Table S7 KEGG pathway enrichment analyses for downregulated DEGs.
Table S8 DEGs were significantly linked with the OS of paediatric AML patients (P < 0.05).
Table S9 Baseline patients characteristics according to CX3CR1 expression (§Fisher's exact test, †x 2 test, *Mann–Whitney test).
Table S10 Univariate analysis of OS in the patients.
Table S11 Multivariate analysis of OS in the patients.
Table S12 All genes linked with CX3CR1 in the AML cohort by LinkedOmics.
Data Availability Statement
The datasets presented in this study can be found in the TARGET dataset (http://ocg.cancer.gov/), STRING database (http://string.embl.de/), GeneMANIA (http://genemania.org/), LinkedOmics (http://www.linkedomics.org), GEPIA2021 (http://gepia2021.cancer-pku.cn/), GSCA (http://bioinfo.life.hust.edu.cn/GSCA/), and TISIDB (http://cis.hku.hk/TISIDB).