

Abstract
Background
Allergen exposure chamber (AEC) is a clinical facility that allows exposure to allergenic airborne particles in controlled environment. Although AECs offer stable levels of airborne allergens, the validation of symptoms and other endpoints induced by allergen challenge is key for their recommendation as a plausible tool for the assessment of patients, especially in clinical research. This study aimed to demonstrate the reproducibility of defined clinical endpoints after AEC house dust mite (HDM) challenge under optimal conditions in patients with allergic rhinitis (AR).
Method
HDM was distributed at different concentrations. The assessment was subjective by the patients: total nasal symptom score (TNSS), visual analog scale (VAS), and objective by the investigator: acoustic rhinometry, peak nasal inspiratory flow (PNIF), and nasal secretion weight. Safety was assessed clinically and by peak expiratory flow rate (PEFR) and forced expiratory volume in the first second (FEV1).
Results
Constant environment: temperature, humidity, and carbon dioxide (CO2) concentration were maintained during all challenges. The concentration of HDM on average remained stable within the targeted values: 1000, 3000, 5000, 7000 particles (p)/m3. Most symptoms were observed at concentrations 3000 p/m3 or higher. The symptoms severity and other endpoints results were reproducible. 5000 p/m3, and challenge duration of 120 min were found optimal. The procedure was safe with no lung function abnormalities due to challenge.
Conclusion
HDM challenge in ALL‐MED AEC offers a safe and reliable method for inducing symptoms in AR patients for the use in controlled clinical studies including allergen immunotherapy.
Keywords: acoustic rhinometry, allergen challenge, allergen exposure chamber, allergic rhinitis, house dust mite
AR patients triggered by HDM were challenged in an AEC. The symptom severity (TNSS, VAS) and objective parameters (acoustic rhinometry and PNIF) were reproducible and correlated with HDM particle concentration. AEC challenge is a useful tool for evaluation of HDM allergic rhinitis and possible patient stratification for clinical research.Abbreviations: AEC, allergen exposure chamber; AR, allergic rhinitis; ARM, acoustic rhinometry; FEV1, forced expiratory volume in the first second; HC, healthy control; HDM, house dust mite; p/m3, particles/cubic meter; MCA, minimal cross‐sectional area; PEFR, peak expiratory flow rate; PNIF, peak nasal inspiratory flow; TNSS, total nasal symptom score; VAS, visual analogue scale

Abbreviations
- ACH
air change per hour
- AEC(s)
allergen exposure chamber(s)
- AIT
allergen immunotherapy
- AR
allergic rhinitis
- CO2
carbon dioxide
- COVID‐19
coronavirus disease 2019
- Df
Dermatophagoides farinae
- Dp
Dermatophagoides pteronyssinus
- EAACI
European Academy of Allergy and Clinical Immunology
- EEC
environmental exposure chamber
- EEU
environmental exposure unit
- EMA
European Medicines Agency
- ERS
European Respiratory Society
- F
female
- FEV1
forced expiratory volume in first second
- g
gram
- HEPA
high efficiency particulate air
- HMD
house dust mite
- kDa
kilodalton
- kU/L
kilo units/liter
- LPC
laser particle counter
- M
male
- m
meter
- MCA
minimal cross‐sectional area
- md
wheal mean diameter
- p
particle(s)
- p/m3
particles/cubic meter
- PEF
peak flow matter
- PEFR
peak expiratory flow rate
- PNIF
peak nasal inspiratory flow
- SABA
short‐acting beta agonists
- SARS‐CoV‐2
severe acute respiratory syndrome coronavirus 2
- sIgE
specific immunoglobulin E
- SOP
standard operating procedures
- SPT
skin prick test
- SQE
standard quality unit
- VAS
visual analogue scale
- VOC
volatile organic compounds
- vs.
versus
1. INTRODUCTION
Allergen exposure chambers (AECs) allow controlled exposure to allergenic and non‐allergenic airborne particles in a confined environment. They provide stability of particle concentration and the environment including temperature, humidity, and carbon dioxide (CO2) concentration aiming at the reproducibility of symptom induction. 1 AECs have been developed for controlled challenges ideally mimicking natural exposure in the field. 2 , 3 AECs allow the investigation of pathological features of respiratory diseases and aid the development of pharmacological treatments and/or allergen immunotherapy (AIT) in the treatment of respiratory allergy. 4 , 5 , 6 , 7 There is a limited number of such facilities worldwide, which differ in size, particle generation, and particle counting manner. Of note, despite the rapid development of AEC, international standards have not been established to validate such objects. The European Academy of Allergy and Clinical Immunology (EAACI) recommends standardization of technical parameters, definition and validation of clinical and statistical parameters, and reproducible dose–response in clinical symptoms. 8 , 9
House dust mite (HDM) allergy is a risk factor for allergic rhinitis (AR), allergic conjunctivitis (AC), allergic rhinoconjunctivitis, and asthma. 10 , 11 , 12 , 13 The data on the prevalence of HDM‐allergen sensitization range from 65 to 130 million people in the general population worldwide. 14 The variation of airborne allergens concentrations often hampers allergy diagnosis or efficacy testing of immunotherapy in field studies. Standardized allergen exposure in AEC settings may provide a plausible alternative.
HDM is the common allergen source, consisting of a group of mite species found almost everywhere where humans live. This group includes Dermatophagoides pteronyssinus (Dp) and D. farinae (Df) species. They have been identified about 30 allergenic mite proteins in mite extracts. The most important is the fecal group 1 allergen (Der p 1, Der f 1) which are about 25 kilodaltons (kDa), and group 2 allergens (Der p 2, Der f 2) originating from the mite bodies, of about 14 kDa. 15 Both of the groups are present in all house dust‐mite species. 3 , 16 The global distribution of mites and year‐round contact with a tendency to seasonality during the heating season makes HDM one of the main causes of respiratory allergy. 17 , 18 , 19 The exposure to HDMs in the indoor environment is difficult to assess.
The study aimed to validate and test the efficacy and safety of challenges with HDM in the ALL‐MED AEC facility in patients with HDM‐triggered‐allergic rhinitis. The purpose of the study was (1) to determine the clinical validity of HDM delivery at various particle numbers and their impact on symptom scoring, (2) to determine the optimal amount of HDM particles (p)/m3 triggering significant allergic symptoms corresponding to natural exposure, and (3) to demonstrate the reproducibility of results under stable environmental conditions. Different particle numbers 1000, 3000, 5000, and 7000/m3 of distributed HDM were used to assess differences in total nasal symptom score (TNSS), acoustic rhinometry, peak nasal inspiratory flow (PNIF), and nasal secretion weight. Safety was assessed by lung parameters: peak expiratory flow rate (PEFR) forced expiratory volume in the first second (FEV1).
2. MATERIALS AND METHODS
2.1. AEC
2.1.1. Structure
The AEC is located in ALL‐MED Medical Research Institute, Wroclaw, Poland. The facility consists of one room with an area of 12 m3 and a height of 3.5 m. The entrance airlock minimizes the loss of particles from the chamber and the entry of unwanted particles from the outside environment. It has been designed to accommodate 15 participants (maximum: 20) comfortably. The furniture (seats) is movable, which facilitates cleaning and allows for a non‐standard configuration (Figure 1).
FIGURE 1.
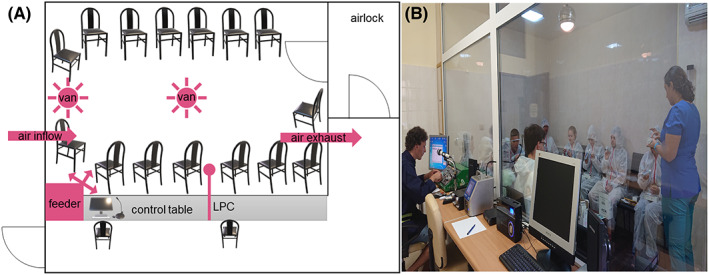
Structure of AEC. (A) Schematic AEC layout. Capacity 15–20 people. The circulation and direction of air and distributed particles are shown in pink. In the front viewing window, and control table with a computer‐controlled feeder, LPC, and a microphone for communication. (B) Photograph of AEC with subjects during the trial. Abbreviation: AEC, allergen exposure chamber; LPC, laser particle counter.
The AEC equipment is made of non‐adherent, easily washable surfaces, such as plastic, eco‐leather, or metal. After each experimental run, the facility is thoroughly cleaned according to the standard operating procedures (SOP), including blowing the allergen supply duct, cleaning all washable surfaces, and vacuuming the cabin with high‐efficiency particulate air (HEPA) filtered vacuumer. After every cleaning of the AEC, the contamination with allergens is checked, by an engineer that operates the AEC, accordingly to the procedure explained in point 2.1.2.
There are two additional rooms, next to the AEC, where participants are tested before entering the chamber (“0 min” measurements), also, for example, blood can be collected for further in vitro tests. Study subjects wear disposable coveralls with hoods to protect against the ingress of non‐allergen particles and potential contamination of clothes and scalps. Viewing windows enables the subjects to be monitored from the control room during challenges. During studies, staff members go inside and help patients perform tests such as rhinometry or spirometry. Throughout the course of the study, there is constant communication with participants through a microphone wireless system.
2.1.2. Environment, generation, and counting of particles
The computer‐controlled AEC air system is adjustable; the temperature can be set from 18 to 27°C (typical temperature: 21°C ± 0.5°C). In addition, relative humidity (typically 40%–58%) and CO2 concentration are monitored. An air change per hour (ACH) is between 5 and 20. Fresh outside air is drawn in through HEPA filters. The incoming air is constantly mixed under turbulent conditions by the floor and ceiling swirl fans.
A computer‐controlled feeder delivers particles that are injected into air supply channels and blown into the AEC. Standardized, lyophilized commercially available extracts of allergens are used. The particles' concentration can reach values between 500 and 10,000/m3. In order to obtain a homogeneous, spatially stable distribution of the particles, they are being mixed turbulently, so they recirculate rather than accumulate on the floor. No contamination with allergens, volatile organic compounds (VOC), or endotoxins was found in the AEC.
The particle count and particle size are being monitored continuously during the experiment using laser particle counter (LPC), SOLAIR Boulder Counter (Lighthouse Worldwide Solutions). The particle concentration is being counted every minute during the challenge, and the results are given in p/m3. The particle sizes that can be monitored are in the range between 5–100 μm. The particles were classified into ranges: 0–20, 20–50, 50–100 μm.
All data from each trial are archived on the computer and an external drive.
2.1.3. Staff
An engineer monitors the experimental conditions, and two health care workers, at least one physician, who help participants to perform studies and care for their safety. With regard to safety, the emergency equipment consists of a defibrillator and other resuscitation equipment in place.
2.2. HDM allergen
Dried, purified Dp mite bodies were obtained from Allergopharma, customized order. It was stored at 4°C until use. The allergen from HDM only becomes airborne during air disturbance and falls rapidly. Therefore, the turbulent air mixing in AEC is an essential requirement.
2.3. Study
2.3.1. Subjects
The study was conducted with the consent of the Bioethics Committee at the Medical University of Wroclaw, with the number 767/2019 dated 18‐11‐2019. All participants had full legal capacity and signed written informed consent to participate in the study. Furthermore, each participant was informed that he/she has the right to withdraw without giving any reason at any time during the study.
Two groups were enrolled in the study, subjects allergic to HDM with AR symptoms (group A), and non‐allergic healthy subjects (group B). Group A consisted of 17 participants characterized in Table 1, and group B consisted of 10, age‐(range 28–55) and sex‐matched (6 males (M)/4 females (F)). The inclusion and exclusion criteria can be found in the Supplementary Material.
TABLE 1.
Characteristics of group A, subjects allergic to HDM enrolled in the study
| Subject number | Age | Sex | Diagnosed asthma | SPT to Dp [mm] | sIgE Dp [kU/l] | sIgE Dp [class] | SPT to Df [mm] | sIgE Df [kU/l] | sIgE Df [class] |
|---|---|---|---|---|---|---|---|---|---|
| 1 | 33 | M | no | 7.5 | 21.0 | 4 | 5.0 | 13.0 | 3 |
| 2 | 25 | F | yes | 5.0 | 0.38 | 1 | 5.0 | 2.1 | 2 |
| 3 | 29 | M | no | 5.0 | 5.4 | 3 | 5.0 | 13.0 | 3 |
| 4 | 20 | F | yes | 6.0 | 2.3 | 2 | 6.0 | 6.5 | 3 |
| 5 | 37 | M | no | 5.5 | 0.36 | 1 | 5.5 | 1.5 | 2 |
| 6 | 29 | M | no | 9.0 | 4.6 | 3 | 11.0 | 48.0 | 4 |
| 7 | 26 | M | yes | 6.0 | 7.4 | 3 | 6.0 | 35.0 | 4 |
| 8 | 35 | M | no | 8.5 | 13.0 | 3 | 4.5 | 13.0 | 3 |
| 9 | 56 | M | no | 9.0 | 4.5 | 3 | 13.0 | 22.0 | 4 |
| 10 | 37 | F | no | 4.5 | 0.82 | 2 | 6.0 | 9.0 | 3 |
| 11 | 24 | M | no | 7.5 | 0.69 | 1 | 7.5 | 18.0 | 4 |
| 12 | 43 | M | no | 8.5 | 0.71 | 1 | 8.0 | 21.0 | 4 |
| 13 | 31 | F | no | 9.0 | 6.2 | 3 | 6,0 | 5,6 | 3 |
| 14 | 23 | F | no | 15.0 | >100 | 6 | 9.0 | >100 | 6 |
| 15 | 24 | F | yes | 7.0 | 3.4 | 2 | 6.0 | 11.0 | 3 |
| 16 | 25 | M | no | 6.0 | 3.9 | 3 | 6.0 | 16.0 | 3 |
| 17 | 24 | M | yes | 7.5 | 2.7 | 2 | 7.5 | 22.0 | 4 |
| Range | 20–56 | 10M/7F | 5 yes/12 no | 5.0–15.0 | 0.36 ‐ > 100 | 1–6 | 4.5–13.0 | 1.5 ‐ > 100 | 2–6 |
Note: Patients with AR symptoms, with a positive SPT to Dp and/or Df (the wheal md ≥3 mm), the concentration of sIgE against Dp and/or Df in the blood serum was >1.5 kU/L, and possible mild asthma.
Abbreviations: AR, allergic rhinitis; Df, Dermatophagoides farinae; Dp, Dermatophagoides pteronyssinus; F, female; HDM, house dust mite; kU/L, kilo units/liter; M, male; md, mean diameter; sIgE, specific immunoglobulin E; SPT, skin prick test.
2.3.2. Severe acute respiratory syndrome coronavirus 2 (SARS‐CoV‐2) testing
During the coronavirus disease 2019 (COVID‐19) pandemic, each subject was PCR tested for SARS‐CoV‐2 virus 24–36 h before entering the AEC. Only a negative result allowed access to the AEC.
2.3.3. Clinical endpoints
Nasal symptoms survey (subjective assessment)
Nasal symptoms were scored based on TNSS. Also, a visual analogue scale (VAS) was used, with the same parameters as in TNSS, symptoms, and score method are listed in Table 2. Subjects were self‐assessing before, and every 30 min of the challenge. In addition, 4 and 24 h after the exposure at home.
TABLE 2.
Symptoms and score method for TNSS and VAS
| Symptom | TNSS score for each symptom | VAS score for each symptom |
|---|---|---|
| Rhinorrhea | 0 = none (symptom completely absent) | the severity of each symptom was tagged on a vertical line between 0–100 mm (0 ‐ none, 100 ‐ the maximum intensity) |
| Nasal obstruction | 1 = mild (symptom present, but not distressing) | |
| Sneezing | 2 = moderate (symptom distressing, but tolerable) | |
| Nasal itching | 3 = severe (symptom hard tolerable, maximum intensity) | |
| 0–12 points total | 0–400 mm total |
Note: Participants used a rating system to score 4 symptoms in TNSS and VAS, which were then presented as total score/or total mm.
Abbreviations: mm, millimeter; TNSS, total nasal symptom score; VAS, visual analogue scale.
Acoustic rhinometry (objective parameter)
Acoustic rhinometry was performed by staff, before, and after 60, 120, and 150 min of the challenge, with an A1 clinical/research grade acoustic rhinometer (GM Instruments). The minimal cross‐sectional area (MCA) was calculated for further analysis.
PNIF (objective parameter)
Subjects measured PNIF using a portable inspiratory flow meter (Clement Clarke International Ltd.) before, after 60, 120, and 150 min of the trial.
Nasal secretion (objective parameter)
Each subject received a pack of handkerchiefs and a biohazard plastic bag before entering the AEC. The packages of handkerchiefs and plastic bags were identical during the whole study, so that the weight could be compared. If needed, another pack of tissue and a plastic bag was delivered. Each subject, during 150 min trial, collected used handkerchiefs in a plastic bag, and after the trial, all the unused handkerchiefs were also inserted. The weight of nasal secretion was determined by weighing used and unused handkerchiefs with plastic bags. The background, unused pack of handkerchiefs, and plastic bag, were subtracted from each measurement.
PEFR (safety lung parameter)
The participants performed PEFR with a peak flow matter (PEF) with a standard range of 60–900 L/min (MicroPeak, CareFusion) before, after 60, 120, and 150 min of the trial. Additionally, the patients leaving the Institute received PEF in order to self‐test at home 4 and 24 h after exposure.
Spirometry (safety lung parameter)
The FEV1 were assessed according to the European Respiratory Society (ERS) 20 standards before, after 60, 120, and 150 min of the trial with a spirometer (EasyOne, Medizintechnik AG, Zurich, Switzerland) to assess the safety and monitor possible bronchial obstruction.
Safety measurements at home
The participants rated a number of safety parameters at home after 4 and 24 h: PEFR and TNSS. A safety follow‐up call was made 24 h after the challenge in AEC.
2.4. Statistical analysis
The groups were compared using the ANOVA and Wilks Lambda tests. Pairs were compared with the Mann–Whitney test. Spearman's rank‐order test was used to measure the strength and direction of an association between two ranked variables. Values were considered significant for all tests with p < .05. Statistics were calculated, and graphs were drawn in GraphPad Prism software.
3. RESULTS
3.1. Technical parameters
Preliminary data show that the level of particles (in every range) in empty AEC and before HDM distribution was less than 50 particles/m3. However, after the HDM dispersion (in an empty chamber), the level of particles raised in the range of 0–20 μm. Therefore, this range was used as a target and shown in the results. Also, there was an influx of particles originating from the volunteers entering the chamber, about 100 particles/m3 for 15 subjects compared with empty AEC. There was no significant impact of entrances of staff members into the AEC. Thus, the values measured by the LPC counter during the studies consisted of the target concentration plus about 100 p/m3.
The course of 210 min AEC operating time during each trial was carefully evaluated to test the temporal stability of the allergen concentration, temperature, humidity, and CO2 concentration (Figure 2). All target concentrations of HDM (0, 1000, 3000, 5000, 6000, and 7000 p/m3) revealed little variation, as shown in Figure 2, indicating good allergen stability. The concentration of HDM 5000 p/m3 is shown twice, from two trials, to show reproducibility. CO2 concentration, temperature, and humidity were measured during every trial with a comparable course. One representative exposure of each is shown.
FIGURE 2.
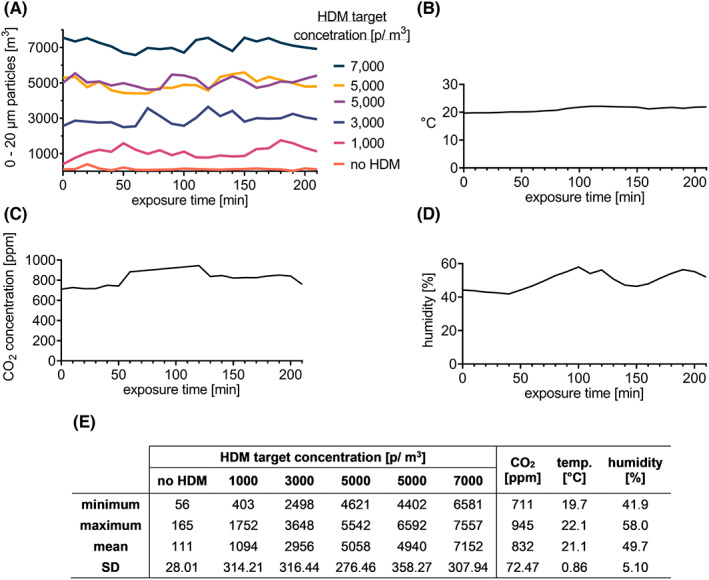
Environmental stability during HDM AEC challenges. (A) HDM particle concentration was measured by LPC in the range of 0–20 μm/m3. Each value measured by the LPC counter during the studies consists of the target concentration plus about 100 p/m3 (particle influx by subjects). The concentration of HDM 5000 p/m3 is shown twice to demonstrate reproducibility, data from two trials. (B) One representative data of CO2 concentration, (C) temperature, and (D) humidity are shown. (E) The minimal and maximal values, mean ± SD of HDM concentrations during different trials. Abbreviations: °C, degrees Celsius; CO2, carbon dioxide; HDM, house dust mite; LPC, laser particle counter; m, meter; min, minute(s); p, particles; ppm, parts per million; SE, standard deviation; temp., temperature.
3.2. Study
Subjects entered AEC one at a time after taking “0 min” measurements of acoustic rhinometry, PEFR, PNIF, spirometry, and answering the survey questions TNSS and VAS (outside the AEC). Consequently, the measurements after 30, 60, 90, 120, and 150 min were in a different real‐time for each subject; thus, each patient spent 150 min inside. In addition, the time shift allowed staff members to assist patients with the testing. Still, the total AEC operating time was 210 min.
3.2.1. Clinical endpoints during different HDM‐allergen doses
There were six trials in the AEC. HDM concentrations used were: 0, 1000, 3000, 5000, and 7000 p/m3. Subjects from group A were tested five times at intervals of at least 7 days. The control group was tested only once with 5000 p/m3 of HDM. The study was single‐blinded—the participants did not know whether they were exposed to the clean air (no HDM particles) or allergen or which the concentration of allergen they were exposed to at a time.
Both TNSS and VAS were statistically higher when group A subjects were exposed to HDM compared with clean air (p < .001) or when compared with symptoms occurring in the control group exposed to 5000 p/m3 (p < .0001) (Figure 3A,B). The TNSS reached the peak values already after 60 min of exposure and then remained plateau, while the VAS reached at least 79% of the maximum value at that time. The statistical elevation in TNSS at 60 min was obtained at concentrations of 5000 and 7000 p/m3 compared with 1000 p/m3 (p < .05), and then until the end of the trial. While statistically significant increase in VAS at 60 min was observed comparing just 7000–1000 p/m3 (p < .05), and after 120 min also at a concentration of 5000 p/m3. Safety TNSS measurements after 4 and 24 h at home showed returned to baseline ±13% (data not shown).
FIGURE 3.
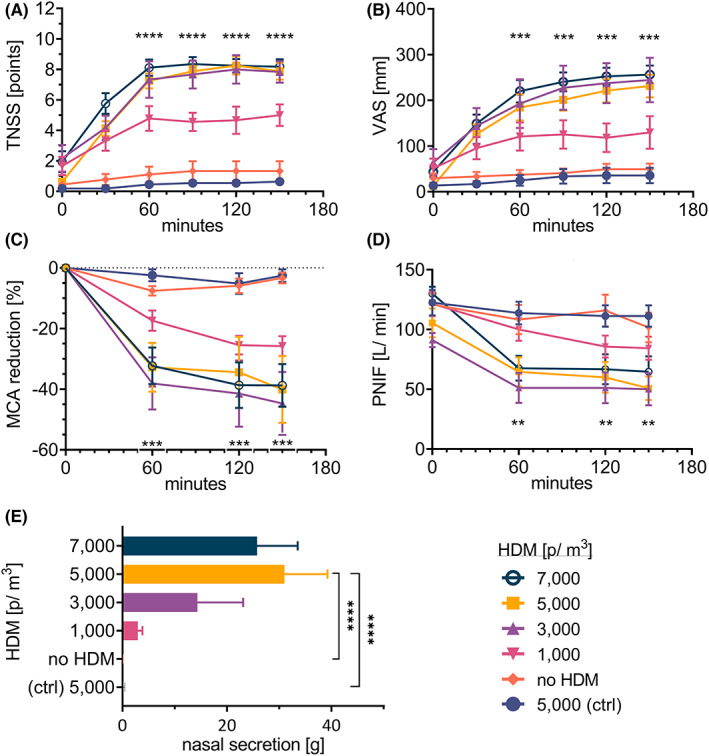
Endpoints during AEC challenges in HDM‐allergic and non‐allergic subjects (ctrl), at different HDM concentrations. HMD triggered‐allergy subjects were exposed to different concentrations of HDM distributed in AEC during five trials: no HDM, 1000, 3000, 5000, 7000 p/m3. Non‐allergic subjects were exposed to 5000 p/m3 of HDM. (A) TNSS, (B) VAS, (C) MCA in acoustic rhinometry, (D) PNIF, and (E) nasal secretion weight were evaluated. The results are shown as mean ± SEM. Statistical significance between concentration 5000 p/m3 (as the optimal chosen concentrations) and “no HDM” and the “ctrl” group is shown; **p < .01; ***p < .001, ****p < .0001. Abbreviations: AEC, allergen exposure chamber; HDM, house dust mite; g, gram(s); MCA, minimal cross‐sectional area; p, particles; PNIF, peak nasal inspiratory flow; SEM, standard error of the mean; TNSS, total nasal symptom score; VAS, visual analog scale.
In acoustic rhinometry, a reduction of MCA was measured. The airway patency decreased significantly already after the first measurement, in 60 min in 3000 p/m3 of HDM challenge, and higher concentrations compared with the clean air (p < .05), and also comparing the control group (p < .01). After 60 min until the end of the trial, the values remain stable. This is in line with PNIF measurement when the reduction was observed at the same concentrations versus (vs.) clean air and control (p < .05), (Figure 3C,D).
The nasal secretion significantly increased when group A subjects were exposed to HDM allergen in all concentrations (5000 and 7000 ‐ p < .0001, 3000, and 1000 ‐ p < .05); and also, in comparison with to the control group (5000 and 7000 ‐ p < 0.0001, 3000, and 1000 ‐ p < .05) (Figure 3E). Statistical significance difference was found between group A exposed to 5000 and 7000 vs. 1000 p/m3 (p < .01).
In each trial, the safety lung parameters, FEV1 and PEFR, were performed. Values were within the norm and stable during the AEC and up to 24 h after the exposition. No statistical differences in the values between exposure to the allergen or clean air, and no differences between group A and control were observed (data not shown). These data suggest that the HDM exposure had no effects on lung function, neither group A nor control subjects.
Statistically significant correlations (p < .05) were shown between HDM concentration and symptom severity (TNSS, VAS) and objective parameters (MCA, PNIF, nasal secretion), figure 5 in the Supplementary Material.
Both TNSS and VAS clearly showed the highest symptom intensity at concentration of 3000 p/m3, and higher. Also, the greatest reductions in MCA and PNIF were observed at the same concentrations. On the other hand, there is no statistical difference in parameter severity between these concentrations. However, the highest weight of nasal secretion was measured at 5000 and 7000 p/m3. For this reason, the concentration of 5000 p/m3 was chosen as optimal for future experiments. In addition, we found that the maximum severity of subjective and objective parameters occurs as early as after 60 min in the AEC when the plateau phase is reached. Therefore, we find the trial duration of 120 min as sufficient for a HDM challenge.
3.2.2. Reproducibility
Subjects from group A were again exposed twice to a concentration of 5000 p/m3 of HDM to find if the induction of parameters during different trials shows good reproducibility. Figure 4 shows that all endpoints, including TNSS, VAS, MCA, PNIF, or nasal secretions, are repetitive in separate challenges—no statistical differences between groups were found.
FIGURE 4.
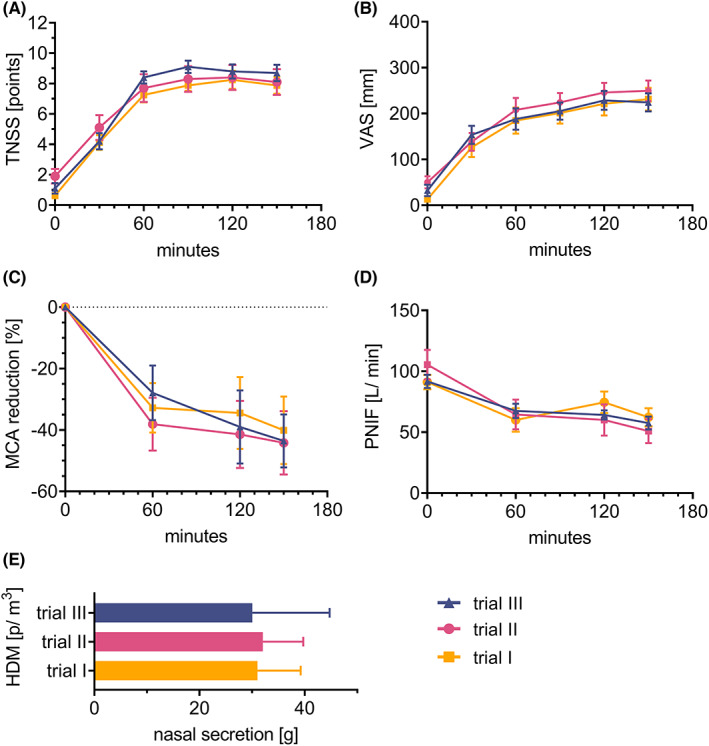
Repeatability of subjective and objective parameters in separate trials in HDM‐allergic subjects during AEC challenges with 5000 p/m 3 of HDM. (A) TNSS, (B) VAS, (C) MCA in acoustic rhinometry, (D) PNIF, and (E) nasal secretion weight were evaluated. Results are shown as mean ± SEM. No statistical differences between groups were found. Abbreviations: AEC, allergen exposure chamber; HDM, house dust mite; g, gram(s); MCA, minimal cross‐sectional area; p, particles; PNIF, peak nasal inspiratory flow; SEM, standard error of the mean; TNSS, total nasal symptom score; VAS, visual analog scale.
4. DISCUSSION
AECs cannot be classified as medical devices (according to the Medical Device Directive 93/42/EEC) or medicinal products (according to Directive 2001/83/EC). AECs are considered a valuable tool for the assessment of primary end‐points for dose‐finding studies according to the European Medicines Agency (EMA) guidelines for the clinical development of products for AIT. 21 However, before AECs could be used in Phase III trials, they need to be validated and compared with clinical symptoms caused by natural exposure. 22 Also, AECs might be a helpful instrument in long‐term studies when natural exposure cannot be evaluated due to low allergen counts. 1
According to the EAACI Task Force Report, 8 there is over a dozen AEC worldwide. Various allergens have been tested, and the most common are; grass pollen, ragweed pollen, birch pollen, HDM, or Japanese cedar pollen. 23 , 24 , 25 , 26 , 27 , 28 Validation of controlled exposure to HMD‐allergen was performed at: Vienna Challenge Chamber VCC2 and VCC3 (Vienna, Austria), 29 HDM‐environmental exposure unit (EEU) in Kingston Health Sciences Centre‐KGH (Kingston, ON, Canada), 30 Fraunhofer allergen challenge chamber (Hannover, Germany), 31 Biogenics Research Chamber (San Antonio, TX, USA), 32 and environmental exposure chamber (EEC) ALYATEC (Strasbourg, France). 33 However, these AECs vary in terms of the HDM material source, delivery system, measurements of the distributed particles, and exposure time, making the study comparison very difficult.
HDM were used in all of the above studies, but with differences in the material source: Der p 1 and Der f 1, Dp fecal material containing mainly Der p1 with a predetermined ratio of 20:1 of Der p 1 to Der p 2, HDM allergen SQ 503 from body and facies containing Der p 1 and Der p 2, Dp extracts. In our study dried, purified Dp mite bodies, which included Der p 1 and Der p 2 were used.
The allergen exposure in AECs was differently assessed. PLC was used in three studies, but the concentration was expressed as p/m3 (this study), p/timepoint, or as a standard quality unit (SQE)/m3. In other facilities, allergen amount was measured by ELISA, cassette sampler for microscopic evaluation, or intra‐assay variability of particle MMAD.
Trial duration also varies, between 150 min up to 8 h. In most of the assessed symptoms in the other HDM AEC validation studies reach the plateau phase between 60 and 90 min. For TNSS regardless of the allergen source or most concentrations the plateau is reached between 60–120 min. 29 , 31 In the study of Hohlfeld et al., 2 the targeted mean TNSS of at least six score points was reached, and a further increase in allergen concentration did not lead to additional symptom increase. One study used two different concentrations of HDM, and TNSS reached stable levels after 90 min with the TNSS value around 6 points. However, at a higher dose of allergen, the mean TNSS score was elevated by two points. 30 This also coincides with our results, where TNSS reached a mean stable value of 6–7 points after 60 min at 3000 p/m3, and higher doses. At the level of 1000 p/m3, an average of 4–5 points in TNSS were achieved, indicating that the HDM concentration was too low. Similar results were observed using VAS scale; however, the plateau phase was reached after 90 min. Thus, the VAS scale is a plausible tool for symptom evaluation. Our data and the results of the other groups show that the duration of the AEC challenge with HDM of 120 min is sufficient.
To support the subjective results obtained by TNSS and VAS, the number of objective parameters including acoustic rhinometry (MCA), PNIF, and nasal secretion were measured as secondary outcome endpoints. Challenge with HDM significantly reduced MCA, nasal flow, and significantly increased nasal secretion. The results were highly reproducible. Similar to TNSS, a plateau phase was reached after 60 min at concentrations of 3000 p/m3 of HDM, and higher. However, the reduction of MCA is more pronounced than that of PNIF. To the best of our knowledge, this is the first AEC validation study where acoustic rhinometry was used. We postulate that due to the easiness, high repeatability of results, and good correlation with TNSS, this is a suitable endpoint in AEC challenge.
To assure safety of the challenge as a priority, PEFR and FEV1 were measured during the challenge. In addition, participants performed PEFR, and TNSS measurements during 24‐h follow‐up at home. The patients were contacted by a phone call 24 h after the challenge in AEC. The literature indicates that not all operators routinely perform such remote follow‐up. 28 , 32
AECs show a major advantage over classical “in‐field” endpoint measurements and speed up the clinical research in the field of allergy as one of the keys focuses over the last years. AEC challenges provide a valuable method for patient stratification in clinical research, especially AIT. The correlation between various clinical endpoints, especially the comparison of objective measurements (acoustic rhinometry, PNIF, nasal secretion) obtained by the investigator and subjective parameters assessed by the patients (TNSS, VAS), is of particular interest as the first step to validate the AEC against the “in‐field”—obtained results. This is crucial for applying this method in phase 3 clinical trials.
5. CONCLUSION
We demonstrated that under stable and constant temperature, humidity, and CO2 concentration during all challenge trials the concentration of HDM on average remained stable within the targeted values in ALL‐MED AEC. The concentration of 5000 p/m3 and the trial duration of 120 min was chosen as optimal. We showed the clinical validity of AEC HDM challenge by its impact on symptom scoring. AEC HDM challenge is an effective, reproducible, and safe method for the assessment of HDM‐allergic rhinitis. It also provides a plausible tool for triggering of allergic symptoms under controlled conditions, which might serve as end‐points in clinical studies, especially in AIT.
AUTHOR CONTRIBUTIONS
Conceptualization, MZ‐W, AK, MJ; methodology, MZ‐W, AK, ES; formal analysis, MZ‐W, AK, EW, ES; investigation, MZ‐W, AK, EW; resources, MZ‐W, AK, MJ; data curation, MZ‐W; writing ‐ original draft preparation, MZ‐W, AK; writing ‐ review and editing, MJ; visualization, MZ‐W, AK; supervision, MJ; project administration, MZ‐W, EW, AK, ES; funding acquisition, MZW, AK. All authors have read and agreed to the published version of the manuscript.
CONFLICT OF INTEREST
MJ reports personal fees from ALK‐Abello, Allergopharma, Stallergenes, Anergis, Allergy Therapeutics, Leti, HAL, GSK, Novartis, Teva, Takeda, and Chiesi. All other authors declare no conflict of interest.
Supporting information
Appendix S1
ACKNOWLEDGMENTS
The publication was prepared under the project financed from the funds granted by the Ministry of Science and Higher Education in the “Regional Initiative of Excellence” programme for the years 2019‐2022, project number 016/RID/2018/19, the amount of funding 9 354 023.74 PLN.
Zemelka‐Wiacek M, Kosowska A, Winiarska E, Sobanska E, Jutel M. Validated allergen exposure chamber is plausible tool for the assessment of house dust mite‐triggered allergic rhinitis. Allergy. 2023;78:168‐177. doi: 10.1111/all.15485
Contributor Information
Magdalena Zemelka‐Wiacek, Email: magdalena.zemelka-wiacek@umw.edu.pl.
Marek Jutel, Email: marek.jutel@umw.edu.pl.
REFERENCES
- 1. Rösner‐Friese K, Kaul S, Vieths S, Pfaar O. Environmental exposure chambers in allergen immunotherapy trials: current status and clinical validation needs. J Allergy Clin Immunol. 2015;135(3):636‐643. doi: 10.1016/j.jaci.2014.10.045 [DOI] [PubMed] [Google Scholar]
- 2. Hohlfeld JM, Holland‐Letz T, Larbig M, et al. Diagnostic value of outcome measures following allergen exposure in an environmental challenge chamber compared with natural conditions. Clin Exp Allergy. 2010;40(7):998‐1006. doi: 10.1111/j.1365-2222.2010.03498.x [DOI] [PubMed] [Google Scholar]
- 3. Gherasim A, Fauquert JL, Domis N, Siomboing X, de Blay F. Birch allergen challenges in allergic conjunctivitis using standard conjunctival allergen challenge and environmental exposure chamber. Clin Transl Allergy. 2021;11(6):e12053. doi: 10.1002/clt2.12053 [DOI] [PMC free article] [PubMed] [Google Scholar]
- 4. Day JH, Briscoe MP. Environmental exposure unit: a system to test anti‐allergic treatment. Ann Allergy Asthma Immunol. 1999;83(2):83‐93. doi: 10.1016/S1081-1206(10)62616-6 [DOI] [PubMed] [Google Scholar]
- 5. Devillier P, Le Gall M, Horak F. The allergen challenge chamber: a valuable tool for optimizing the clinical development of pollen immunotherapy. Allergy. 2011;66(2):163‐169. doi: 10.1111/j.1398-9995.2010.02473.x [DOI] [PubMed] [Google Scholar]
- 6. Pfaar O, Zieglmayer P. Allergen exposure chambers: implementation in clinical trials in allergen immunotherapy. Clin Transl Allergy. 2020;10:33. doi: 10.1186/s13601-020-00336-9 [DOI] [PMC free article] [PubMed] [Google Scholar]
- 7. Hossenbaccus L, Steacy LM, Walker T, Ellis AK. Utility of environmental exposure unit challenge protocols for the study of allergic rhinitis therapies. Curr Allergy Asthma Rep 2020;20(8):34. doi: 10.1007/s11882-020-00922-8, 20 [DOI] [PubMed] [Google Scholar]
- 8. Pfaar O, Bergmann KC, Bonini S, et al. Technical standards in allergen exposure chambers worldwide ‐ an EAACI task force report. Allergy. 2021;76(12):3589‐3612. doi: 10.1111/all.14957 [DOI] [PubMed] [Google Scholar]
- 9. Pfaar O, Calderon MA, Andrews CP, et al. Allergen exposure chambers: harmonizing current concepts and projecting the needs for the future ‐ an EAACI position paper. Allergy. 2017;72(7):1035‐1042. doi: 10.1111/all.13133 [DOI] [PubMed] [Google Scholar]
- 10. Bousquet J, Khaltaev N, Cruz AA, et al. Allergic rhinitis and its impact on asthma (ARIA) 2008 update (in collaboration with the World Health Organization, GA(2)LEN and AllerGen). Allergy. 2008;63(suppl 86):8‐160. doi: 10.1111/j.1398-9995.2007.01620.x [DOI] [PubMed] [Google Scholar]
- 11. Proctor T, Morrough E, Fenske O, et al. Impact on quality of life and safety of sublingual and subcutaneous immunotherapy in children with severe house dust mite and pollen‐associated allergic rhinoconjunctivitis. Clin Transl. Allergy. 2020;10:10. doi: 10.1186/s13601-020-00315-0 [DOI] [PMC free article] [PubMed] [Google Scholar]
- 12. Schoenwetter WF. Allergic rhinitis: epidemiology and natural history. Allergy Asthma Proc. 2000;21(1):1‐6. doi: 10.2500/108854100778248971 [DOI] [PubMed] [Google Scholar]
- 13. Miraglia Del Giudice M, Allegorico A, Marseglia GL, et al. Allergic rhinoconjunctivitis. Acta Biomed. 2020;91(11‐S):e2020007. doi: 10.23750/abm.v91i11-S.10310 [DOI] [PMC free article] [PubMed] [Google Scholar]
- 14. Colloff MJ. Dust Mites. Springer, CSIRO Publishing; 2009. [Google Scholar]
- 15. Dreborg S. Mite allergens. Collection, determination, expression of results, and risk levels for sensitization and symptom induction. Allergy. 1998;53(suppl 48):88‐91. doi: 10.1111/j.1398-9995.1998.tb05005.x [DOI] [PubMed] [Google Scholar]
- 16. Thomas WR. Hierarchy and molecular properties of house dust mite allergens. Allergol Int. 2015;64(4):304‐311. doi: 10.1016/j.alit.2015.05.004 [DOI] [PubMed] [Google Scholar]
- 17. Acevedo N, Zakzuk J, Caraballo L. House dust mite allergy under changing environments. Allergy Asthma Immunol Res. 2019;11(4):450‐469. doi: 10.4168/aair.2019.11.4.450 [DOI] [PMC free article] [PubMed] [Google Scholar]
- 18. Aggarwal P, Senthilkumaran S. Dust Mite Allergy. StatPearls Publishing; 2022. [PubMed] [Google Scholar]
- 19. Calderón MA, Linneberg A, Kleine‐Tebbe J, et al. Respiratory allergy caused by house dust mites: what do we really know? J Allergy Clin Immunol. 2015;136(1):38‐48. doi: 10.1016/j.jaci.2014.10.012 [DOI] [PubMed] [Google Scholar]
- 20. Graham BL, Steenbruggen I, Miller MR, et al. Standardization of spirometry 2019 update. An official American Thoracic Society and European Respiratory Society technical Statement. Am J Respir Crit Care med. 2019;200(8):e70‐e88. doi: 10.1164/rccm.201908-1590ST [DOI] [PMC free article] [PubMed] [Google Scholar]
- 21. European Medicines Agency . Guideline for clinical development of allergen immunotherapy products CHMP/EWP/18504/2006. 2006. Accessed June 10, 2022. https://www.ema.europa.eu › scientific‐guideline
- 22. Pfaar O, Demoly P, Gerth van Wijk R, et al. Recommendations for the standardization of clinical outcomes used in allergen immunotherapy trials for allergic rhinoconjunctivitis: an EAACI position paper. Allergy. 2014;69(7):854‐867. doi: 10.1111/all.12383 [DOI] [PubMed] [Google Scholar]
- 23. Bergmann KC, Krause L, Hiller J, et al. First evaluation of a symbiotic food supplement in an allergen exposure chamber in birch pollen allergic patients. World Allergy Organ J. 2020;14(1):100494. doi: 10.1016/j.waojou.2020.100494 [DOI] [PMC free article] [PubMed] [Google Scholar]
- 24. Ellis AK, Steacy LM, Hobsbawn B, Conway CE, Walker TJ. Clinical validation of controlled grass pollen challenge in the environmental exposure unit (EEU). Allergy Asthma Clin Immunol. 2015;11(1):5. doi: 10.1186/s13223-015-0071-3 [DOI] [PMC free article] [PubMed] [Google Scholar]
- 25. Hashiguchi K, Tang H, Fujita T, et al. Preliminary study on Japanese cedar pollinosis in an artificial exposure chamber (OHIO chamber). Allergol Int. 2007;56(2):125‐130. doi: 10.2332/allergolint.O-06-453 [DOI] [PubMed] [Google Scholar]
- 26. Ito K, Terada T, Yuki A, et al. Preliminary study of a challenge test to the patients with Japanese cedar pollinosis using an environmental exposure unit. Auris Nasus Larynx. 2010;37(6):694‐699. doi: 10.1016/j.anl.2010.04.001 [DOI] [PubMed] [Google Scholar]
- 27. Krug N, Hohlfeld JM, Larbig M, et al. Validation of an environmental exposure unit for controlled human inhalation studies with grass pollen in patients with seasonal allergic rhinitis [published correction appears in clin exp allergy. 2004 Feb;34(2):322]. Clin Exp Allergy. 2003;33(12):1667‐1674. doi: 10.1111/j.1365-2222.2003.01810.x [DOI] [PubMed] [Google Scholar]
- 28. Day JH, Briscoe M, Widlitz MD. Cetirizine, loratadine, or placebo in subjects with seasonal allergic rhinitis: effects after controlled ragweed pollen challenge in an environmental exposure unit. J Allergy Clin Immunol. 1998;101(5):638‐645. doi: 10.1016/S0091-6749(98)70172-1 [DOI] [PubMed] [Google Scholar]
- 29. Zieglmayer P, Lemell P, Chen KW, et al. Clinical validation of a house dust mite environmental challenge chamber model. J Allergy Clin Immunol. 2017;140(1):266‐268.e5. doi: 10.1016/j.jaci.2016.12.986 [DOI] [PubMed] [Google Scholar]
- 30. Hossenbaccus L, Linton S, Thiele J, et al. Clinical validation of controlled exposure to house dust mite in the environmental exposure unit (EEU). Allergy asthma. Clin Immunol. 2021;17(1):34. doi: 10.1186/s13223-021-00536-3 [DOI] [PMC free article] [PubMed] [Google Scholar]
- 31. Lueer K, Biller H, Casper A, et al. Safety, efficacy and repeatability of a novel house dust mite allergen challenge technique in the Fraunhofer allergen challenge chamber. Allergy. 2016;71(12):1693‐1700. doi: 10.1111/all.12947 [DOI] [PubMed] [Google Scholar]
- 32. Jacobs RL, Rather C, Jimenez F, et al. Validation of Biogenics research chamber for elicitation of symptoms to dust mite antigen (Der p1). J Allergy Clin Immunol. 2014;133(2):AB221. [Google Scholar]
- 33. Khayath N, Doyen V, Gherasim A, et al. Validation of Strasbourg environmental exposure chamber (EEC) ALYATEC® in mite allergic subjects with asthma. J Asthma. 2020;57(2):140‐148. doi: 10.1080/02770903.2018.1563902 [DOI] [PubMed] [Google Scholar]
Associated Data
This section collects any data citations, data availability statements, or supplementary materials included in this article.
Supplementary Materials
Appendix S1