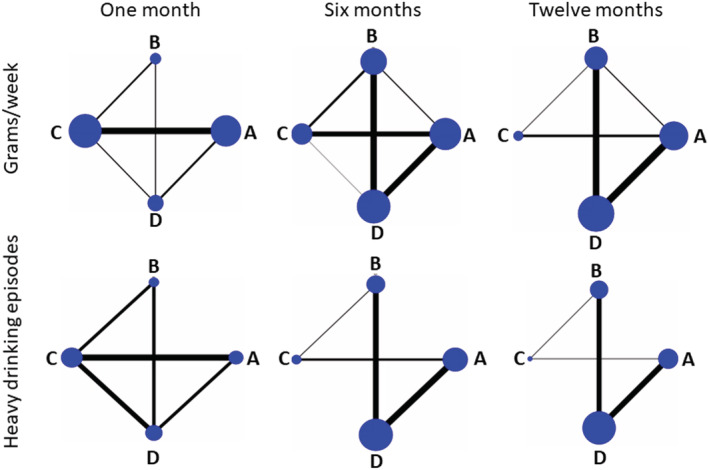
FIGURE 2.

Network maps for grams/week and number of binge drinking episodes at 1, 6 and 12 months. Randomised comparisons between conditions are depicted by lines between nodes. Size of circular nodes is proportional to the number of arms providing data; thickness of the connections is proportional to the number of comparisons available from the included trials. (a) Assessment only (reference node); (b) minimal alcohol information; (c) digitally delivered intervention; (d) practitioner‐delivered intervention
