FIGURE 2.

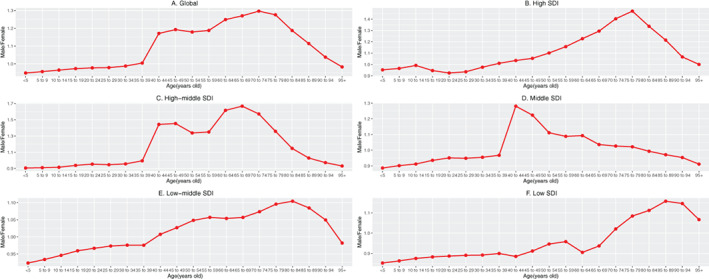
The ratio of male to female incidence among different age groups in 2019. (A) Global. (B) High SDI. (C) High‐middle SDI. (D) Middle SDI. (E) Middle‐low SDI. (F) Low SDI. SDI, socio‐demographic index.

The ratio of male to female incidence among different age groups in 2019. (A) Global. (B) High SDI. (C) High‐middle SDI. (D) Middle SDI. (E) Middle‐low SDI. (F) Low SDI. SDI, socio‐demographic index.