

Abstract
Objective
to evaluate fetal growth in pregnancies complicated by placenta accreta spectrum (PAS) and to compare fetal growth between cases stratified by ultrasound stage of PAS.
Methods
This was a prospective multicenter cohort study of women diagnosed with PAS between January 2018 and December 2021. We grouped participants into cases by ultrasound stage (PAS stage 1–3) and controls (PAS0). Fetal growth centiles at three timepoints with median gestational ages of 21 ± 1 weeks (interquartile range [IQR], 20 ± 1–22 ± 0 weeks), 28 ± 0 weeks (IQR, 27 ± 0–28 ± 5 weeks), and 33 ± 0 weeks (IQR, 32 ± 1–34 ± 0 weeks) and birth weight centiles were compared between cases and controls and between those with PAS stratified by ultrasound stage.
Results
A total of 53 women met inclusion criteria, with a mean age of 37 years (standard deviation, ±4.0 years) and body mass index of 27 kg/m2 (standard deviation, ±5.8 kg/m2). Median (IQR) fetal weight centiles were around the 50th centile at each timepoint, with no difference between groups. The incidence of small for gestational age (birth weight ≤ 10th percentile) and large for gestational age (birth weight ≥ 90th percentile) was 11.3% (n = 6) and 15.1% (n = 8), respectively, with no differences by ultrasound stage. The median birth weight centile was 64 (IQR, 26–85), with no differences between cases and controls or by ultrasound stage.
Conclusions
In our cohort, a diagnosis of PAS was not associated with fetal growth restriction.
Keywords: birth weight, fetal growth, placenta accreta spectrum, ultrasound stage
Synopsis
Placenta accreta spectrum does not seem to result in placental insufficiency and fetal growth abnormalities, with normal growth seen across all stages of ultrasound severity in our cohort.
1. INTRODUCTION
Placenta accreta spectrum (PAS) describes a range of disease severity where the placenta is adherent or invaded into the myometrium and is associated with significant maternal morbidity, and the incidence continues to increase. 1 , 2 Antenatal diagnosis is suspected based on typical ultrasonographic features. 3 PAS can be classified into four ultrasound stages based on the number and severity of these features, with the more severe stages associated with higher maternal morbidity. 4 Ultrasound classification largely correlates with subsequent histopathological classification, which is graded by laparotomy and/or microscopic examination by FIGO (the International Federation of Gynecology & Obstetrics). 5
The classification of PAS based on ultrasound findings was first described by Cali et al. 4 The least severe stage, PAS0, describes placenta previa with no features of PAS, while the most severe stage, PAS3, is reserved for cases where multiple ultrasound features of PAS are present along with increased vascularity in the inferior part of the lower uterine segment extending into the parametrial region. Severity of ultrasound classification has been shown to correlate with maternal morbidity and FIGO histological classification. 4 , 5
Descriptions of fetal growth in PAS are limited. There are several plausible explanations to suggest that the placentation in PAS may be associated with small for gestational age (SGA, birth weight < 10th centile 6 ). First, a number of studies have suggested an increased risk of SGA in women with placenta previa, 7 , 8 and as the majority of cases of PAS are associated with placenta previa, 5 this association may apply to cases of PAS with placenta previa.
Furthermore, the most common predisposing risk factor for developing PAS is a previous cesarean section, with the risk of PAS increasing seven‐fold after one prior cesarean section. 9 , 10 Women with a previous cesarean section are more likely to have lower uterine artery volume blood flow and increased resistance of uterine artery Doppler measurement. 11 Abnormalities of uterine artery Doppler are associated with an increased risk of SGA. 12 Furthermore, a cesarean section in a first birth compared with vaginal delivery was shown to increase the risk of SGA in a second pregnancy (odds ratio [OR], 1.5 [95% confidence interval (CI), 1.4–1.5]). 13
An essential step in normal placentation is spiral artery transformation in early pregnancy from high resistance to low resistance vessels. 14 Failure of spiral artery transformation in pregnancy has been associated with SGA and other pregnancy complications. 15 , 16 A number of studies have described abnormal remodeling of spiral arteries in PAS, with vessels in PAS cases demonstrating decreased proportion of remodeling and only partial physiologic change 17 and reduced spiral artery remodeling in areas of absent decidua. 18
The only study to date that evaluated fetal growth in patients with PAS was a retrospective cohort study comparing 82 women with PAS, 146 with placenta previa, and 64 controls with a low‐lying placenta. 19 The authors found no difference in fetal growth between cases and controls and concluded that serial measurements of fetal growth were not indicated in women with PAS. To our knowledge, fetal growth and birth weight stratified by ultrasound severity has not been previously described.
Hence, the literature relating to fetal growth in PAS is limited. The aim of this study is to evaluate fetal growth in women with PAS and compare fetal growth and birth centiles stratified by ultrasound stage of PAS.
2. MATERIALS AND METHODS
This was a prospective multicenter cohort study conducted between January 2018 and December 2021 with institutional ethics approval and maternal written consent. Two tertiary referral centers participated in recruitment and data collection. A joint multidisciplinary team for the management of women with PAS exists between the two centers, where approximately 10 to 15 women receive care per year.
Participants were recruited at the time of first suspicion of PAS from ultrasound findings and provided written informed consent. Inclusion criteria were as follows: ultrasound features of PAS as previously described 3 with intraoperative confirmation of PAS as outlined by FIGO criteria, 5 with histological confirmation from either peripartum hysterectomy or myometrial resection, 20 or placenta previa with a previous cesarean section and no ultrasonographic features of PAS, and age older than 18 years, ability to consent, and corresponding data available on fetal growth and birth weight. Participants with risk factors for SGA (such as pre‐eclampsia or hypertension) were not excluded from the study. Data were collected prospectively.
Ultrasound examinations were performed by trained fetal‐maternal specialists, with severity of PAS classified from PAS0 to PAS3 as previously described. 4 Cases of placenta previa with no ultrasonographic features of PAS, classified as PAS0, acted as the control group.
For estimation of fetal growth, fetal measurements were obtained from ultrasound scans performed at three timepoints with median weeks of gestation of 21 ± 1 (interquartile range [IQR], 20 ± 1–22 ± 0), 28 ± 0 (IQR, 27 ± 0–28 ± 5), and 33 ± 0 (IQR, 32 ± 1–34 ± 0), including abdominal circumference, head circumference, biparietal diameter, and femur length. Estimated fetal weight was calculated using the four parameter Hadlock formula. 21 Amniotic fluid as estimated by deepest vertical pool and uterine artery Doppler were recorded at each timepoint as a measure of placental function.
Birth weight centiles and z scores were calculated using the formula plotted by the reference range for gestational age as described by the Fetal Medicine Foundation (FMF). 22 SGA was defined as a birth weight ≤10th percentile and large for gestational age (LGA) as a birth weight ≥90th percentile.
All cases included in this study were part of a multicenter PAS Multidisciplinary Team (MDT). The management and surgical approach has previously been described. 23 In brief, elective delivery gestation and surgical approach are determined based on suspected ultrasound severity and individual case factors, including maternal preferences, by the MDT. For most cases, an elective delivery is planned between 34 and 36 ± 6 weeks of gestation. A standardized surgical approach as previously described is followed, 24 with no attempts at manual separation of the placenta where intraoperative findings confirm PAS. Involvement of interventional radiology is determined on a case‐by‐case basis, usually reserved either for severe cases of PAS3 or where uterine conservation with myometrial resection is planned, and, where used, is performed by aortic balloon occlusion.
Data were assessed for normality using standard kurtosis analysis. Normally distributed values are presented as mean and standard deviation, with non‐normally distributed values presented as median and IQR. Categorical variables were compared between groups using the Pearson χ2 test and Fisher exact test as appropriate. For continuous variables, comparisons were made using t test and ANOVA and Kruskal‐Wallis for normally and non‐normally distributed values respectively, with Bonferroni correction for multiple tests performed. A two‐tailed P value <0.05 was considered significant. All statistical analyses were performed using IBM SPSS software for Windows version 27.0.
Ethical approval was granted by the hospital ethics committee and written informed consent was obtained from participants (reference EC02.2018).
3. RESULTS
A total of 53 women met inclusion criteria, with a mean age of 37 years (±4.0 years) and body mass index of 27 kg/m2 (±5.8 kg/m2). All women had at least one prior cesarean section, with a median of two (IQR, 1–2) cesarean sections. The majority of women were of Irish ethnicity (n = 50, 94%) and nonsmokers (n = 48, 90%). Two participants developed mild pregnancy‐induced hypertension in the PAS1 and PAS 2 groups at 31 and 32 weeks of gestation, respectively. No participants developed pre‐eclampsia. Three participants developed gestational diabetes, managed with diet and exercise (one in each group of PAS1, PAS2, and PAS3).
The median of first suspicion of PAS was 28 weeks (IQR, 24–32 weeks). Seven participants were upstaged from their initial ultrasound scan where PAS was suspected as gestation advanced, of whom five had PAS1 at the 21 ± 1 week (20 ± 1–22 ± 0 weeks) ultrasound assessment and were subsequently classified as having PAS2, while two had PAS2 at the 21 ± 1‐week (20 ± 1–22 ± 0 weeks) scan and met criteria for PAS3 at the 28 ± 0‐week (27 ± 0–28 ± 5 weeks) scan.
Maternal outcomes as stratified by ultrasound PAS stage are described in Table 1. An ultrasound stage of PAS3 or PAS2 was associated with a higher rate of hysterectomy compared with PAS1 (PAS3 vs. PAS1 [P = 0.007] and PAS2 vs. PAS1 [P = 0.002]) and PAS0 (PAS3 vs. PAS0 [P = 0.0001], PAS2 vs. PAS0 [P = 0.001]), and PAS3 was associated with higher median blood loss compared with PAS0 (P = 0.008) and PAS2 (P = 0.051) (Figure 1). There were no maternal deaths during the study period.
TABLE 1.
Maternal and fetal outcomes by PAS ultrasound stage
| Total cohort (N = 53) | PAS0 (n = 11) | PAS1 (n = 17) | PAS2 (n = 17) | PAS3 (n = 8) | P value | |
|---|---|---|---|---|---|---|
| Age, year | 37 (±4.0) | 37.2 (±3.4) | 37.6 (±4.1) | 37.0 (±4.4) | 36.8 (±4.4) | 0.667 |
| BMI, kg/m2 | 27 (±5.8) | 25.1 (±4.5) | 28.4 (±4.8) | 26.7 (±6.3) | 29.7 (±8.4) | 0.326 |
| No. of previous CS, median (IQR) | 2 (1–2) | 2 (1–2) | 1 (1–2) | 2 (1–2.5) | 2.5 (1.25–3) | 0.083 |
| Maternal outcomes | ||||||
| Hysterectomy n (%) | 31 (58.5) | 0 | 7 (41.7)* | 16 (94.1)*,† | 8 (100)*,† | <0.001 |
| Estimated blood loss, median (IQR), ml | 1200 (762.5–2462.5) | 725 (437–1225) | 1500 (1100–3000) | 1000 (775–1925) | 2147 (1275–6300)*,‡ | 0.021 |
| Blood transfusion | ||||||
| Received RCCs, n (%) | 21 (39.6) | 2 (18) | 8 (47) | 5 (29) | 6 (75) | 0.161 |
| Units transfused | 3 (2–4) | 3 | 2 (2–4) | 3 (1.5–4.5) | 4 (2–6) | 0.815 |
| Fetal outcomes | ||||||
| Gestation at delivery, median (IQR) | 34 ± 3 (33 ± 1–36 ± 5) | 36 ± 2 (34 ± 1–37 ± 4) | 35 ± 3 (33 ± 1–34 ± 4) | 34 ± 4 (32 ± 1–35 ± 6) * | 32 ± 5 (29 ± 1–34 ± 6) *† | 0.003 |
| Fetal EFW centile, median (IQR) | ||||||
| 21 ± 1 (20 ± 1–22 ± 0) week | 53.5 (45.0–66.7) | 51.0 (44.2–64.0) | 52.0 (34.7–71.7) | 53.0 (45.0–66.0) | 55.0 (45.0–82.0) | 0.785 |
| 28 ± 0 (27 ± 0–28 ± 5) week | 55.0 (28.0–73.0) | 50.0 (25.0–70.0) | 65.0 (24.7–73.5) | 47.0 (25.7–74.2) | 55.0 (38.0–77.0) | 0.874 |
| 33 ± 0 (32 ± 1–34 ± 0) week | 61.0 (44.0–78.5) | 55.0 (32.5–65.5) | 65.0 (44.0–80.0) | 60.0 (45.0–73.0) | 51.0 (22.7–83.2) | 0.819 |
| Birth weight | ||||||
| Centile, median (IQR) | 64 (26–85) | 45 (14–74) | 74 (22–93) | 64 (32–86) | 60 (5.5–82.75) | 0.468 |
| z score | 0.13 (±1.1) | −0.24 (±1.1) | 0.32 (±1.2) | 0.3 (±0.9) | −0.18 (±1.5) | 0.418 |
| <10th centile, n (%) | 6 (11.3) | 2 (18.2) | 2 (11.8) | 0 | 2 (25) | 0.243 |
| >90th centile, n (%) | 8 (15.1) | 0 | 5 (29.4) | 2 (11.8) | 1 (12.5) | 0.182 |
Note: Numerical data are mean ± standard deviation unless otherwise indicated, and categorical data are number (percentage). Χ2 and Fisher exact test for categorical variables. The P value denotes the overall significance of analysis of variance and Kruskal‐Wallis test. Significant differences between subgroups P < 0.05 are represented by the following symbols: denotates significance compared with *PAS0, †PAS1, and ‡PAS2.
Abbreviations: EFW, estimated fetal weight; IQR, interquartile range; PAS, placenta accreta spectrum; RCC, red cell concentrates.
FIGURE 1.
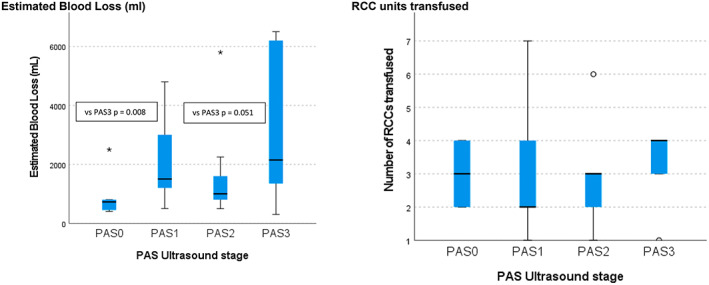
Maternal outcomes and placenta accreta spectrum (PAS) ultrasound stage. The black line denotes the median and the blue box denotes the interquartile range (IQR, 25th–75th percentiles). The estimated blood loss was higher in the PAS3 group compared with the PAS0 (P = 0.008) and PAS2 (P = 0.050) groups. There were no significant differences in red cell concentrate (RCC) units transfused between groups.
The median gestational age at delivery for the entire cohort was 34 ± 3 weeks (33 ± 1–36 ± 5 weeks), with PAS3 associated with earlier median delivery gestation of 32 ± 5 weeks (29 ± 1–34 ± 6 weeks) compared with PAS0 and PAS1. The incidence of SGA and LGA for the entire cohort was 11.3% (n = 6) and 15.1% (n = 8), respectively, with no differences between PAS ultrasound stage (Table 1) or comparing cases and controls (Table 2). EFW centiles were similar at each timepoint for all groups, with no differences between PAS0 and PAS1 to PAS3 (Table 2) or between PAS ultrasound scores (Figure 2). Regarding assessment of placental function, there were two cases with oligohydramnios (deepest pocket < 3 cm); however, both were in the clinical context of preterm ruptured membranes. One case of SGA in the PAS3 group was associated with increased resistance on umbilical artery Doppler, which emerged at 23 weeks. There were no cases of absent or reversed flow in the entire cohort.
TABLE 2.
Fetal growth and birth weight in PAS0 and PAS1 to PAS3
| Fetal outcomes | PAS0 (n = 11) | PAS1 to PAS3 (n = 42) | P value |
|---|---|---|---|
| Gestation at delivery, median (IQR) | 36 ± 2 (34 ± 1–37 ± 4) | 34 ± 3 (31 ± 1–35 ± 5) | 0.007 |
| Fetal EFW centile, median (IQR) | |||
| 21 ± 1 (20 ± 1–22 ± 0) week | 51.0 (44.2–64.0) | 53.5 (45.0–69.0) | 0.577 |
| 28 ± 0 (27 ± 0–28 ± 5) week | 50.0 (25.0–70.0) | 55.0 (26.0–74.0) | 0.685 |
| 33 ± 0 (32 ± 1–34 ± 0) week | 55.0 (32.5–65.5) | 63.0 (44.0–80.0) | 0.548 |
| Birth weight | |||
| Centile, median (IQR) | 45 (14–74) | 68 (27.0–86.2) | 0.259 |
| z score | −0.24 (±1.1) | 0.23 (±1.1) | 0.230 |
| <10th centile, n (%) | 2 (18.2) | 4 (9.5) | 0.121 |
| >90th centile, n (%) | 0 | 8 (19) | 0.430 |
Note: Table 2 presents cases of placenta accreta spectrum (PAS1 to PAS3) and controls (PAS0) and fetal growth and birth weight centiles. Data are mean ± standard deviation or number (percentage) unless otherwise indicated.
Abbreviations: EFW, estimated fetal weight; IQR, interquartile range.
FIGURE 2.
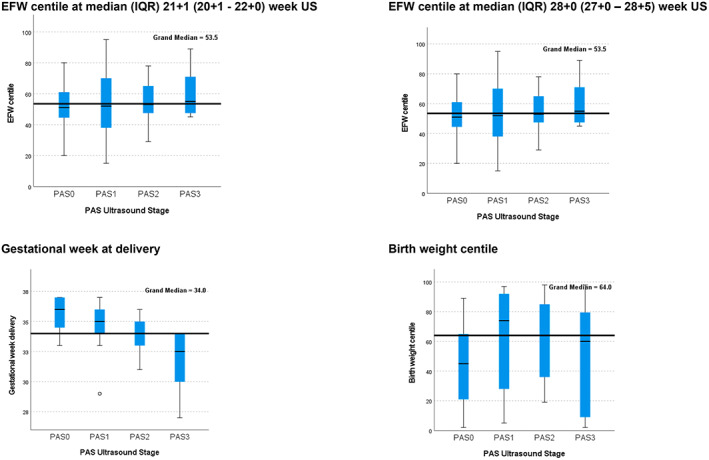
Fetal outcomes and placenta accreta spectrum (PAS) ultrasound stage. The black line denotes the median and the blue box denotes the interquartile range (IQR, 25th–75th percentiles). PAS3 was associated with a significantly earlier median gestation at delivery compared with PAS1 (P = 0.003) and PAS2 (P = 0.002). EFW, estimated fetal weight.
For median birth weight, the centile was 64 (IQR, 26–85) and z score was 0.13 (±1.1) for the entire cohort, with no differences in birth weight centiles when stratified by ultrasound severity (Figure 2) or between PAS0 and PAS1 to PAS3.
4. DISCUSSION
This study found no difference in fetal growth or birth weight centiles between PAS cases stratified by ultrasound stage. The median fetal growth and birth weight centiles were approximately the 50th centile in all groups. The incidence of SGA was not increased in our cohort of PAS cases.
SGA is defined as an estimated fetal weight of <10th centile and affects up to 10% of pregnancies, 25 , 26 which is similar to the incidence reported in the current study. The majority of fetus's with SGA will have a good perinatal outcome, with those below the third centile or with abnormal umbilical artery Dopplers with or without oligohydramnios at highest risk of adverse outcomes. 27 In our cohort, we reported no cases of severe growth restriction less than the third centile or absent or reversed umbilical artery on Doppler.
The literature relating to fetal growth in PAS is limited. One of the hypotheses that PAS may be associated with SGA or low birth weight relates to the association of PAS and placenta previa, which has been identified as a potential risk factor for abnormal fetal growth in a number of studies. 7 , 8 A large metanalysis of retrospective cohort studies including 1 593 226 singleton pregnancies, of which 10 575 had placenta previa, found that the incidence of growth abnormalities was 8.7 of 100 births in cases of placenta praevia compared with 5.8 of 100 among controls, and overall pregnancies with placenta previa were associated with a mild increase in the risk of SGA (pooled OR, 1.19 [95% CI, 1.10–1.27]). 7 A population‐based retrospective cohort study including 2744 women with placenta previa found that, after controlling for confounders for SGA such as ethnicity and smoking, placenta previa was associated with a small increased risk of severe (OR, 1.37 [95% CI, 1.25–1.50]) and moderate fetal growth restriction (OR, 1.24 [95% CI, 1.17–1.32]). 8 However, the included studies had a high statistical heterogeneity with an I 2 of 94% and there were no data relating to PAS cases in the metanalysis. In contrast, a study including 59 149 women, where 724 (1.2%) were diagnosed with a complete or partial praevia, after adjusting for significant confounding factors (Black race, gestational diabetes, preeclampsia, and single umbilical artery), the risk of intrauterine growth restriction was similar between groups. 28 The presence of bleeding did not impact the risk of growth restriction in their cohort. 28
Hence, while several studies have explored fetal growth in placenta previa with conflicting results, the literature relating to PAS cases is limited. The only study to date that specifically addressed fetal growth in PAS, to our knowledge, found no increase in the incidence of SGA or low birth weight between PAS cases and placenta previa. 19 This reflects the findings of our study. While an Australian population study where data were obtained from birth records found the incidence of SGA, stillbirth, and neonatal mortality in PAS cases was increased compared with all other women who gave birth during the study period, when stratified by prematurity, these differences were no longer significant. 29
In our cohort of patients with PAS, we found no difference in SGA or low birth weight by ultrasound severity. We also found no other features suggestive of placental insufficiency such as reduced amniotic fluid volume or umbilical artery Dopplers. This further supports the limited evidence to date that PAS is not associated with SGA or abnormalities of fetal growth.
This study has a number of strengths and limitations. PAS cases were selected based on standardized, previously described criteria for ultrasound, clinical criteria from intraoperative findings, and histology reporting. Ultrasound assessments were performed by fetal maternal specialists, with ultrasound signs and severity of PAS classified by clearly defined ultrasound criteria. 3 , 4 Cases were confirmed using clinical 5 and histological criteria 20 as previously described. Furthermore, birth weight centiles were calculated using the formula from the FMF, where underestimates of SGA are less likely as both birth weight and estimated fetal weight for gestational age are evaluated. 22 The current study is limited by the small sample size and the heterogeneity within the population.
In conclusion, PAS was not associated with SGA or low birth weight in our cohort, and no differences were seen by ultrasound stage. This further supports the current limited literature that there is no association between SGA or low birth weight in patients with PAS.
AUTHOR CONTRIBUTIONS
Study design: HB, JW, COC, SC, PMCP, SH, KM, PD, DB, GC, FMcA, JD, SC. Study planning: HB, JW, COC, KM, SC, PMCP, PD, GC. Data collection and analysis: HB, JW, COC, PMCP, SC, SH, KM, PD, DB, GC, FMcA, JD, SC. Manuscript writing: HB, SC, DB, JW, FMcA. Manuscript editing: HB, JW, COC, PMCP, SC, SH, KM, PD, DB, GC, FMcA, JD, SC. All authors read and approved the final manuscript.
CONFLICT OF INTEREST
The authors have no conflicts of interest.
ACKNOWLEDGMENTS
This research was supported by funding from the National Maternity Hospital Medical Fund and Placenta Accreta Ireland. We would like to acknowledge the women who participated in this study. Open access funding provided by IReL.
Bartels HC, Walsh JM, O’Connor C, et al. Placenta accreta spectrum ultrasound stage and fetal growth. Int J Gynecol Obstet. 2023;160:955‐961. doi: 10.1002/ijgo.14399
DATA AVAILABILITY STATEMENT
Research data are not shared.
REFERENCES
- 1. O'Brien JM, Barton JR, Donaldson ES. The management of placenta percreta: conservative and operative strategies. Am J Obstet Gynecol. 1996;175(6):1632‐1638. [DOI] [PubMed] [Google Scholar]
- 2. Stotler B, Padmanabhan A, Devine P, Wright J, Spitalnik SL, Schwartz J. Transfusion requirements in obstetric patients with placenta accreta. Transfusion. 2011;51(12):2627‐2633. [DOI] [PubMed] [Google Scholar]
- 3. Collins SL, Ashcroft A, Braun T, et al. Proposal for standardized ultrasound descriptors of abnormally invasive placenta (AIP). Ultrasound Obstet Gynecol. 2016;47(3):271‐275. [DOI] [PubMed] [Google Scholar]
- 4. Cali G, Forlani F, Lees C, et al. Prenatal ultrasound staging system for placenta accreta spectrum disorders. Ultrasound Obstet Gynecol. 2019;53(6):752‐760. [DOI] [PubMed] [Google Scholar]
- 5. Jauniaux E, Ayres‐de‐Campos D, Langhoff‐Roos J, Fox KA, Collins S. FIGO classification for the clinical diagnosis of placenta accreta spectrum disorders. Int J Gynaecol Obstet. 2019;146(1):20‐24. [DOI] [PubMed] [Google Scholar]
- 6. de Onis M, Habicht JP. Anthropometric reference data for international use: recommendations from a World Health Organization expert committee. Am J Clin Nutr. 1996;64(4):650‐658. [DOI] [PubMed] [Google Scholar]
- 7. Balayla J, Desilets J, Shrem G. Placenta previa and the risk of intrauterine growth restriction (IUGR): a systematic review and meta‐analysis. J Perinat Med. 2019;47(6):577‐584. [DOI] [PubMed] [Google Scholar]
- 8. Ananth CV, Demissie K, Smulian JC, Vintzileos AM. Relationship among placenta previa, fetal growth restriction, and preterm delivery: a population‐based study. Obstet Gynecol. 2001;98(2):299‐306. [DOI] [PubMed] [Google Scholar]
- 9. Fitzpatrick KE, Sellers S, Spark P, Kurinczuk JJ, Brocklehurst P, Knight M. Incidence and risk factors for placenta accreta/increta/percreta in the UK: a national case‐control study. PloS One. 2012;7(12):e52893. [DOI] [PMC free article] [PubMed] [Google Scholar]
- 10. Eshkoli T, Weintraub AY, Sergienko R, Sheiner E. Placenta accreta: risk factors, perinatal outcomes, and consequences for subsequent births. Am J Obstet Gynecol. 2013;208(3):219.e1‐219.e7. [DOI] [PubMed] [Google Scholar]
- 11. Flo K, Widnes C, Vårtun Å, Acharya G. Blood flow to the scarred gravid uterus at 22‐24 weeks of gestation. BJOG. 2014;121(2):210‐215. [DOI] [PubMed] [Google Scholar]
- 12. Cnossen JS, Morris RK, ter Riet G, et al. Use of uterine artery doppler ultrasonography to predict pre‐eclampsia and intrauterine growth restriction: a systematic review and bivariable meta‐analysis. CMAJ. 2008;178(6):701‐711. [DOI] [PMC free article] [PubMed] [Google Scholar]
- 13. Daltveit AK, Tollånes MC, Pihlstrøm H, Irgens LM. Cesarean delivery and subsequent pregnancies. Obstet Gynecol. 2008;111(6):1327‐1334. [DOI] [PubMed] [Google Scholar]
- 14. Burton GJ, Woods AW, Jauniaux E, Kingdom JC. Rheological and physiological consequences of conversion of the maternal spiral arteries for uteroplacental blood flow during human pregnancy. Placenta. 2009;30(6):473‐482. [DOI] [PMC free article] [PubMed] [Google Scholar]
- 15. Lyall F, Robson SC, Bulmer JN. Spiral artery remodeling and trophoblast invasion in preeclampsia and fetal growth restriction: relationship to clinical outcome. Hypertension. 2013;62(6):1046‐1054. [DOI] [PubMed] [Google Scholar]
- 16. Staff AC, Fjeldstad HE, Fosheim IK, et al. Failure of physiological transformation and spiral artery atherosis: their roles in preeclampsia. Am J Obstet Gynecol. 2022;226(2s):S895‐s906. [DOI] [PubMed] [Google Scholar]
- 17. Hannon T, Innes BA, Lash GE, Bulmer JN, Robson SC. Effects of local decidua on trophoblast invasion and spiral artery remodeling in focal placenta creta ‐ an immunohistochemical study. Placenta. 2012;33(12):998‐1004. [DOI] [PubMed] [Google Scholar]
- 18. Tantbirojn P, Crum CP, Parast MM. Pathophysiology of placenta creta: the role of decidua and extravillous trophoblast. Placenta. 2008;29(7):639‐645. [DOI] [PubMed] [Google Scholar]
- 19. Jauniaux E, Dimitrova I, Kenyon N, et al. Impact of placenta previa with placenta accreta spectrum disorder on fetal growth. Ultrasound Obstet Gynecol. 2019;54(5):643‐649. [DOI] [PMC free article] [PubMed] [Google Scholar]
- 20. Hecht JL, Baergen R, Ernst LM, et al. Classification and reporting guidelines for the pathology diagnosis of placenta accreta spectrum (PAS) disorders: recommendations from an expert panel. Mod Pathol. 2020;33(12):2382‐2396. [DOI] [PubMed] [Google Scholar]
- 21. Hadlock FP, Harrist RB, Sharman RS, Deter RL, Park SK. Estimation of fetal weight with the use of head, body, and femur measurements—a prospective study. Am J Obstet Gynecol. 1985;151(3):333‐337. [DOI] [PubMed] [Google Scholar]
- 22. Nicolaides KH, Wright D, Syngelaki A, Wright A, Akolekar R. Fetal Medicine Foundation fetal and neonatal population weight charts. Ultrasound Obstet Gynecol. 2018;52(1):44‐51. [DOI] [PubMed] [Google Scholar]
- 23. Bartels HC, Mulligan KM, Craven S, et al. Maternal morbidity in placenta accreta spectrum following introduction of a multi‐disciplinary service compared to standard care: an Irish perspective. Ir J Med Sci. 2021;190(4):1451‐1457. [DOI] [PubMed] [Google Scholar]
- 24. Brennan DJ, Schulze B, Chetty N, et al. Surgical management of abnormally invasive placenta: a retrospective cohort study demonstrating the benefits of a standardized operative approach. Acta Obstet Gynecol Scand. 2015;94(12):1380‐1386. [DOI] [PubMed] [Google Scholar]
- 25. Clinical Practice Guideline. Fetal Growth Restriction; Institute of Obstetricians and Gynaecologists RCoPoI, and Directorate of Clinical Strategy and Programmes. https://www.hse.ie/eng/services/publications/clinical‐strategy‐and‐programmes/fetal‐growth‐restriction.pdf HSEMAf.
- 26. Gordijn SJ, Beune IM, Thilaganathan B, et al. Consensus definition of fetal growth restriction: a Delphi procedure. Ultrasound Obstet Gynecol. 2016;48(3):333‐339. [DOI] [PubMed] [Google Scholar]
- 27. Unterscheider J, Daly S, Geary MP, et al. Optimizing the definition of intrauterine growth restriction: the multicenter prospective PORTO study. Am J Obstet Gynecol. 2013;208(4):290.e1‐290.e6. [DOI] [PubMed] [Google Scholar]
- 28. Harper LM, Odibo AO, Macones GA, Crane JP, Cahill AG. Effect of placenta previa on fetal growth. Am J Obstet Gynecol. 2010;203(4):330.e1‐330.e5. [DOI] [PMC free article] [PubMed] [Google Scholar]
- 29. Baldwin HJ, Patterson JA, Nippita TA, et al. Maternal and neonatal outcomes following abnormally invasive placenta: a population‐based record linkage study. Acta Obstet Gynecol Scand. 2017;96(11):1373‐1381. [DOI] [PubMed] [Google Scholar]
Associated Data
This section collects any data citations, data availability statements, or supplementary materials included in this article.
Data Availability Statement
Research data are not shared.