Abstract
Retinal imaging has been a key tool in the diagnosis, evaluation, management and documentation of diabetic retinopathy (DR) and diabetic macular oedema (DMO) for many decades. Imaging technologies have rapidly evolved over the last few decades, yielding images with higher resolution and contrast with less time, effort and invasiveness. While many retinal imaging technologies provide detailed insight into retinal structure such as colour reflectance photography and optical coherence tomography (OCT), others such as fluorescein or OCT angiography and oximetry provide dynamic and functional information. Many other novel imaging technologies are in development and are poised to further enhance our evaluation of patients with DR.
Keywords: diabetic eye disease, diabetic macular oedema, diabetic retinopathy, fundus image, ocular imaging
1. INTRODUCTION
Diabetes, a chronic metabolic disease, is a major public health problem worldwide. According to the World Health Organization (WHO) report, the prevalence of diabetes has been risen dramatically over the past three decades. An estimated 108 million people were affected with diabetes in 1980 and this figure rose to 422 million in 2014. 1 Diabetes was also a leading cause of death in many nations with 1.5 million deaths directly attributed to diabetes in 2019. 1 In addition to mortality, the morbidity associated with diabetes is staggering. Diabetes leads to significant injury to vessels and nerve cells throughout the body including the eye, where it is most common vision‐threatening manifestations are in the retina, known as diabetic retinopathy (DR). DR was reported to be the fifth most frequent cause of global blindness (0.8 million cases) in 2020. 2
Although it is now widely recognised that DR can be associated with a diabetic retinal neuropathy, 3 the retinal microangiopathy or vasculopathy associated with diabetes has been the primary focus of most diagnostic and therapeutic investigations. The retinal vascular manifestations of DR can lead to progressive vision loss through capillary closure or non‐perfusion (e.g., diabetic macular ischemia; DMI), chronic exudation (e.g., diabetic macular oedema; DMO), or the complications of neovascular and fibrous proliferation (e.g., vitreous haemorrhage or traction retinal detachment). While treatments for macular ischemia remain elusive, laser photocoagulation, intravitreal anti‐vascular endothelial growth factor (anti‐VEGF) treatment and modern vitreo‐retinal surgical techniques have dramatically improved prospects for positive visual outcomes for patients in with DMO and proliferative diabetic retinopathy (PDR). 4 , 5 , 6 , 7 , 8 Despite these advances in therapeutics, optimising systemic metabolic control as well as regular monitoring for early detection of DR remain key elements in achieving the best long‐term results for patients.
Ophthalmic imaging, and in particular retinal imaging have served as key elements in the diagnostic and therapeutic paradigm of DR and their role has only increased with the innovations and advances in technology over the past few decades. In this article, we review the applications of current ophthalmic imaging modalities in the management of DR, and look forward to future advances that are likely to be of high impact in the coming years.
Imaging technologies relevant for the assessment of DR include 2D or planar images as well as 3D images which offer tomographic assessment of the layers of the retina impacted by the disease process. Planar imaging technologies were historically film‐based, but in the modern era, like their 3D counterparts are now fully digital.
Many commercial imaging devices are multimodal, offering a number of 2D or 3D imaging technologies in a single instrument. Multimodal imaging may provide a more complete assessment of the disease process and its impact on the retina. Some imaging technologies only offer insight into structure or anatomy. Others may provide dynamic or functional information such as the velocity of blood flow or the leakage of material from the intravascular space which might indicate a compromised blood‐retinal barrier. These various technologies are detailed below beginning with structural imaging tools.
2. STRUCTURAL RETINAL IMAGING TECHNOLOGIES
2.1. Colour fundus photography and ultra‐widefield imaging
Colour fundus photography (CFP) has been the main imaging modality in the evaluation and documentation of DR for many decades. 9 The initial fundus camera (Zeiss FF, Carl Zeiss Meditec, Dublin, CA, USA) provided a 30° field of view with 2.5 magnification while, newer versions provide a wider view up to 55° (Figure 1), which covers the entire macula and optic nerve in a single frame. Multiple captures of the retina at different locations are usually taken and can be combined to create montage and/or stereoscopic images. A combination of 7 standard 30° fundus images provides a montage with ~75° field of view covering the macula, optic nerve, vascular arcades and the region temporal to the macula (~34% of retina), and was used in Early Treatment Diabetic Retinopathy Study (ETDRS) grading system and further refined into the commonly used Diabetic Retinopathy Severity Scale (DRSS). 10 , 11 Severity of DR was classified into 13 levels ranging from absence of retinopathy to severe proliferative retinopathy based on features seen on the 7‐standard ETDRS fields. The relevant lesions for assessing DR severity and DMO include microaneurysms (MAs), cotton wool spots, lipid exudates, retinal thickening (by a stereoscopic view), intraretinal microvascular anomalies (IRMAs), venous beading, neovascularization (NV), preretinal haemorrhage and vitreous haemorrhage. 11 The DRSS classification has proved to be a valuable and important grading system for both clinicians and researchers as it reflects the risk for further DR progression (e.g., a doubling of the rate of 1‐year progression to PDR occurred with a one‐level increase on the scale), and step‐changes on this scale have been used as clinical trial endpoints for regulatory approval. 11 , 12 The DRSS classification from the ETDRS was later collapsed to five levels for general DR assessment in common clinical settings, including no apparent retinopathy, mild nonproliferative diabetic retinopathy (NPDR), moderate NPDR (Figure 1), severe NPDR and PDR, of which DMO can be absent or present at each level as assessed by stereoscopic viewing. 13 However, conventional CFP has limitations, including image artefacts or reduced image quality due to media opacity (e.g., cataract or vitreous haemorrhage) and a limited field of view (>60% of the retina is not assessed when considering the 7‐standard fields).
FIGURE 1.
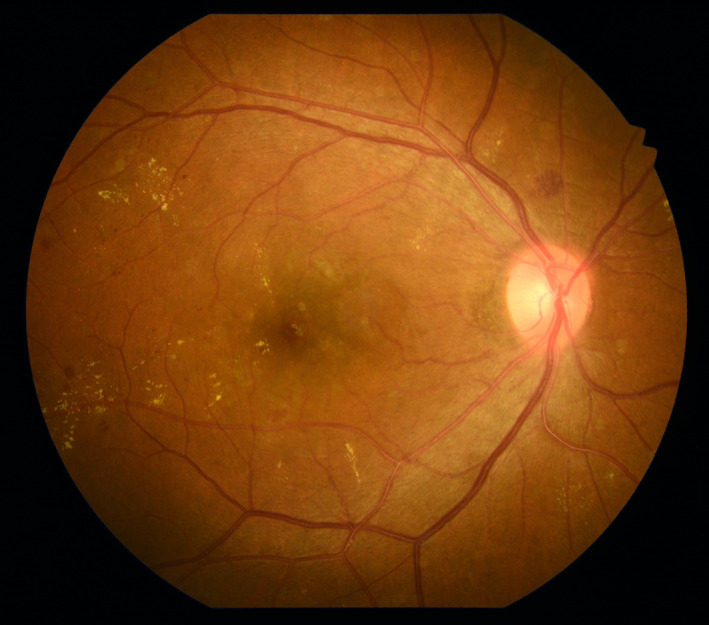
Conventional 50° colour fundus photograph (CFP) of a right eye with moderate nonproliferative diabetic retinopathy (NPDR). Microaneurysms (MAs), intraretinal blot haemorrhages, flame‐shape haemorrhages and hard exudates are evidenced in the macula and around optic disc. Image was obtained using the Kowa VX‐20 (Kowa Company, Ltd., Tokyo, Japan)
Over the years, some of these limitations have been addressed with the introduction of wider angle imaging including widefield (WF; Figure 2) and ultra‐widefield (UWF; Figure 3) technologies. Examples of these wider‐field devices include the 200Tx (Optos Plc, Dunfermline, Scotland, UK), Silverstone (Optos Plc), Clarus 700 (Carl Zeiss Meditec), and Mirante (Nidek Co., Ltd., Gamogori, Japan). The Optos device has been reported to provide up to a 200° field of view covering macula and peripheral retina (~82% of retina) in a single image (Figure 3). Field of view from these widefield devices can be further expanded by montage such as a montage of two widefield (133°) images from the Clarus device (Figure 4). 14 The theoretical advantage of the larger field of view is the detection and documentation of peripheral retinal pathology outside the ETDRS 7 standard fields, and a shorter acquisition time. 15
FIGURE 2.
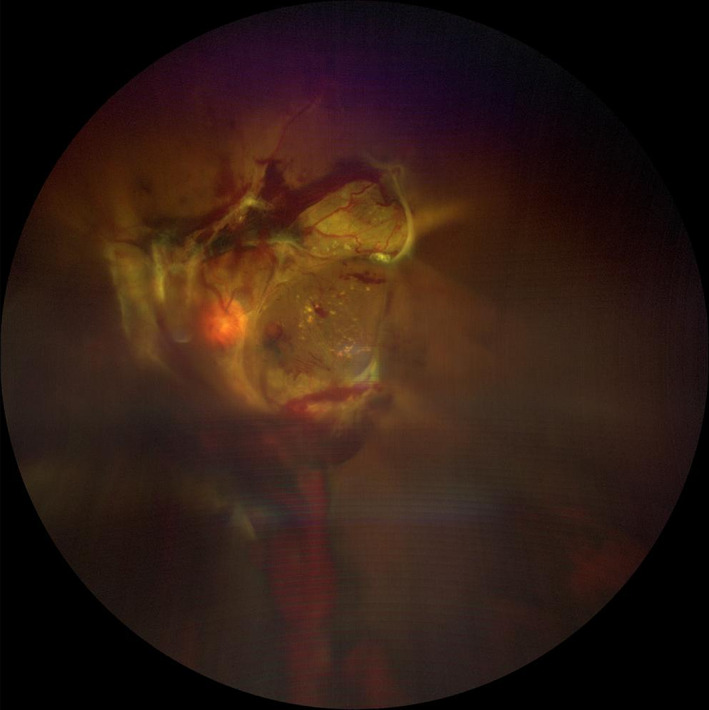
Widefield (WF; 133° field of view) colour fundus photograph (CFP) of a left eye with proliferative diabetic retinopathy (PDR) and vitreous haemorrhage and tractional retinal detachment. Vitreous haemorrhage caused a moderate opacity which impacts the quality of this image. The image was obtained using the Zeiss Clarus 500 (Carl Zeiss Meditec, Dublin, CA)
FIGURE 3.
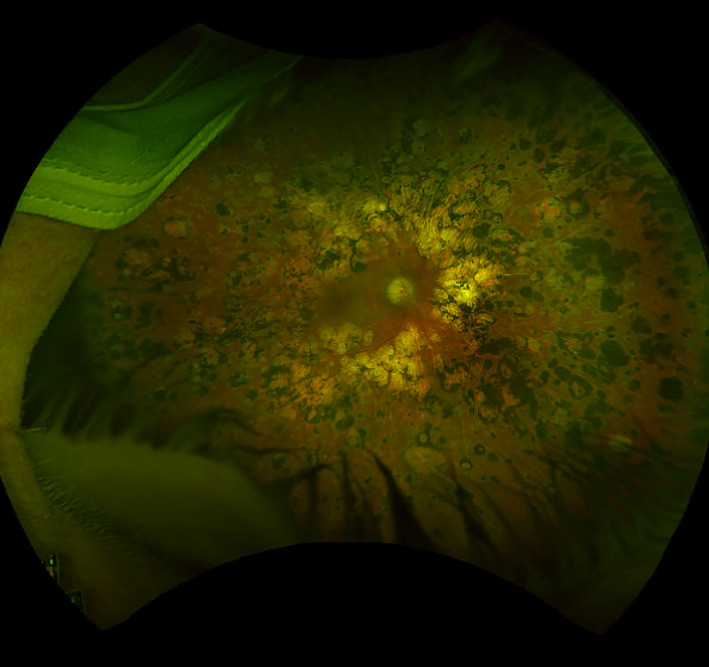
Ultra‐widefield (UWF) colour fundus photograph (CFP) of a right eye with proliferative diabetic retinopathy (PDR) that was previously treated with scatter panretinal photocoagulation. The photocoagulation scars are well visualised to the periphery of the fundus. Of note, lid and lash artefacts are evident inferiorly and patient's mask can also be seen superotemporally. Image was obtained using the Silverstone (Optos Plc, Dunfermline, Scotland, UK)
FIGURE 4.
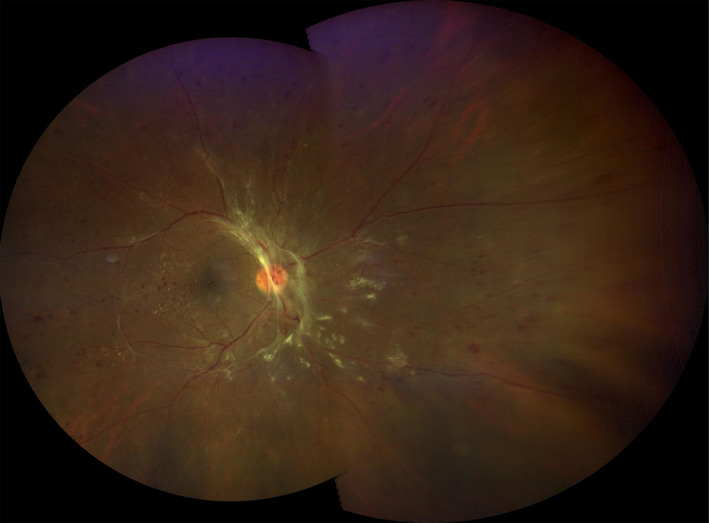
A montage image of an eye with proliferative diabetic retinopathy was created from two widefield (133°) images yielding an ultra‐widefield (UWF) view. Of note, there is a shadow at the superior boundary where the images overlap. Some distortion of the periphery is observed. The image was obtained using the Zeiss Clarus 500 (Carl Zeiss Meditec, Dublin, CA)
Agreement in DR severity grading between ETDRS 7‐standard field images and UWF CFP was evaluated in several studies: the perfect agreement (exactly matched) was 48.4%–84% and agreement within 1‐level was 88%–100%. 15 , 16 , 17 , 18 , 19 Of note, ~40% of eyes had DR lesions outside the ETDRS fields and 9%–15% of UWF CFP led to detection of a more severe DR level than was seen on ETDRS 7‐standard field image or overlaid ETDRS 7‐standard field on UWF CFP. 16 , 17 , 19 , 20 NPDR Eyes with predominantly peripheral lesions (PPLs; defined as any DR lesion type that was present predominantly in any peripheral field outside the ETDRS 7‐standard fields) were also shown to have 3.2‐fold increased risk of 2‐step or more DR progression (11% vs. 34%; p = 0.005) and a 4.7‐fold increased risk for progression to PDR (6% vs. 25%; p = 0.005) over 4 years compared with eyes without PPLs. 21 The degree or extent of PPLs was also associated with the increased risk for two‐step or more DR progression (p = 0.004) and progression to PDR (p = 0.009). 21
In addition to the general limitations associated with conventional CFP (e.g., media opacities seen in Figure 2), the limitations of WF and UWF imaging include lid lash artefacts (Figure 3), pseudocolor (Optos Plc; Figure 3), distortion of features in the periphery caused by the spherical shape of the globe (Figure 4), lack of absolute agreement with ETDRS 7‐standard field image, need for grading experience and expensive equipment costs.
2.2. Optical coherence tomography
With its ability to provide non‐invasive high‐resolution cross‐sectional imaging of the retina, optical coherence tomography (OCT) has revolutionised the diagnosis and management of many retinal diseases, including DR. DMO in particular, is well‐evaluated by OCT (Figure 5). While stereoscopic viewing of CFP and slit‐lamp biomicroscopic examination are subjective assessments requiring individual experience, OCT provides a quantitative, qualitative, reproducible and more sensitive assessment of DMO. 22 A number of landmark clinical trials have used retinal thickness measured on OCT for the diagnosis of centre‐involved DMO (CI‐DMO), which is the new standard for treatment‐decision making in eyes with DMO. 23 , 24 , 25 Notably, in Diabetic Retinopathy Clinical Research Retina Network (DRCR.net) trials, CI‐DMO on OCT was defined by central subfield thickness (CST) on OCT >250 μm on Zeiss Stratus (Carl Zeiss Meditec) or the equivalent on spectral‐domain OCTs (SD‐OCT) based on gender‐specific cutoffs. 5 Changes of CST of 10% or more (improvement or worsening) were also considered to be one of the criteria for treatment‐decision making in the protocol. 23 It should be noted, however, that changes in CST or retinal thickness after treatment with anti‐VEGF were not well correlated with changes in visual acuity (VA) and thus may not be useful to predict the visual outcomes. 26 , 27 , 28
FIGURE 5.
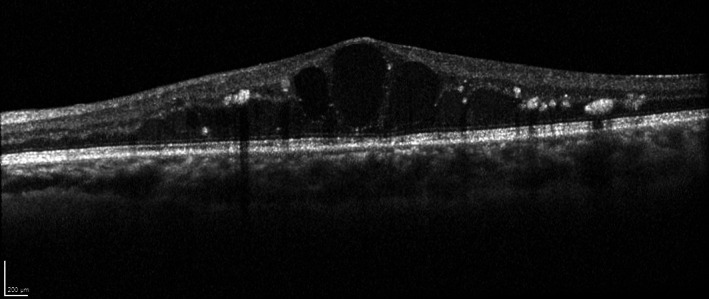
Spectral‐domain optical coherence tomography (SD‐OCT) B‐scan of a left eye with centre‐involved diabetic macular oedema (CI‐DMO). Intraretinal cystoid spaces, intraretinal fluid and hyperreflective foci are observed and the central subfield thickness was measured to be 560 μm. Image was obtained with the HRA + OCT (Heidelberg Engineering, Heidelberg, Germany)
A number of morphologic patterns of DMO on OCT were also described including diffuse retinal thickening (DRT), cystoid macular oedema (CME; Figure 5), posterior hyaloidal traction (PHT), serous retinal detachment (SRD), and traction retinal detachment (TRD), where patterns with CME (p = 0.01) or PHT without TRD (p = 0.02) were significantly associated with worse vision. 29 In addition to CME, other OCT features reported as biomarkers for negative visual prognosis or treatment response include disorganisation of retinal inner layers (DRIL; Figure 6), disruption of external limiting membrane (ELM) and loss of ellipsoid layer. 29 , 30 , 31 , 32
FIGURE 6.

OCT B‐scan of the diabetic macular oedema (DMO) eye following anti‐vascular endothelial growth factor (VEGF) treatment. Although the DMO is improved, the ganglion cell layer–inner plexiform layer complex, inner nuclear layer, and outer plexiform layer are more difficult to distinguish in central fovea region (yellow rectangle). This finding is compatible with disorganisation of retinal inner layers (DRIL). Image was obtained with the Spectralis HRA + OCT (Heidelberg Engineering, Heidelberg, Germany)
DRIL, which is defined as an inability to distinguish between the ganglion cell layer–inner plexiform layer complex, inner nuclear layer, and outer plexiform layer on OCT (Figure 6) is a reversible feature, which can be observed in the presence of DMO or after DMO resolution. A primary study of DRIL in the central 1‐mm foveal area of 120 diabetic eyes with CI‐DMO reported a correlation between greater DRIL extent at baseline and worse baseline VA (point estimate, 0.04; 95% CI, 0.02–0.05 per 100 μm; p < 0.001) and the association between increasing DRIL through 4 months with VA worsening at 8 months (point estimate, 0.03; 95% CI, 0.02–0.05 per 100 μm; p < 0.001). 30
Another study reported that the eyes with CI‐DMO resolution but persistent DRIL had the largest difference in VA deficit compared with those without DRIL at baseline over an 8‐month period (least square mean VA [SE], −89.6 [27.2] vs. 49.7 [19.6]; p = 0.006). 32 DRIL was also identified in 84.4% of non‐perfused maculae and none in perfused maculae. 33 Thus, DRIL appears to be a valuable OCT biomarker in predicting the visual outcomes and perfusion status.
Retinal hyperreflective foci (HRF), another OCT feature, were also reported as a potential biomarker in predicting visual outcome in various retinal diseases including DMO. 34 HRF appear as small discrete, well‐circumscribed dots, with reflectivity equal or greater than the retinal pigment epithelium (RPE) band on SD‐OCT. Hard exudates, lipid‐laden macrophages, photoreceptor cellular debris, and migrated RPE cells are all potential explanations for these HRF. In a cross‐sectional study of DMO, VA was significantly worse (p < 0.0001) in eyes with HRF in the outer retinal layers compared with eyes without them (logMAR, 0.463 ± 0.382 vs. 0.127 ± 0.206, respectively). The presence of HRF in the outer retina was also associated with disruption of external limiting membrane (ELM) and disruption of the junction of the inner and outer segment (IS/OS; now termed ellipsoid zone) (p < 0.0001 for both comparisons). 35 In longitudinal studies, eyes with preoperative HRF in the outer retinal layers had IS/OS loss (p = 0.004) and worse logMAR VA (p < 0.001) than eyes without HRF after vitrectomy. 36 However, the predictive value of HRF across studies has been inconsistent, which may be related to the use of various treatments and non‐uniform methods for assessing HRF. Overall, a systematic review of 36 studies reported that HRF numbers decreased with treatment, but it was not clear whether HRF could actually predict the visual outcome in DMO. 37
2.3. Fundus autofluorescence
Fundus autofluorescence (FAF) is another planar imaging technology which is commonly incorporated into fundus cameras or OCT machines. Short‐wavelength FAF signal is mostly derived from lipofuscin in RPE while long‐wavelength FAF (or near‐infrared; NIR) signal primarily originates from melanin in the RPE and choroid. 9 Various patterns of DMO on FAF have been reported including single spot, multiple spots, cystoid or mosaic patterns (Figure 7). 38 , 39 In a prior report, increased FAF was observed in most DMO eyes (76.8%) and the increased FAF region was associated with decreased macular sensitivity (11.5 ± 5.3 dB vs. 15.1 ± 3.9 dB in normal areas; p < 0.005). Moreover, the cystoid pattern seen on OCT and the leakage patterns seen on FA were correlated with the presence of increased FAF (p < 0.0001). 38 With NIR‐FAF, relative fluorescence intensity in the central subfield (CSF) was negatively correlated with the CST (R = 0.492; p < 0.001) and VA (R = 0.377; p < 0.001). A mosaic pattern in the NIR‐FAF was associated with worse logMAR VA (0.355 ± 0.239 vs. 0.212 ± 0.235; p = 0.001), a thicker CSF (530 ± 143 μm vs. 438 ± 105 μm; p < 0.001), and a disrupted ELM (p < 0.001) compared with eyes without this finding. In addition, eyes with a cystoid pattern on NIR‐FAF had worse logMAR VA (0.393 ± 0.233 vs. 0.221 ± 0.234; p < 0.001) and a thicker CSF (557 ± 155 μm vs. 443 ± 100 μm; p < 0.001) than those without this pattern. 39
FIGURE 7.
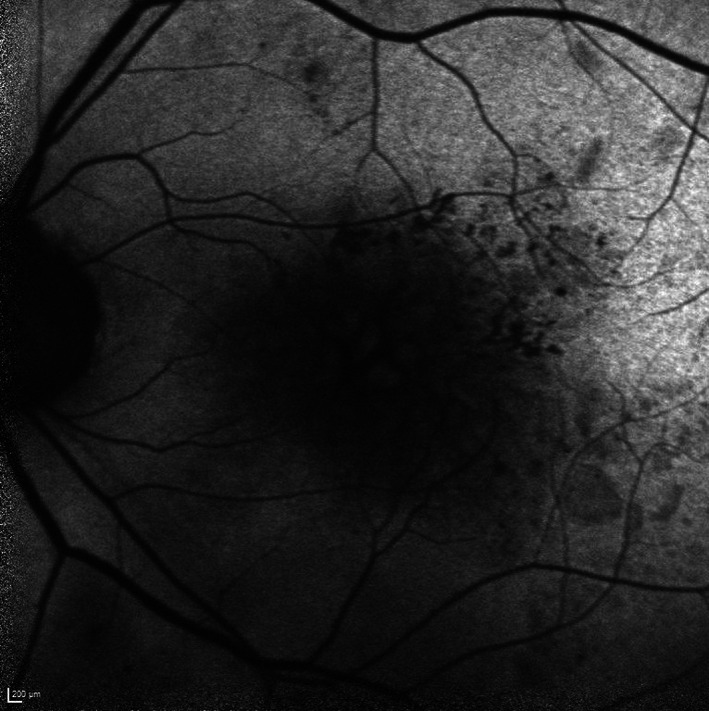
Short wavelength (blue) fundus autofluorescence (FAF) image of a left eye with diabetic macular oedema (DMO) in a cystoid pattern. Faint hyperfluorescence can be observed from the cystoid spaces relative to the hypofluoresence from the septae between the cystoid spaces. Image was obtained using a confocal scanning laser ophthalmoscopy (cSLO) device, from the HRA (Heidelberg Engineering, Heidelberg, Germany)
Despite these apparent clinically important attributes of FAF in the setting of DR/DMO, there are several important limitations. First, the signal strength of FAF is not as strong as the fluorescent signal seen in FFA. Fluorescent properties of other structures (e.g., crystalline lens) and media opacities may influence and affect the fluorescent intensity originating from RPE and choroid, though the confocal attributes of the imaging devices confocal scanning laser ophthalmoscope (cSLO) instruments such as the Heidelberg Retina Angiograph (HRA), HRA 2 and HRA Spectralis (Heidelberg Engineering, Heidelberg, Germany), can partially mitigate this concern (Figure 7). 40
The confocal methods diminish extra light by focusing and detecting reflected light through a small confocal aperture (or pinhole) which is positioned at a focal plane conjugate to the retina in front of the image detector. 41 The aperture blocks non‐image‐forming light and minimises scatter and aberrations. The cSLO then enables imaging of selected individual layers of the retina with greater contrast and details. However, with variability in image acquisition settings (e.g., illumination intensity and detector sensitivity), patient factors (e.g., background AF which may vary with age or level of dilation), and difficulties in interpretating FAF images without significant training and experience, significant challenges remain for the routine use of FAF imaging in this setting.
2.4. Ultrasonography
By using inaudible sound waves (>20 kHz), piezoelectric crystals in ultrasonography instruments collect reflected sound waves from any echodense which can be displayed a 2D B‐scan image. Ultrasonography has proven to be a useful tool for assessment of PDR with TRD, especially in the context of a vitreous haemorrhage precluding visualisation of the retina on ophthalmoscopy (Figure 8). In a study evaluating for the presence of a TRD in eyes with PDR and an obscuring vitreous haemorrhage, on 4‐quadrant transverse and 1‐quadrant longitudinal ultrasound scans reported a preoperative sensitivity of 72.4% and a specificity of 96.6% for detection of TRD. 42 In another study, ultrasonography was rated to have 100% sensitivity and 100% specificity for detection of vitreous haemorrhage, pre‐retinal haemorrhage and posterior vitreous detachment in diabetes with a sensitivity of 87.5% and a specificity of 100% specificity for detecting TRD. 43 Cases in which the TRD was missed were suspected to be due to peripheral location, small size of the TRD, or a focal TRD with dense subhyaloid bleeding. 42 , 43
FIGURE 8.
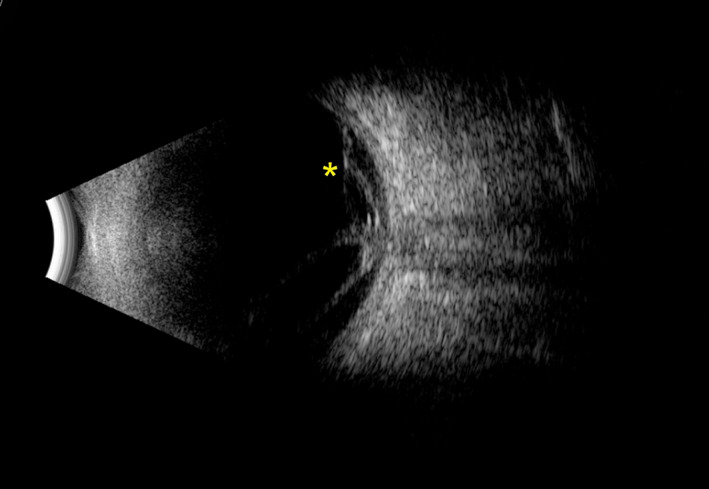
Ultrasonography B‐scan image of a right eye with proliferative diabetic retinopathy (PDR) and tractional retinal detachment (TRD). A fibrovascular membrane (appearing as hyperechoic strands) covered the optic disk, and tracked along the retina superiorly (yellow asterisk) and inferiorly (not captured in the image). Image was obtained using the Absolu device (Quantel Medical, Cournon‐d'Auvergne, France)
3. DYNAMIC AND FUNCTIONAL RETINAL IMAGING TECHNOLOGIES
3.1. Fundus fluorescein angiography and ultra‐widefield imaging
Fundus fluorescein angiography (FFA) has been used as a companion diagnostic procedure along with CFP for many decades. As FFA provides high contrast visualisation of retinal vessels, it has been the gold standard for evaluation of the retinal vasculature and can be used to image MAs, IRMA, NV and perhaps most importantly, the vascular perfusion and leakage in DR. 44
Normally, the retinal vascular endothelium acts as a blood‐retinal barrier preventing escape of dye from within the vessels into the extravascular space. However, this barrier is compromised in MA and NV and results in dye leakage seen on FFA (Figures 9 and 10). The presence or severity of leakage may aid in the differentiation between IRMAs and NV, or tiny retinal haemorrhage and MAs which may be hard to distinguish on CFP or slit‐lamp examination. 44 Moreover, FFA can help to differentiate the pattern of DMO as either diffuse (e.g., originating from telangiectatic capillaries) or focal leakage (e.g., originating from MAs), and also to localise MAs to guide focal laser treatment for DMO, when needed. 4
FIGURE 9.
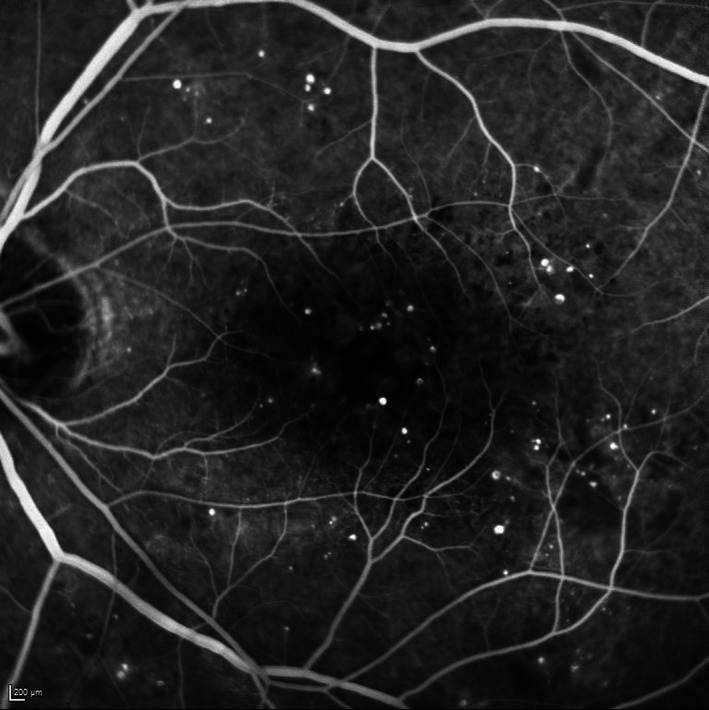
Late transit fundus fluorescein angiography (FFA) image of a left eye with moderate nonproliferative diabetic retinopathy (NPDR) and diabetic macular oedema (DMO). Numerous microaneurysms (MAs) are observed in the early phase with some surrounding greyish haze already evident consistent with early leakage like contributing to the DMO in this case. The image was obtained using the HRA (Heidelberg Engineering, Heidelberg, Germany)
FIGURE 10.
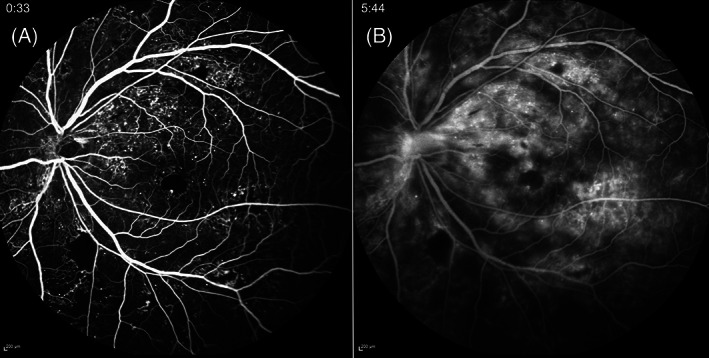
Widefield (WF) fundus fluorescein angiography (FFA) of a left eye with proliferative diabetic retinopathy. Numerous microaneurysms (MAs), neovascularization elsewhere (NVE), neovascularization of the disc (NVD), capillary nonperfusion (CNP) and an irregular foveal avascular zone (FAZ) are observed in early phase of FFA (A). In the late phase (B), the leakage from MAs, NVE and NVD is profound. The images were obtained using the Spectralis HRA + OCT (Heidelberg Engineering, Heidelberg, Germany)
As a result of chronic endothelial cell damage and vascular injury, small vessel occlusion can occur in DR, and these areas of capillary nonperfusion (CNP) can be well‐visualised on FFA (Figure 10A). 45 , 46 CNP in the midperipheral region was reported to be the most common location for this abnormality in NPDR eyes and a positive correlation was observed between the initial site of CNP and its progression in eyes with NPDR. 47 DMI is identified by the presence of an enlarged and irregular foveal avascular zone (FAZ) and CNP within the paramacular area on FFA. 48 , 49 , 50 Prior study showed that DMO eyes (treated with intravitreal anti‐VEGF injections) with DMI significantly more frequently progressed to PDR at 24 months compared with those without DMI at baseline (HR, 2.42; 95% CI, 1.30–4.49; p = 0.0052). 51 DMI progression itself, ranging from 5% to 10% of baseline FAZ area per year, was also reported as an independent predictive factor for VA loss (odds ratios, 4.60; 95% CI, 1.54–13.7, p = 0.03). 52
Similar to conventional CFP, conventional FFA images typically cover a 30–55° field of view in a single frame (Figure 9). Unlike static CFP images, where multiple images and a montage may be compiled without loss of information, because of the dynamic and changing nature of FFA, montage FFA images are invariably composed of images obtained at different time points. WF FFA (Figure 10) and UWF FFA technologies overcome this significant problem, providing a wider field of view of up to 200° in a single frame (e.g., Optos 200Tx [Optos Plc]). Retinal CNP, NV and other lesions (e.g., photocoagulation scar) in the periphery were better revealed on UWF than conventional FFA. 53 , 54 In one study, UWF FFA demonstrated 3.2 times more total retinal surface area, 3.9 times more CNP (p < 0.001), 1.9 times more NV (p = 0.036), and 3.8 times more panretinal photocoagulation scars (p < 0.001) than within the ETDRS 7‐standard fields. 54 Moreover, in 10% of eyes, UWF FFA demonstrated retinal pathology (including CNP and NV) not evident within the ETDRS 7‐standard fields. 54 CNP area seen on UWF FFA and non‐perfusion index are also correlated with the presence of PPLs, DR severity, and potentially DR progression. 55 Peripheral CNP was also reported to have a significant correlation with DMO (p < 0.001). 56 However, it remains unclear whether the extent of peripheral CNP is correlated with DMI (R = 0.49; p = 0.0001). 57
Despite the wealth of information provided by FFA, it is not without limitations. FFA is an invasive imaging technique which requires intravenous injection of fluorescein dye. FFA imaging may be contraindicated for patients with renal disease, pregnancy or dye allergies. Several risks and complications associated with fluorescein dye injections have been reported including, nausea, vomiting, itching, urticaria and rarely, anaphylaxis. 58 In addition, unlike OCT which may be acquired by operators with relatively limited training, FFA may require an experienced photographer or technician, and because of the dynamic nature of study, timing is critical and high‐quality images need to be obtained from the outset. Another important limitation of standard FFA is its limited depth resolution (even with stereoscopic acquisition) which makes it difficult to distinguish superficial and deeper vascular plexi. 59
3.2. Optical coherence tomography angiography and widefield imaging
Optical coherence tomography angiography (OCTA) is a relatively new and non‐invasive technology. OCTA allows depth‐resolved visualisation of the retinal microvasculature without fluorescein dye injection. The detection of blood flow by OCTA is based on motion contrast for moving objects, which in this case is primarily the movement of red blood cells in the intravascular space. 59 Earlier studies reported a visualisation of MA, NV and CNP on OCTA similar to FFA images. 60 , 61 , 62 MAs were identified as focally dilated saccular or fusiform capillaries at the superficial and/or deep plexus with variable internal reflectivity, and the CNP area was observed as a region with no or sparse capillaries (capillary dropout) on OCTA (Figures 11 and 12). 60 , 63 , 64 The study in rotational 3D OCTA also showed that most MAs associated with two vessels and occupied at least two retinal layers which inner nuclear layer was the most frequently occupied, similarly to histological findings. 64 The greatest agreement between FFA and OCTA was found in CNP area while the least was found in intraretinal fluid and microaneurysms. 62 The intraretinal fluid with hyporeflectivity on SD‐OCT was not seen on OCTA at all, and fewer MAs were observed on OCTA compared with FFA which was hypothesized to be due to the diffusion of small fluorescein molecules into partially sclerosed MAs making them visible on FFA, but the absence of red blood cell flow into these lesions rendering them undetectable by OCTA. 62 OCTA detected enlargement and distortion of FAZ and better defined areas of capillary loss which were otherwise obscured by fluorescein leakage on FFA. 61
FIGURE 11.
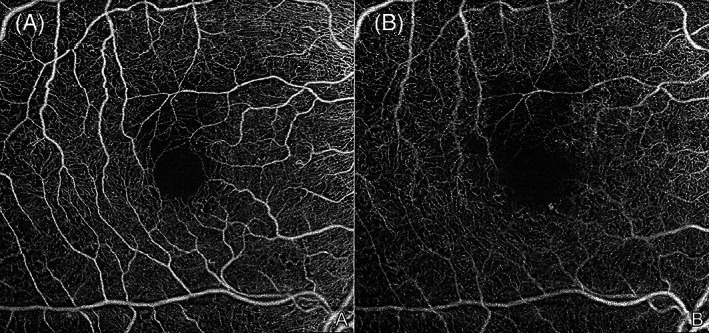
6 × 6 mm en face optical coherence tomography angiography (OCTA) images of a right eye with mild nonproliferative diabetic retinopathy (NPDR). Microaneurysms (MAs), an enlarged and irregular foveal avascular zone, and some small regions of capillary dropout area are observed in the superficial (A) and deep (B) capillary plexuses. Of note, projection artefacts from the superficial vessels are seen on the deep plexus image (B) as the projection removal was not employed. The images were obtained using the PLEX Elite 9000 (Carl Zeiss Meditec, Dublin, CA)
FIGURE 12.
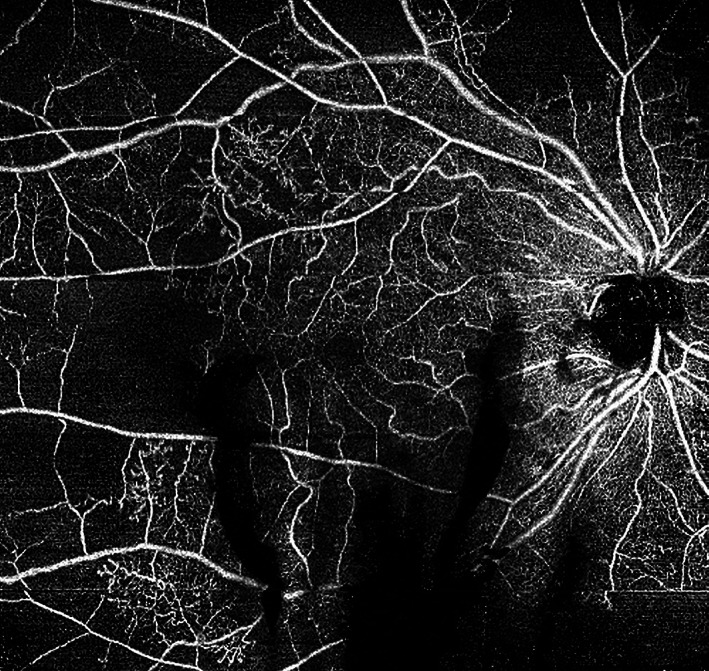
12 × 12 mm en face optical coherence tomography angiography (OCTA) of a right eye with proliferative diabetic retinopathy (PDR). Microaneurysms (MAs), intraretinal microvascular anomalies (IRMAs) and numerous areas of capillary dropout are observed in superficial plexus of right eye. Of note, shadow artefacts from vitreous haemorrhage obscure some areas of the OCTA en face image inferiorly. A horizontal motion artefact line is evident near the lower right corner of the image. The images were obtained using the PLEX Elite 9000 (Carl Zeiss Meditec, Dublin, CA)
Moreover, small NV could be clearly differentiated from IRMA by OCTA imaging, as small tufts of NV would extend above the inner limiting membrane on cross‐sectional structural OCT scans, whereas IRMA would remain intraretinal. 61 , 63 Vascular density (VD) and other perfusion‐related indices can be generated from OCTA images and have been used in a number of studies of DR and DMO. 65 , 66 , 67 , 68 For example, a recent study demonstrated that the VD of each of the individual layers (superficial, intermediate and deep vascular plexuses) decreased with increasing DR severity, though the level of DR severity had a substantially different effect on OCTA parameters within each layer. 67 Vascular changes in eyes with no to early DR were present primarily in the deeper vascular layers, whereas the opposite was observed in eyes with advanced DR. 67 In eyes with DMO, larger FAZ, FAZ contour irregularity, and greater vessel calibre and vessel tortuosity were seen on OCTA, along with lower VD, compared with normal eyes (p < 0.001 for all parameters). 65 DMO eyes which poorly respond to anti‐VEGF treatment also showed greater damage to the deep capillary plexus and a larger FAZ (p < 0.001), compared with good responders. 69
Initial OCTA instrumentation and acquisition software focused on high‐resolution imaging of the central macula (e.g., 3 × 3 mm or 6 × 6 mm patterns centred on the fovea), but subsequent iterations have offered increasingly large patterns and faster scanning speeds. Using a montage approach, ‘widefield’ OCTA is now feasible. A montage of only two 15 × 9 mm swept‐source OCTA (SS‐OCTA) scans (yielding a 15 × 15 mm image which approximates a 50° field of view) was shown to be superior for detecting IRMAs (p < 0.001) and NV (p = 0.007) compared with UWF CFP, and comparable with UWF FFA in detecting MA, IRMA, NV and CNP area (p > 0.05). 70 A combination of WF SS‐OCTA and UWF CFP can detect these DR lesions with similar efficiency as UWF FFA (p > 0.005), and as such this combination may offer a non‐invasive alternative to FFA in DR grading. 70 This may be particularly relevant in light of DRCR.net Protocol AA results. WF OCTA has also been used to evaluate retinal perfusion in PDR after treatment with panretinal photocoagulation or intravitreal anti‐VEGF injection, and no significant changes were found after treatment with either approach. 71 , 72 A recent study also highlighted the benefit of cross‐sectional WF OCTA B‐scans and showed that evidence of NV that traversed the posterior hyaloid face into the vitreous in eyes with PDR was associated with a higher rate of vitreous haemorrhage (odds ratio, 5.42; 95% CI, 1.26–35.16; p = 0.02) compared with flat NV that was confined to the posterior hyaloid space (odds ratio, 0.25; 95% CI, 0.04–1.01; p = 0.05). 73
Although OCTA provides retinal structural detail and information regarding perfusion, it currently does not demonstrate leakage, blood flow velocity or transit time which can be obtained from FFA imaging. Image artefacts (Figures 11 and 12), limited field of view (far less than the 200° achievable by UWF FFA), longer image acquisition time, lack of interoperability between OCTA devices, difficulty in interpretation, and cost and lack of broad availability of OCTA devices, may still limit the current application of OCTA in general clinical practice. 59 , 74
4. ADVANCES AND NOVEL TECHNOLOGIES IN RETINAL IMAGING
4.1. Fluorescence lifetime imaging ophthalmoscopy
Fluorescence lifetime imaging ophthalmoscopy (FLIO) is a novel non‐invasive imaging technology which may provide additional contrast to discriminate fluorophores in the eye compared to conventional FAF. Following excitation by the laser, FLIO measures the average amount of time that fluorophore remains in the excited state, known as the FLIO lifetime (FLT) or decay time, and difference in lifetime may aid discrimination of the status of various diseases. 75 , 76 A prototype FLIO device for clinical research use is available from Heidelberg Engineering primarily utilised a 30° field of view. 76 Early studies have shown that FLTs are prolonged in the eyes of diabetic patients without DR, eyes with NPDR, and eyes with PDR compared to healthy controls (Figure 13). 77 , 78 , 79 One study showed that the prolongation especially occurred in the superior‐temporal area, and seemed distinct from the patterns described for age‐related macular degeneration. FLTs in these areas were 300–400 ps, which were approximately 100 ps longer than corresponding areas in healthy controls. 79 The formation and accumulation of advanced glycation end products in neurons, glial cells and vascular cells in diabetes were hypothesized to be a cause of FLT prolongation in these cases. 77 , 78 These studies suggest the potential for early detection of metabolic changes in DR seen using FLIO prior to signs of overt clinical disease. 76
FIGURE 13.
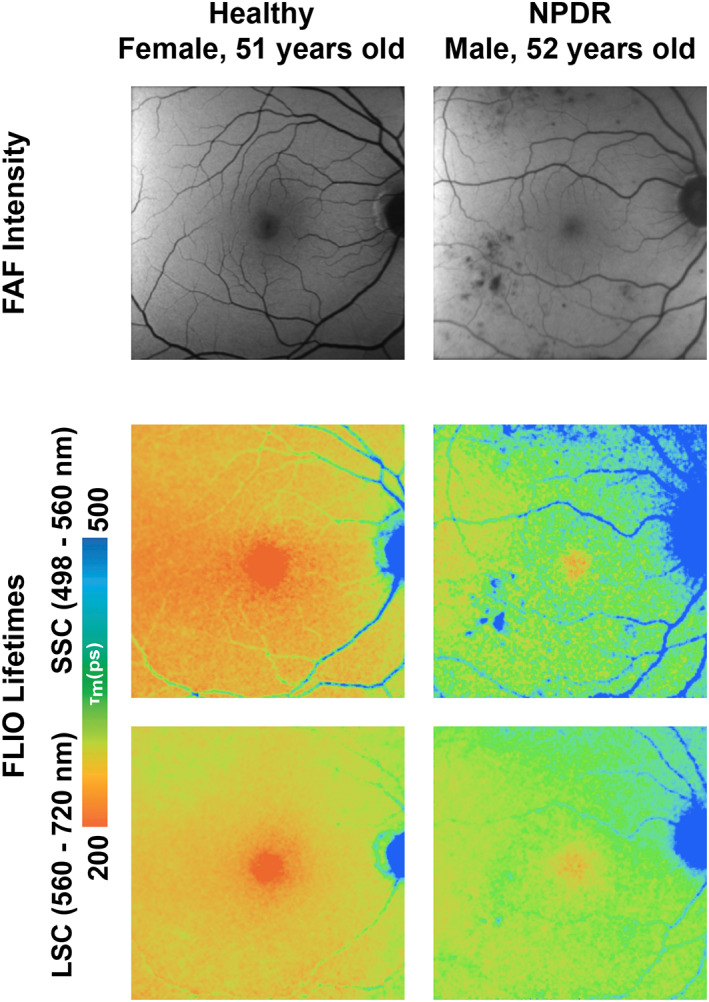
Fundus autofluorescence (FAF) intensity (top row) and fluorescence lifetime imaging ophthalmoscopy (FLIO) lifetime images of the right macula of a healthy subject (left column) and a non‐proliferative diabetic retinopathy (NPDR) patient (right column), showing both the FLIO short‐wavelength spectral channel (SSC, 498–560 nm, middle row) and the FLIO long‐wavelength spectral channel (LSC, 560–720, bottom row). FLIO imaging showed prolongations of fluorescence lifetimes in the NPDR eye compared with the healthy control. Image courtesy of Dr. Lydia Sauer, Moran Eye Center, University of Utah School of Medicine, Salt Lake City, Utah
4.2. Retinal oximetry and hyperspectral imaging
As a critical function of the retinal and choroidal vasculature is delivery of oxygen to the retina, non‐invasive assessment of retinal oxygenation has been an area of considerable interest. The basic principle underlying current oximetry techniques is based on the distinct optical properties of oxygenated and deoxygenated haemoglobin, each of which absorbs different amounts of light at different wavelengths. By exciting the retina with two or more different wavelengths and measuring the reflected light from blood vessels and outside vessels, the optical density and its ratio can be computed. 80 , 81 An example of a currently available commercial device is the Oxymap T1 (Oxymap ehf, Reykjavik, Iceland) which generates a fundus photograph with a measurement of the oxygen saturation within each artery and vein displayed using a colour scale. 82 Using oximetry testing, the retinal vessel oxygen saturation in DR eyes was shown to be significantly higher than in healthy controls. 83 , 84 , 85 Possible explanations for this finding was arterio‐venous shunting due to bypass of non‐perfused capillaries. Thus, because of the loss of the capillary circulation, some regions of retinal tissue may be hypoxic, despite a high oxygen saturation in the larger blood vessels. 83 Retinal oximetry, however, is not without limitations as the fundus camera only provides 2D images and fundus pigmentation and vessel size may affect the accuracy of oxygen saturation measurements requiring an additional corrective algorithm. 80 Newer imaging techniques that are still under earlier stages of development such as photoacoustic ophthalmoscopy, visible light OCT, and hyperspectral imaging (HSI) may address some of these limiations. 80
For example, HSI is a spectral imaging technique which collects data from a contiguous spectrum of wavelengths of light reflected by the retina in every pixel of an image plane. 86 This technique provides a higher spectral resolution compared with multispectral imaging that captures only specific wavelengths such as red, green and blue in conventional CFP. 86 As the various structures and molecules in the retina have different reflective properties, HSI provides more‐detailed information regarding these structures and is less influenced by vessel thickness. 80 , 86 One study reported the mean oxygen tensions in the artery and vein measured by HSI in diabetic patients were lower than normal subjects (p = 0.001). 29 For PDR eyes in particular, the arterial oxygen level was significantly lower (85 ± 4%) while the venous oxygen level was significantly higher (71 ± 4%) than the other groups (p = 0.04), which led to significant arteriovenous difference between PDR and healthy controls (14% vs. 26%; p = 0.003). 87 Another study of HSI in mild to moderate NPDR showed a contrary results where the mean retinal arterial and venular oxygen saturations were higher in NPDR eyes compared with healthy controls (94.7 ± 2.4% vs. 92.9 ± 1.6%, p = 0.02; 62.5 ± 5.7% vs. 56.3 ± 4.7%, p = 0.003; artery and vein, respectively), and the arteriovenous difference was significant between the NPDR group and controls (30.6 ± 6% vs. 36.7 ± 5.3%, p = 0.008). 88 Further larger and longitudinal studies are required to better clarify these relationships. Limitations of HSI include long acquisition and analysis times. 80
4.3. Adaptive optics
Adaptive optics (AO) is an imaging technique to improve the transverse resolution of optical imaging systems by reducing the effect of ocular aberrations and resultant wavefront distortion. AO has been developed and implemented in a variety of imaging systems including flood‐illumination ophthalmoscopy (FIO), scanning laser ophthalmoscopy (SLO) and OCT. When combining AO with these imaging techniques, the higher transverse resolution offers better visualisation of a small features including individual cells. 89 To put this into context, adaptive optics scanning laser ophthalmoscopy (AO‐SLO; Figure 14) provides up to 2.5 μm transverse resolution compared to a resolution of only 20 μm for a conventional fundus camera. 89 , 90 When applying AO to OCT (adaptive optics OCT or AO‐OCT), it is possible to achieve isotropic resolution with 2 μm resolution in all dimensions. 91
FIGURE 14.
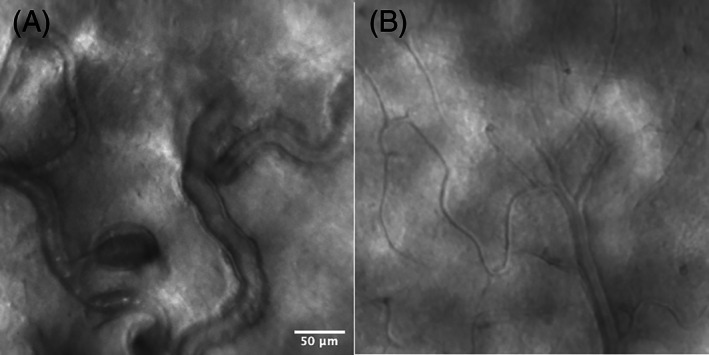
Adaptive optics scanning laser ophthalmoscopy (AO‐SLO) images of a diabetic retinopathy (DR) eye (A) and a healthy eye (B). In the DR eye (A), the capillaries are dilated and beaded with stagnation of blood cells and microaneurysm formation, in contrast to the healthy eye (B) in which the capillaries are of normal calibre and stagnation of blood cell is not observed. Image courtesy of Dr. Shin Kadomoto, Kyoto University Graduate School of Medicine, Kyoto, Japan
A study of AO‐SLO compared with conventional OCT in NPDR showed improved visualisation of various retinal features including retinal vessels in the inner retinal layers, extensive capillary remodelling despite mild or moderate NPDR, clinically undetected intraretinal vessel remodelling and varying blood flow patterns, and regions of bright cones and dark regions in the photoreceptor layer with dark regions corresponding to areas of overlying vascular remodelling. 92 Compared with healthy controls, perifoveal capillary diameters were larger (p < 0.01) and small arteriolar walls were thicker (p < 0.05). 92
4.4. Smartphone‐based fundus camera
With the increasing need to provide accessible DR screening to as broad a population as possible, smartphone‐based fundus imaging has gained increasing interest given its low cost, portability, convenience and lack of need for intensive training. 93 Smartphone‐based fundus photography has been used over the last decade for screening and monitoring of various eye diseases including DR, and has become a part of the teleophthalmology model. 94 , 95 , 96 A smartphone‐based fundus camera can even be self‐assembled by the consumer using a smartphone with the device‐installed camera application (app), a condensing lens (20D), reducer base, polyvinyl chloride (PVC) pipes, and adhesive. 97 A video of the fundus can be captured, the image frames can later be edited or enhanced as needed using commercial software. 97 A meta‐analysis from nine studies (1430 participants) of DR identifications using smartphone cameras with various attachments and companion artificial intelligence (AI) tools for obtaining and grading of the retinal images showed that the pooled sensitivity and specificity for detecting any DR, compared with the reference standard (e.g., indirect ophthalmoscopy, slit‐lamp biomicroscopy and CFP), were 87% (95% CI, 74%–94%) and 94% (95% CI, 81%–98%), respectively. 98 Mild NPDR had the lowest diagnostic accuracy [39% sensitivity (95% CI, 10%–79%) and 95% specificity (95% CI, 91%–98%)] and PDR was the highest [92% sensitivity (95% CI, 79%–97%) and 99% specificity (95% CI, 96%–99%)]. DMO had 79% sensitivity (95% CI, 63%–89%) and 93% specificity (95% CI, 82%–97%). Referral‐warranted DR had 91% sensitivity (95% CI, 86%–94%) and 89% specificity (95% CI, 56%–98%). The overall diagnostic odds ratio ranged from 11.3 to 1225. 98
4.5. AI and innovative software
AI approaches to automatically assess retinal images (at present, primarily CFPs) for referral warranted retinopathy are poised to play a significant role in the DR screening model going forward. AI algorithms have already shown the potential to replace human graders (at least partially) while providing a similar level of accuracy but better cost‐effectiveness. 99 , 100 , 101 Two fully‐autonomous AI‐based DR screening tools or algorithms have been FDA‐cleared and are commercially available (EyeArt [Eyenuk Inc., CA, USA] and IDx‐DR [Digital Diagnostics Inc., IA, USA]). 99 Many more such tools are Conformitè Europëenne (CE) marked in the European Union. A recent study showed that the implementation of AI (EyeArt, Eyenuk) into a DR screening paradigm with CFP obtained in a primary care clinic serving a low‐income patient, improved adherence to follow‐up eye care recommendations while reducing referrals for patients with low‐risk features. 102
AI has applications well‐beyond screening and may provide enhanced image processing. For example, consistent high image quality is a challenge for OCTA imaging, but one study found that AI could be used to denoise the OCTA image without the need for image averaging allowing shorter acquisition times (acquisition times for the original, averaged, and AI‐denoised images: 31.87 ± 12.02, 165.34 ± 41.91 and 34.37 ± 12.02 s, respectively). Both subjective and quantitative evaluations showed that AI‐denoised OCTA images had less background noise and depicted vessels more clearly. 103
5. CONCLUSION
In summary, retinal imaging is a key component in the diagnosis and management of patients with DR. While conventional CFPs are the historical good standard tool for assessment of DR, and have been used for decades in clinical trials, the widefield imaging approaches and OCT are the current centrepieces for clinical retinal imaging in DR. A multimodal imaging approach is key, however, as various imaging modalities including dye‐based fluorescein and OCT angiography may provide complementary clinically‐important information. The role of imaging can be expected to expand in the future with novel approaches such as HSI and FLIO in development.
FUNDING INFORMATION
None.
CONFLICT OF INTEREST
Onnisa Nanegrungsunk: Recipient: Novartis; Direk Patikulsila: Recipient: Alcon, Allergan, Bayer, Novartis, Roche, TRB Chemedica; Srinivas R. Sadda: Consultant: Amgen, Apellis, Iveric, Abbvie/Allergan, Roche/Genentech, Novartis, Oxurion, Regeneron, 4dMT, Astellas, Nanoscope, Centervue, Heidelberg, Optos. Research Instruments from: Centervue, Heidelberg, Optos, Nidek, Carl Zeiss Meditec, Optos.
ACKNOWLEDGEMENTS
We would like to thank Dr. Lydia Sauer (Moran Eye Center, University of Utah School of Medicine, Salt Lake City, Utah, USA) and Dr. Shin Kadomoto (Department of Ophthalmology and Visual Sciences, Kyoto University Graduate School of Medicine, Kyoto, Japan) for providing the original FLIO (Figure 13) and AO‐SLO images (Figure 14), respectively.
Nanegrungsunk O, Patikulsila D, Sadda SR. Ophthalmic imaging in diabetic retinopathy: A review. Clin Experiment Ophthalmol. 2022;50(9):1082‐1096. doi: 10.1111/ceo.14170
REFERENCES
- 1. World Health Organization . Diabetes. World Health Organization; 2021. Accessed May 6, 2022 https://www.who.int/news-room/fact-sheets/detail/diabetes [Google Scholar]
- 2. GBD 2019 Blindness and Vision Impairment Collaborators, on belhalf of Vision Loss Expert Group of the Global Burden of Disease Study . Causes of blindness and vision impairment in 2020 and trends over 30 years, and prevalence of avoidable blindness in relation to vision 2020: the right to sight: an analysis for the global burden of disease study. Lancet Glob Health. 2021;9:e144‐e160. [DOI] [PMC free article] [PubMed] [Google Scholar]
- 3. Stem MS, Gardner TW. Neurodegeneration in the pathogenesis of diabetic retinopathy: molecular mechanisms and therapeutic implications. Curr Med Chem. 2013;20:3241‐3250. [DOI] [PMC free article] [PubMed] [Google Scholar]
- 4. Photocoagulation for diabetic macular edema . Early treatment diabetic retinopathy study report number 1. Early treatment diabetic retinopathy study research group. Arch Ophthalmol. 1985;103:1796‐1806. [PubMed] [Google Scholar]
- 5. Wells JA, Glassman AR, Ayala AR, et al. Aflibercept, bevacizumab, or ranibizumab for diabetic macular edema: two‐year results from a comparative effectiveness randomized clinical trial. Ophthalmology. 2016;123:1351‐1359. [DOI] [PMC free article] [PubMed] [Google Scholar]
- 6. Gross JG, Glassman AR, Liu D, et al. Five‐year outcomes of panretinal photocoagulation vs intravitreous ranibizumab for proliferative diabetic retinopathy: a randomized clinical trial. JAMA Ophthalmol. 2018;136:1138‐1148. [DOI] [PMC free article] [PubMed] [Google Scholar]
- 7. Williams DF, Williams GA, Hartz A, Mieler WF, Abrams GW, Aaberg TM. Results of vitrectomy for diabetic traction retinal detachments using the en bloc excision technique. Ophthalmology. 1989;96:752‐758. [DOI] [PubMed] [Google Scholar]
- 8. Diabetic Retinopathy Clinical Research Network Writing C , Haller JA, Qin H, et al. Vitrectomy outcomes in eyes with diabetic macular edema and vitreomacular traction. Ophthalmology. 2010;117:1087‐1093. e3. [DOI] [PMC free article] [PubMed] [Google Scholar]
- 9. Tan CS, Chew MC, Lim LW, Sadda SR. Advances in retinal imaging for diabetic retinopathy and diabetic macular edema. Indian J Ophthalmol. 2016;64:76‐83. [DOI] [PMC free article] [PubMed] [Google Scholar]
- 10. Grading diabetic retinopathy from stereoscopic color fundus photographs‐‐an extension of the modified airlie house classification . ETDRS report number 10. Early treatment diabetic retinopathy study research group. Ophthalmology. 1991;98:786‐806. [PubMed] [Google Scholar]
- 11. Fundus photographic risk factors for progression of diabetic retinopathy . ETDRS report number 12. Early treatment diabetic retinopathy study research group. Ophthalmology. 1991;98:823‐833. [PubMed] [Google Scholar]
- 12. Zhang J, Strauss EC. Sensitive detection of therapeutic efficacy with the etdrs diabetic retinopathy severity scale. Clin Ophthalmol. 2020;14:4385‐4393. [DOI] [PMC free article] [PubMed] [Google Scholar]
- 13. Wilkinson CP, Ferris FL 3rd, Klein RE, et al. Proposed international clinical diabetic retinopathy and diabetic macular edema disease severity scales. Ophthalmology. 2003;110:1677‐1682. [DOI] [PubMed] [Google Scholar]
- 14. Oishi A, Hidaka J, Yoshimura N. Quantification of the image obtained with a wide‐field scanning ophthalmoscope. Invest Ophthalmol Vis Sci. 2014;55:2424‐2431. [DOI] [PubMed] [Google Scholar]
- 15. Silva PS, Cavallerano JD, Sun JK, Noble J, Aiello LM, Aiello LP. Nonmydriatic ultrawide field retinal imaging compared with dilated standard 7‐field 35‐mm photography and retinal specialist examination for evaluation of diabetic retinopathy. Am J Ophthalmol. 2012;154:549‐559. e2. [DOI] [PubMed] [Google Scholar]
- 16. Silva PS, Cavallerano JD, Sun JK, Soliman AZ, Aiello LM, Aiello LP. Peripheral lesions identified by mydriatic ultrawide field imaging: distribution and potential impact on diabetic retinopathy severity. Ophthalmology. 2013;120:2587‐2595. [DOI] [PubMed] [Google Scholar]
- 17. Aiello LP, Odia I, Glassman AR, et al. Comparison of early treatment diabetic retinopathy study standard 7‐field imaging with ultrawide‐field imaging for determining severity of diabetic retinopathy. JAMA Ophthalmol. 2019;137:65‐73. [DOI] [PMC free article] [PubMed] [Google Scholar]
- 18. Rasmussen ML, Broe R, Frydkjaer‐Olsen U, et al. Comparison between early treatment diabetic retinopathy study 7‐field retinal photos and non‐mydriatic, mydriatic and mydriatic steered widefield scanning laser ophthalmoscopy for assessment of diabetic retinopathy. J Diabetes Complicat. 2015;29:99‐104. [DOI] [PubMed] [Google Scholar]
- 19. Price LD, Au S, Chong NV. Optomap ultrawide field imaging identifies additional retinal abnormalities in patients with diabetic retinopathy. Clin Ophthalmol. 2015;9:527‐531. [DOI] [PMC free article] [PubMed] [Google Scholar]
- 20. Silva PS, Cavallerano JD, Tolls D, et al. Potential efficiency benefits of nonmydriatic ultrawide field retinal imaging in an ocular telehealth diabetic retinopathy program. Diabetes Care. 2014;37:50‐55. [DOI] [PubMed] [Google Scholar]
- 21. Silva PS, Cavallerano JD, Haddad NM, et al. Peripheral lesions identified on ultrawide field imaging predict increased risk of diabetic retinopathy progression over 4 years. Ophthalmology. 2015;122:949‐956. [DOI] [PubMed] [Google Scholar]
- 22. Browning DJ, McOwen MD, Bowen RM Jr, O'Marah TL. Comparison of the clinical diagnosis of diabetic macular edema with diagnosis by optical coherence tomography. Ophthalmology. 2004;111:712‐715. [DOI] [PubMed] [Google Scholar]
- 23. Diabetic Retinopathy Clinical Research Network , Wells JA, Glassman AR, et al. Aflibercept, bevacizumab, or ranibizumab for diabetic macular edema. N Engl J Med. 2015;372:1193‐1203. [DOI] [PMC free article] [PubMed] [Google Scholar]
- 24. Diabetic Retinopathy Clinical Research Network , Elman MJ, Aiello LP, et al. Randomized trial evaluating ranibizumab plus prompt or deferred laser or triamcinolone plus prompt laser for diabetic macular edema. Ophthalmology. 2010;117:1064‐1077. e35. [DOI] [PMC free article] [PubMed] [Google Scholar]
- 25. Heier JS, Korobelnik JF, Brown DM, et al. Intravitreal aflibercept for diabetic macular edema: 148‐week results from the vista and vivid studies. Ophthalmology. 2016;123:2376‐2385. [DOI] [PubMed] [Google Scholar]
- 26. Dugel PU, Campbell JH, Kiss S, et al. Association between early anatomic response to anti‐vascular endothelial growth factor therapy and long‐term outcome in diabetic macular edema: an independent analysis of protocol i study data. Retina. 2019;39:88‐97. [DOI] [PMC free article] [PubMed] [Google Scholar]
- 27. Bressler NM, Odia I, Maguire M, et al. Association between change in visual acuity and change in central subfield thickness during treatment of diabetic macular edema in participants randomized to aflibercept, bevacizumab, or ranibizumab: a post hoc analysis of the protocol t randomized clinical trial. JAMA Ophthalmol. 2019;137:977‐985. [DOI] [PMC free article] [PubMed] [Google Scholar]
- 28. Ou WC, Brown DM, Payne JF, Wykoff CC. Relationship between visual acuity and retinal thickness during anti‐vascular endothelial growth factor therapy for retinal diseases. Am J Ophthalmol. 2017;180:8‐17. [DOI] [PubMed] [Google Scholar]
- 29. Kim BY, Smith SD, Kaiser PK. Optical coherence tomographic patterns of diabetic macular edema. Am J Ophthalmol. 2006;142:405‐412. [DOI] [PubMed] [Google Scholar]
- 30. Sun JK, Lin MM, Lammer J, et al. Disorganization of the retinal inner layers as a predictor of visual acuity in eyes with center‐involved diabetic macular edema. JAMA Ophthalmol. 2014;132:1309‐1316. [DOI] [PubMed] [Google Scholar]
- 31. Zur D, Iglicki M, Busch C, et al. OCT biomarkers as functional outcome predictors in diabetic macular edema treated with dexamethasone implant. Ophthalmology. 2018;125:267‐275. [DOI] [PubMed] [Google Scholar]
- 32. Radwan SH, Soliman AZ, Tokarev J, Zhang L, van Kuijk FJ, Koozekanani DD. Association of disorganization of retinal inner layers with vision after resolution of center‐involved diabetic macular edema. JAMA Ophthalmol. 2015;133:820‐825. [DOI] [PubMed] [Google Scholar]
- 33. Nicholson L, Ramu J, Triantafyllopoulou I, et al. Diagnostic accuracy of disorganization of the retinal inner layers in detecting macular capillary non‐perfusion in diabetic retinopathy. Clin Experiment Ophthalmol. 2015;43:735‐741. [DOI] [PubMed] [Google Scholar]
- 34. Chatziralli IP, Sergentanis TN, Sivaprasad S. Hyperreflective foci as an independent visual outcome predictor in macular edema due to retinal vascular diseases treated with intravitreal dexamethasone or ranibizumab. Retina. 2016;36:2319‐2328. [DOI] [PubMed] [Google Scholar]
- 35. Uji A, Murakami T, Nishijima K, et al. Association between hyperreflective foci in the outer retina, status of photoreceptor layer, and visual acuity in diabetic macular edema. Am J Ophthalmol. 2012;153:710‐7, 717.e1. [DOI] [PubMed] [Google Scholar]
- 36. Nishijima K, Murakami T, Hirashima T, et al. Hyperreflective foci in outer retina predictive of photoreceptor damage and poor vision after vitrectomy for diabetic macular edema. Retina. 2014;34:732‐740. [DOI] [PubMed] [Google Scholar]
- 37. Huang H, Jansonius NM, Chen H, Los LI. Hyperreflective dots on oct as a predictor of treatment outcome in diabetic macular edema: a systematic review. Ophthalmol Retina. 2022;6:814‐827. doi: 10.1016/j.oret.2022.03.020 [DOI] [PubMed] [Google Scholar]
- 38. Vujosevic S, Casciano M, Pilotto E, Boccassini B, Varano M, Midena E. Diabetic macular edema: fundus autofluorescence and functional correlations. Invest Ophthalmol Vis Sci. 2011;52:442‐448. [DOI] [PubMed] [Google Scholar]
- 39. Yoshitake S, Murakami T, Horii T, et al. Qualitative and quantitative characteristics of near‐infrared autofluorescence in diabetic macular edema. Ophthalmology. 2014;121:1036‐1044. [DOI] [PubMed] [Google Scholar]
- 40. Schmitz‐Valckenberg S, Holz FG, Bird AC, Spaide RF. Fundus autofluorescence imaging: review and perspectives. Retina. 2008;28:385‐409. [DOI] [PubMed] [Google Scholar]
- 41. Webb RH, Hughes GW, Delori FC. Confocal scanning laser ophthalmoscope. Appl Opt. 1987;26:1492‐1499. [DOI] [PubMed] [Google Scholar]
- 42. Demir G, Arici M, Alkin Z. Preoperative evaluation of tractional retinal detachment with b‐mode ultrasonography in diabetic vitreous hemorrhage. Beyoglu Eye J. 2021;6:49‐53. [DOI] [PMC free article] [PubMed] [Google Scholar]
- 43. Parchand S, Singh R, Bhalekar S. Reliability of ocular ultrasonography findings for pre‐surgical evaluation in various vitreo‐retinal disorders. Semin Ophthalmol. 2014;29:236‐241. [DOI] [PubMed] [Google Scholar]
- 44. Classification of diabetic retinopathy from fluorescein angiograms. ETDRS report number 11. Early treatment diabetic retinopathy study research group. Ophthalmology. 1991;98:807‐822. [PubMed] [Google Scholar]
- 45. Ashton N. Studies of the retinal capillaries in relation to diabetic and other retinopathies. Br J Ophthalmol. 1963;47:521‐538. [DOI] [PMC free article] [PubMed] [Google Scholar]
- 46. Merin S, Ber I, Ivry M. Retinal ischemia (capillary nonperfusion) and retinal neovascularization in patients with diabetic retinopathy. Ophthalmologica. 1978;177:140‐145. [DOI] [PubMed] [Google Scholar]
- 47. Niki T, Muraoka K, Shimizu K. Distribution of capillary nonperfusion in early‐stage diabetic retinopathy. Ophthalmology. 1984;91:1431‐1439. [DOI] [PubMed] [Google Scholar]
- 48. Cheung CMG, Fawzi A, Teo KY, et al. Diabetic macular ischaemia‐ a new therapeutic target? Prog Retin Eye Res. 2022;89:101033. doi: 10.1016/j.preteyeres.2021.101033 [DOI] [PMC free article] [PubMed] [Google Scholar]
- 49. Bradley PD, Sim DA, Keane PA, et al. The evaluation of diabetic macular ischemia using optical coherence tomography angiography. Invest Ophthalmol Vis Sci. 2016;57:626‐631. [DOI] [PubMed] [Google Scholar]
- 50. Bresnick GH, Condit R, Syrjala S, Palta M, Groo A, Korth K. Abnormalities of the foveal avascular zone in diabetic retinopathy. Arch Ophthalmol. 1984;102:1286‐1293. [DOI] [PubMed] [Google Scholar]
- 51. Ip MS, Domalpally A, Sun JK, Ehrlich JS. Long‐term effects of therapy with ranibizumab on diabetic retinopathy severity and baseline risk factors for worsening retinopathy. Ophthalmology. 2015;122:367‐374. [DOI] [PubMed] [Google Scholar]
- 52. Sim DA, Keane PA, Zarranz‐Ventura J, et al. Predictive factors for the progression of diabetic macular ischemia. Am J Ophthalmol. 2013;156:684‐692. [DOI] [PubMed] [Google Scholar]
- 53. Friberg TR, Gupta A, Yu J, et al. Ultrawide angle fluorescein angiographic imaging: a comparison to conventional digital acquisition systems. Ophthalmic Surg Lasers Imaging. 2008;39:304‐311. [DOI] [PubMed] [Google Scholar]
- 54. Wessel MM, Aaker GD, Parlitsis G, Cho M, D'Amico DJ, Kiss S. Ultra‐wide‐field angiography improves the detection and classification of diabetic retinopathy. Retina. 2012;32:785‐791. [DOI] [PubMed] [Google Scholar]
- 55. Silva PS, Dela Cruz AJ, Ledesma MG, et al. Diabetic retinopathy severity and peripheral lesions are associated with nonperfusion on ultrawide field angiography. Ophthalmology. 2015;122:2465‐2472. [DOI] [PubMed] [Google Scholar]
- 56. Wessel MM, Nair N, Aaker GD, Ehrlich JR, D'Amico DJ, Kiss S. Peripheral retinal ischaemia, as evaluated by ultra‐widefield fluorescein angiography, is associated with diabetic macular oedema. Br J Ophthalmol. 2012;96:694‐698. [DOI] [PMC free article] [PubMed] [Google Scholar]
- 57. Sim DA, Keane PA, Rajendram R, et al. Patterns of peripheral retinal and central macula ischemia in diabetic retinopathy as evaluated by ultra‐widefield fluorescein angiography. Am J Ophthalmol. 2014;158:144‐153. e1. [DOI] [PubMed] [Google Scholar]
- 58. Yannuzzi LA, Rohrer KT, Tindel LJ, et al. Fluorescein angiography complication survey. Ophthalmology. 1986;93:611‐617. [DOI] [PubMed] [Google Scholar]
- 59. Spaide RF, Fujimoto JG, Waheed NK, Sadda SR, Staurenghi G. Optical coherence tomography angiography. Prog Retin Eye Res. 2018;64:1‐55. [DOI] [PMC free article] [PubMed] [Google Scholar]
- 60. Ishibazawa A, Nagaoka T, Takahashi A, et al. Optical coherence tomography angiography in diabetic retinopathy: a prospective pilot study. Am J Ophthalmol. 2015;160:35‐44. e1. [DOI] [PubMed] [Google Scholar]
- 61. Hwang TS, Jia Y, Gao SS, et al. Optical coherence tomography angiography features of diabetic retinopathy. Retina. 2015;35:2371‐2376. [DOI] [PMC free article] [PubMed] [Google Scholar]
- 62. Matsunaga DR, Yi JJ, De Koo LO, Ameri H, Puliafito CA, Kashani AH. Optical coherence tomography angiography of diabetic retinopathy in human subjects. Ophthalmic Surg Lasers Imaging Retina. 2015;46:796‐805. [DOI] [PubMed] [Google Scholar]
- 63. Choi W, Waheed NK, Moult EM, et al. Ultrahigh speed swept source optical coherence tomography angiography of retinal and choriocapillaris alterations in diabetic patients with and without retinopathy. Retina. 2017;37:11‐21. [DOI] [PMC free article] [PubMed] [Google Scholar]
- 64. Querques G, Borrelli E, Battista M, Sacconi R, Bandello F. Optical coherence tomography angiography in diabetes: focus on microaneurysms. Eye (Lond). 2021;35:142‐148. [DOI] [PMC free article] [PubMed] [Google Scholar]
- 65. Hsieh YT, Alam MN, Le D, et al. Oct angiography biomarkers for predicting visual outcomes after ranibizumab treatment for diabetic macular edema. Ophthalmol Retina. 2019;3:826‐834. [DOI] [PMC free article] [PubMed] [Google Scholar]
- 66. Toto L, D'Aloisio R, Di Nicola M, et al. Qualitative and quantitative assessment of vascular changes in diabetic macular edema after dexamethasone implant using optical coherence tomography angiography. Int J Mol Sci. 2017;18:1181. [DOI] [PMC free article] [PubMed] [Google Scholar]
- 67. Ashraf M, Sampani K, Clermont A, et al. Vascular density of deep, intermediate and superficial vascular plexuses are differentially affected by diabetic retinopathy severity. Invest Ophthalmol Vis Sci. 2020;61:53. [DOI] [PMC free article] [PubMed] [Google Scholar]
- 68. Kim AY, Chu Z, Shahidzadeh A, Wang RK, Puliafito CA, Kashani AH. Quantifying microvascular density and morphology in diabetic retinopathy using spectral‐domain optical coherence tomography angiography. Invest Ophthalmol Vis Sci. 2016;57:OCT362‐OCT370. [DOI] [PMC free article] [PubMed] [Google Scholar]
- 69. Lee J, Moon BG, Cho AR, Yoon YH. Optical coherence tomography angiography of dme and its association with anti‐vegf treatment response. Ophthalmology. 2016;123:2368‐2375. [DOI] [PubMed] [Google Scholar]
- 70. Cui Y, Zhu Y, Wang JC, et al. Comparison of widefield swept‐source optical coherence tomography angiography with ultra‐widefield colour fundus photography and fluorescein angiography for detection of lesions in diabetic retinopathy. Br J Ophthalmol. 2021;105:577‐581. [DOI] [PMC free article] [PubMed] [Google Scholar]
- 71. Russell JF, Al‐Khersan H, Shi Y, et al. Retinal nonperfusion in proliferative diabetic retinopathy before and after panretinal photocoagulation assessed by widefield oct angiography. Am J Ophthalmol. 2020;213:177‐185. [DOI] [PMC free article] [PubMed] [Google Scholar]
- 72. Couturier A, Rey PA, Erginay A, et al. Widefield oct‐angiography and fluorescein angiography assessments of nonperfusion in diabetic retinopathy and edema treated with anti‐vascular endothelial growth factor. Ophthalmology. 2019;126:1685‐1694. [DOI] [PubMed] [Google Scholar]
- 73. Cui Y, Zhu Y, Lu ES, et al. Widefield swept‐source oct angiography metrics associated with the development of diabetic vitreous hemorrhage: a prospective study. Ophthalmology. 2021;128:1312‐1324. [DOI] [PMC free article] [PubMed] [Google Scholar]
- 74. Greig EC, Duker JS, Waheed NK. A practical guide to optical coherence tomography angiography interpretation. Int J Retin Vitr. 2020;6:55. [DOI] [PMC free article] [PubMed] [Google Scholar]
- 75. Dysli C, Wolf S, Berezin MY, Sauer L, Hammer M, Zinkernagel MS. Fluorescence lifetime imaging ophthalmoscopy. Prog Retin Eye Res. 2017;60:120‐143. [DOI] [PMC free article] [PubMed] [Google Scholar]
- 76. Sauer L, Vitale AS, Modersitzki NK, Bernstein PS. Fluorescence lifetime imaging ophthalmoscopy: autofluorescence imaging and beyond. Eye (Lond). 2021;35:93‐109. [DOI] [PMC free article] [PubMed] [Google Scholar]
- 77. Schweitzer D, Deutsch L, Klemm M, et al. Fluorescence lifetime imaging ophthalmoscopy in type 2 diabetic patients who have no signs of diabetic retinopathy. J Biomed Opt. 2015;20:61106. [DOI] [PubMed] [Google Scholar]
- 78. Schmidt J, Peters S, Sauer L, et al. Fundus autofluorescence lifetimes are increased in non‐proliferative diabetic retinopathy. Acta Ophthalmol. 2017;95:33‐40. [DOI] [PubMed] [Google Scholar]
- 79. Bernstein PS, Vitale A, Modersitzki NK, Sauer L. Fluorescence lifetime imaging ophthalmoscopy (flio) in patients with diabetes and diabetic retinopathy. Invest Ophthalmol Vis Sci. 2020;61:1852. [Google Scholar]
- 80. Garg AK, Knight D, Lando L, Chao DL. Advances in retinal oximetry. Transl Vis Sci Technol. 2021;10:5. [DOI] [PMC free article] [PubMed] [Google Scholar]
- 81. Hardarson SH, Harris A, Karlsson RA, et al. Automatic retinal oximetry. Invest Ophthalmol Vis Sci. 2006;47:5011‐5016. [DOI] [PubMed] [Google Scholar]
- 82. Geirsdottir A, Palsson O, Hardarson SH, Olafsdottir OB, Kristjansdottir JV, Stefansson E. Retinal vessel oxygen saturation in healthy individuals. Invest Ophthalmol Vis Sci. 2012;53:5433‐5442. [DOI] [PubMed] [Google Scholar]
- 83. Hardarson SH, Stefansson E. Retinal oxygen saturation is altered in diabetic retinopathy. Br J Ophthalmol. 2012;96:560‐563. [DOI] [PubMed] [Google Scholar]
- 84. Jorgensen CM, Hardarson SH, Bek T. The oxygen saturation in retinal vessels from diabetic patients depends on the severity and type of vision‐threatening retinopathy. Acta Ophthalmol. 2014;92:34‐39. [DOI] [PubMed] [Google Scholar]
- 85. Blair NP, Wanek J, Felder AE, et al. Retinal oximetry and vessel diameter measurements with a commercially available scanning laser ophthalmoscope in diabetic retinopathy. Invest Ophthalmol Vis Sci. 2017;58:5556‐5563. [DOI] [PMC free article] [PubMed] [Google Scholar]
- 86. Reshef ER, Miller JB, Vavvas DG. Hyperspectral imaging of the retina: a review. Int Ophthalmol Clin. 2020;60:85‐96. [DOI] [PubMed] [Google Scholar]
- 87. Kashani AH, Lopez Jaime GR, Saati S, Martin G, Varma R, Humayun MS. Noninvasive assessment of retinal vascular oxygen content among normal and diabetic human subjects: a study using hyperspectral computed tomographic imaging spectroscopy. Retina. 2014;34:1854‐1860. [DOI] [PMC free article] [PubMed] [Google Scholar]
- 88. Tayyari F, Khuu LA, Flanagan JG, Singer S, Brent MH, Hudson C. Retinal blood flow and retinal blood oxygen saturation in mild to moderate diabetic retinopathy. Invest Ophthalmol Vis Sci. 2015;56:6796‐6800. [DOI] [PubMed] [Google Scholar]
- 89. Zhang B, Li N, Kang J, He Y, Chen XM. Adaptive optics scanning laser ophthalmoscopy in fundus imaging, a review and update. Int J Ophthalmol. 2017;10:1751‐1758. [DOI] [PMC free article] [PubMed] [Google Scholar]
- 90. Roorda A, Romero‐Borja F, Donnelly Iii W, Queener H, Hebert T, Campbell M. Adaptive optics scanning laser ophthalmoscopy. Opt Express. 2002;10:405‐412. [DOI] [PubMed] [Google Scholar]
- 91. Pircher M, Zawadzki RJ. Review of adaptive optics oct (ao‐oct): principles and applications for retinal imaging [invited]. Biomed Opt Express. 2017;8:2536‐2562. [DOI] [PMC free article] [PubMed] [Google Scholar]
- 92. Burns SA, Elsner AE, Chui TY, et al. In vivo adaptive optics microvascular imaging in diabetic patients without clinically severe diabetic retinopathy. Biomed Opt Express. 2014;5:961‐974. [DOI] [PMC free article] [PubMed] [Google Scholar]
- 93. Iqbal U. Smartphone fundus photography: a narrative review. Int J Retin Vitr. 2021;7:44. [DOI] [PMC free article] [PubMed] [Google Scholar]
- 94. Mohammadpour M, Heidari Z, Mirghorbani M, Hashemi H. Smartphones, tele‐ophthalmology, and vision 2020. Int J Ophthalmol. 2017;10:1909‐1918. [DOI] [PMC free article] [PubMed] [Google Scholar]
- 95. Queiroz MS, de Carvalho JX, Bortoto SF, et al. Diabetic retinopathy screening in urban primary care setting with a handheld smartphone‐based retinal camera. Acta Diabetol. 2020;57:1493‐1499. [DOI] [PMC free article] [PubMed] [Google Scholar]
- 96. Lord RK, Shah VA, San Filippo AN, Krishna R. Novel uses of smartphones in ophthalmology. Ophthalmology. 2010;117:1274‐e3. [DOI] [PubMed] [Google Scholar]
- 97. Raju B, Raju NS, Akkara JD, Pathengay A. Do it yourself smartphone fundus camera ‐ diyretcam. Indian J Ophthalmol. 2016;64:663‐667. [DOI] [PMC free article] [PubMed] [Google Scholar]
- 98. Tan CH, Kyaw BM, Smith H, Tan CS, Tudor CL. Use of smartphones to detect diabetic retinopathy: scoping review and meta‐analysis of diagnostic test accuracy studies. J Med Internet Res. 2020;22:e16658. [DOI] [PMC free article] [PubMed] [Google Scholar]
- 99. Grzybowski A, Brona P, Lim G, et al. Artificial intelligence for diabetic retinopathy screening: a review. Eye (Lond). 2020;34:451‐460. [DOI] [PMC free article] [PubMed] [Google Scholar]
- 100. Bhaskaranand M, Ramachandra C, Bhat S, et al. The value of automated diabetic retinopathy screening with the eyeart system: a study of more than 100,000 consecutive encounters from people with diabetes. Diabetes Technol Ther. 2019;21:635‐643. [DOI] [PMC free article] [PubMed] [Google Scholar]
- 101. Ipp E, Liljenquist D, Bode B, et al. Pivotal evaluation of an artificial intelligence system for autonomous detection of referrable and vision‐threatening diabetic retinopathy. JAMA Netw Open. 2021;4:e2134254. [DOI] [PMC free article] [PubMed] [Google Scholar]
- 102. Liu J, Gibson E, Ramchal S, et al. Diabetic retinopathy screening with automated retinal image analysis in a primary care setting improves adherence to ophthalmic care. Ophthalmol Retina. 2021;5:71‐77. [DOI] [PMC free article] [PubMed] [Google Scholar]
- 103. Kawai K, Uji A, Murakami T, et al. Image evaluation of artificial intelligence‐supported optical coherence tomography angiography imaging using oct‐a1 device in diabetic retinopathy. Retina. 2021;41:1730‐1738. [DOI] [PubMed] [Google Scholar]


