

Abstract
Artificial intelligence (AI) has come to be used in various technological fields in recent years. However, there have been no reports of AI‐designed clinical trials. In this study, we tried to develop study designs by a genetic algorithm (GA), which is an AI solution for combination optimization problems. Specifically, the computational design approach was applied to optimize the blood sampling schedule for a bioequivalence (BE) study in pediatrics and optimize the allocation of dose groups for a dose‐finding study. The GA could reduce the number of blood collection points from 15 (typical standard) to seven points without meaningful impact on the accuracy and precision of the pharmacokinetic estimation for the pediatric BE study. For the dose‐finding study, up to 10% reduction of the total number of required subjects from the standard design could be achieved. The GA also created a design that would lead to a drastic reduction of the required number of subjects in the placebo arm while keeping the total number of subjects at a minimum level. These results indicated the potential usefulness of the computational clinical study design approach for innovative drug development.
Study Highlights.
WHAT IS THE CURRENT KNOWLEDGE ON THE TOPIC?
The quality of a clinical study design is a key component of the success of the clinical development of new medicine.
WHAT QUESTION DID THIS STUDY ADDRESS?
This study assessed the possibility of creating a novel and innovative clinical study design using artificial intelligence (AI)‐based approaches like genetic algorithm, to overcome the limitations of traditional standard and empirical choices.
WHAT DOES THIS STUDY ADD TO OUR KNOWLEDGE?
The results of this study suggest that an AI‐based approach could help the development of a clinical study design.
HOW MIGHT THIS CHANGE DRUG DISCOVERY, DEVELOPMENT, AND/OR THERAPEUTICS?
The findings suggest that computer recommendations of a study design may result in opportunities to input novel and innovative ideas into model‐informed drug development.
INTRODUCTION
In recent years, artificial intelligence (AI)‐related technology has advanced and been used to process images, sounds, and natural language in various fields, including health care, such as in the research and development of new medicine. 1 , 2 For example, in the field of clinical pharmacology, there are studies about effective model and covariate selection, 3 , 4 , 5 , 6 an attempt to predict blood drug concentration with higher accuracy, 7 , 8 , 9 identification of subgroup/biomarker/gene affecting efficacy/safety, 10 , 11 , 12 , 13 virtual patient generation, 14 regimen creation for combination therapy, 15 and causal inference and dimensional reduction in quantitative system pharmacology models. 16 However, clinical trials that have been designed by AI have not been reported, although the design of a study is an important factor in effective new drug development. 17 Well‐designed clinical studies that reveal the characteristics of a product, such as its distinction from other medicines, can maximize the potential of a product with minimum cost, and directly result in high productivity. Although several novel protocol designs (e.g., adaptive design and master protocols) have been implemented in recent years, 18 , 19 , 20 further innovative study designs are required. 21
Bioequivalence (BE) studies verify the equivalence of the rate and extent of drug absorption into the body between two or more formulations. Generally, healthy adult volunteers are used for a BE study, and blood is frequently sampled to assess pharmacokinetic (PK) equivalence using noncompartmental analysis (NCA). 22 However, a situation in which a pediatric subject is required for a BE assessment may arise; the absorption profile of the formulation may differ between adults and pediatrics. 23 , 24 Because the frequency and sample volume of blood collection are more limited in pediatrics than in adults, the blood sampling schedule must be refined. Current schedule optimization methods are unable to reduce the sampling to a satisfactory level. 25 , 26 Hence, a novel approach for minimizing blood drawing timepoints is required.
Understanding the relationship between dose and response is particularly important in the clinical development of a new drug product. Considerably low doses produce insufficient efficacy, and extremely high doses may result in safety or tolerance issues. Various designs of clinical studies and analytical methods for investigating dose–response profile have been developed. 27 , 28 , 29 Multiple comparison procedure−modeling (MCP‐Mod) is an analytical method for determining the dose–response relationship of a drug. 30 , 31 It is a combination of multiple comparison and dose–response modeling, and can identify a dose–response profile and target a therapeutic dose while adjusting the multiplicity. Specifically, MCP‐Mod comprises the following steps: (1) assume candidates of dose–response models, (2) calculate optimum contrast coefficients, (3) test for a significant dose–response signal, (4) identify the most appropriate model, and (5) when statistical significance is detected, estimate the dose–response relationship and target dose.
A clinical trial consists of several design elements. By setting multiple options for each element, the design of a trial can be interpreted as a combination optimization problem, which is a major research topic in the field of AI. In this study, we propose using an AI‐based approach to design an innovative clinical trial that could not be designed by humans. We use the genetic algorithm (GA), 32 which is an AI solution for the combination optimization problem, and simulate the clinical study. We conduct two experiments in this study. First, a blood sampling schedule for a pediatric BE study is designed. Second, subjects are allocated into groups based on dosage for a clinical dose‐finding study.
METHODS
Case 1. Blood collection schedule for pediatric BE study
For the BE study, we aim to design a blood sampling schedule such that precise NCA PK parameters are obtained from fewer sampling points. We impose two conditions on the study design; the design should not influence the estimates of either the maximum blood concentration (C max) or the area under the blood concentration–time curve up to the time of final measurable concentration (AUC t ).
Blood drug concentrations at 49 timepoints for 24 subjects were generated by a Monte Carlo simulation based on the population PK model (Table 1). Subsequently, a typical blood‐drawing schedule consisting of 15 timepoints for BE assessment were extracted (Figure 1a). C max and AUC t were calculated by NCA with the ncappc package of R. 33 The exposure parameters using all 49 timepoints were set as the true reference, and ones using typical 15 timepoints were set as a comparator. The GA identified the optimal combinations of blood sampling points from all 49 timepoints by minimizing both the number of blood drawing times and the bias of PK parameters. The accuracy and precision of PK parameters for both the reference and the GA‐recommended cases were evaluated using the mean absolute percentage error (MAPE) and the root mean square percentage error (RMSPE), respectively. They are expressed as follows:
TABLE 1.
Population PK parameters for pediatric BE study.
| Parameter | Typical value | IIV (%CV) |
|---|---|---|
| k a (1/h) | 1.201 | 30 |
| CL/F (L/h) | 0.190 | 20 |
| V c/F (L) | 5.1 | 20 |
| V p/F (L) | 32.5 | 20 |
| Q/F (L/h) | 0.336 | 30 |
| Tlag (h) | 0.125 | – |
Note: Assay error (relative) = 5%CV. Assay error (absolute) = 2 ng/mL SD. Lower limit of quantification was set to 75 ng/mL.
Abbreviations: BE, bioequivalence; CL/F, oral clearance; CV, coefficient variance, IIV, interindividual variance; k a, absorption rate constant; PK, pharmacokinetic; Q/F, apparent inter‐compartmental clearance; Tlag, absorption lag time; V c/F, apparent volume of distribution in central compartment; V p/F, apparent volume of distribution in peripheral compartment.
FIGURE 1.
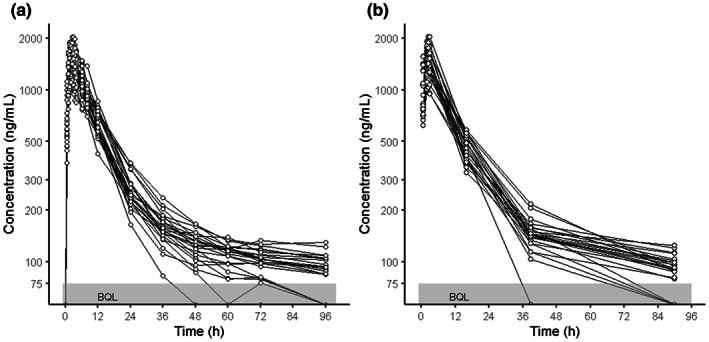
Comparison of individual concentration‐time relationships. (a) Typical sampling schedule (15 points), (b) GA‐recommended sampling schedule (7 points). GA, genetic algorithm.
The BE studies usually require 12–18 timepoints of blood collection. 22 Of these, at least seven are considered mandatory (baseline, one point before C max, two points around C max, and three points during the elimination phase) for the precise estimation of both C max and AUC t . 34 , 35 A fitness function, defined as the sum of the MAPE and RMSPE for C max and AUC t , and the square of the number of sampling points divided by seven, was taken as a quantitative index to evaluate the appropriateness of the study design. This term was added as a penalty in cases where the number of samples significantly exceeded seven. On the other hand, there was only a small advantage to be <7 points.
The fitness function means that a reduction of the number of blood samplings from a typical schedule (15 points) to minimum (7 points) is equivalent to a 0.9% (<1%) increase in all MAPE and RMSPE. Additionally, an acceptable difference (<5%) for each MAPE and RMSPE was set. If any MAPE or RMSPE exceeded the threshold, a large number (10,000) was substituted into the fitness function as a lethal chromosome. Because the precision of estimated PK parameters affects the BE study result, such stringent criteria were used. Finally, the set of sampling points that obtained the minimum fitness‐function score was treated as the GA‐recommended study design.
Case 2. Subject allocation for the dose‐finding study
We assumed a dose‐finding study for profiling the dose–response relationship with a placebo and five active doses (10, 25, 50, 100, and 150 mg), and for estimating the optimal clinical dose using MCP‐Mod. In the planning phase, six patterns of dose–response profiles were expected (Figure 2). Both monotonic and inverted‐U‐shaped profiles were assumed for the averaging importance among low, middle, and high dose arms. The strongest efficacy showed on the highest dose in monotonic profiles. Low and middle doses have the strongest efficacy in betaMod1 and betaMod2 profiles, respectively. The sample sizes of each arm for detecting the presence of dose–response relationship with 80% power 31 were designed using GA. The total sample size was defined as the fitness function value. Design features were evaluated by comparing the recommended design to two traditional designs (Proportion, where doses are equally assigned to all arms; and Double, where placebo and the maximum dose are incorporated twice more than in the other equally assigned arms), and an optimized design using the D‐optimal method. 28 , 36 The DoseFinding package in R was used for applying the MCP‐Mod method. 37
FIGURE 2.
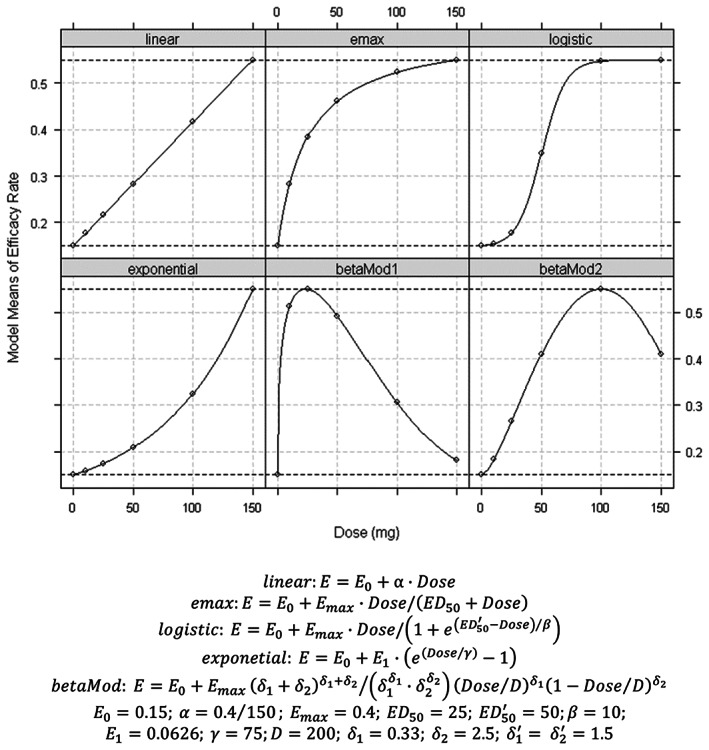
Assumed dose–response relationships. E max, maximum effect.
GA‐recommended study‐design planning
We used R, version 4.0.3, with the genalg package for the GA for all analyses. 38 , 39 In both cases, the GA generated the 200 initial chromosomes (design patterns) using random numbers and an evaluated fitness value for each chromosome. For the BE study design, the chromosome was defined as the binary array corresponding with all 49 sampling timepoints. For the phase II study dose allocation, the chromosome consisted of the relative ratios of size in each dose arm compared with the placebo arm. The range of each ratio was limited between 0.2 and 5. To create a new generation, the better chromosomes were retained, and the others were renewed by a crossover with a pair of retained chromosomes and/or the mutation of genes. The fitness function values were evaluated in new generations and this was used to find the better chromosome again. After new generations were repeatedly created, the best chromosome in the hundredth generation was selected for the outcome. The mutation rates of GA were set to 3% and 1% for cases 1 and 2, respectively. It was known that the optimal range of the mutation ratio of GA is 1% to 10%, and 3% was a typical setting. Even though the first BE design optimization had 49 binary values in the chromosome, the second dose–response design case's individual had only five numerical values (sample size ratios compared with the placebo arm) in the chromosome. Because the impact of a single gene mutation was huge for such conditions, a more conservative mutation ratio (1%) was adopted for the second case. The procedure was repeated 10 times, each time with a different random seed. These 10 recommended study designs were evaluated and compared to the reference case and to each other.
RESULTS
Case 1. Blood collection schedule for pediatric BE study
Figure 3 shows the GA recommendations. The trend of all recommended sampling schemes was nearly identical. Individual schemes are shown in Table S1. The mandatory sampling points for the BE assessment (one point before C max, two points around C max, and three points in elimination phase), except the one baseline point, were taken in all recommendations. The PK parameters from the best recommended design (that had the minimum fitness function; Figure 1b) were compared to the parameters from the reference design; Figure 4 shows the results. There was a slight impact on the PK parameter estimates, although the number of blood samples could be reduced from 15 to 7 (Table 2). The MAPE for C max and AUC t was 0.431% and 0.000188%, respectively, and the RMSPE was 0.124% and 0.213%, respectively.
FIGURE 3.
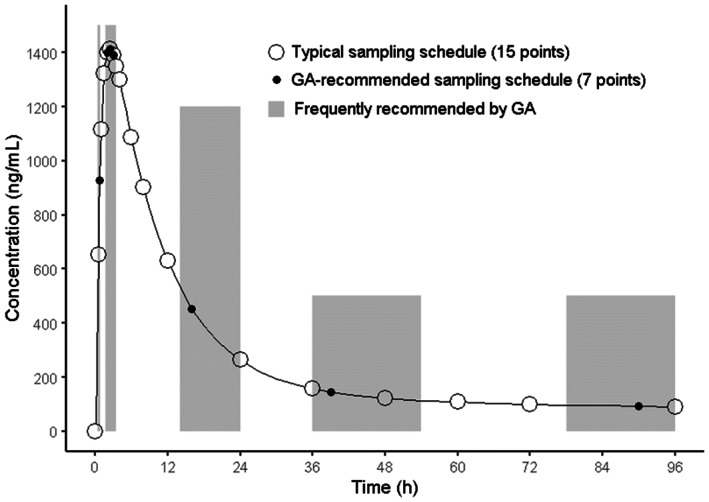
Typical and recommended sampling schedules. GA, genetic algorithm.
FIGURE 4.
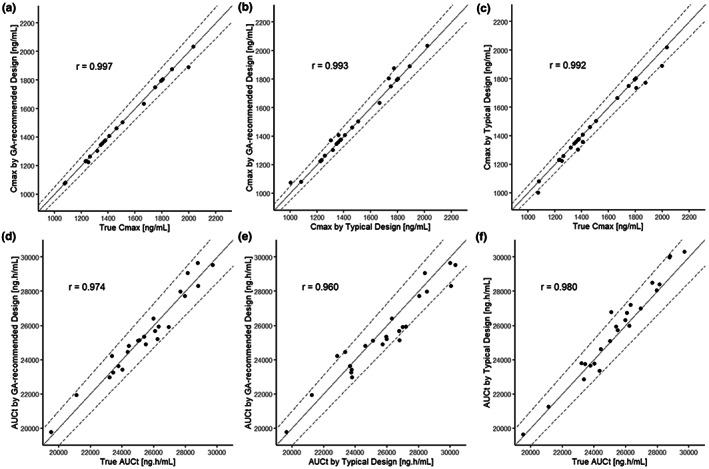
Goodness‐of‐fit plots among individual C max and AUC t estimates from the best sampling schedule recommended by the GA, from a typical sampling schedule, and from all of the data as true value. (a) GA recommended versus true of C max, (b) GA recommended versus typical sampling of C max, (c) typical sampling versus true of C max, (d) GA recommended versus true of AUC t , (e) GA recommended versus typical sampling of AUC t , and (f) typical sampling versus true of AUC t . The solid line represents identity line, and dotted lines represent 1% difference. AUC t , area under the blood concentration–time curve up to the time of final measurable concentration; C max, maximum plasma concentration; GA, genetic algorithm.
TABLE 2.
Summary of noncompartmental PK parameters.
| Parameter | Scenario | Number of blood samples | Mean ± SD | Median | Min, Max |
|---|---|---|---|---|---|
|
C max (ng/mL) |
Full data (True) | 49 | 1491 ± 279 | 1491 | 1075, 2034 |
| Typical schedule | 15 | 1470 ± 270 | 1374 | 1003, 2021 | |
| Best recommendation by GA | 7 | 1484 ± 272 | 1392 | 1075, 2034 | |
|
AUC t (ng h/mL) |
Full data (True) | 49 | 25,449 ± 2448 | 25,436 | 19,526, 29,704 |
| Typical schedule | 15 | 25,784 ± 2740 | 25,961 | 19,653, 30,316 | |
| Best recommendation by GA | 7 | 25,438 ± 2421 | 25,181 | 19,789, 29,652 |
Note: N = 24.
Abbreviations: AUC t , area under the blood concentration–time curve up to the time of final measurable concentration; C max, maximum plasma concentration; GA, genetic algorithm; PK, pharmacokinetic.
Nine out of 10 sampling plans recommended that a blood sample be collected during the period from drug administration to 1 h after administration (up to C max). Subsequently, three (3/10) or four points (7/10) were recommended during the period from 1.75 to 3.5 h after dose administration (around C max). Finally, all recommended plans included at least three sampling points in the elimination phases from all three durations at 14–24, 36–54, and 78–96 h. Only one plan recommended blood collection at the baseline (0 h).
Case 2. Subject allocation for the dose‐finding study
The total sample sizes of the 10 GA‐recommended designs ranged from 405–415 subjects, which was less than that of traditional designs (Proportion: 450, Double: 416). The D‐optimal design required 415 subjects, and had more subjects assigned to the placebo group and a larger maximum dose (150 mg) than that of the Double method. Three of the GA designs are presented in Figure 5. These three designs are that of the smallest sample size (10% less than Proportion), the maximum power (in spite of the total sample size being less than that of the empirical methods), and the minimum number of placebo samples (approximately half of Double, but with same total size as D‐optimal method). All designs are shown in Table S2. Common characteristics of the GA‐recommended designs are as follows: (1) the highest dose (150 mg) group had the largest number of subjects (mean 28%); (2) the 50 mg group had the smallest number of subjects (approximately one third of the highest dose group [mean 8%]); (3) the 10 and 100 mg groups had a medium number of subjects (mean 16%), and the 25 mg group had only a slightly lower number (mean 13%); and (4) the placebo group had a large variance (14%–23%, mean 18%).
FIGURE 5.
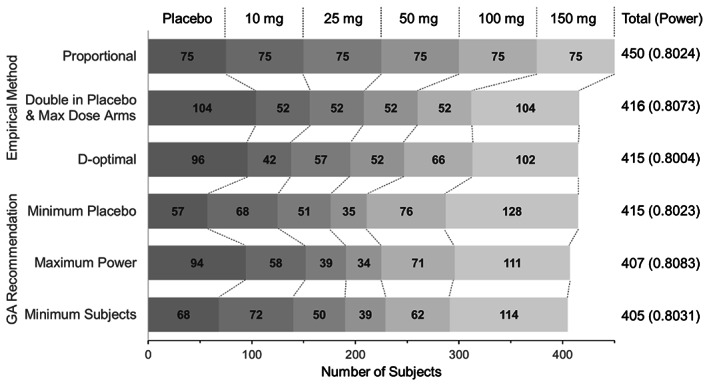
Patient allocations of traditional and GA‐recommended methods. GA, genetic algorithm.
DISCUSSION
In this study, we attempted to generate a design of a clinical study using an AI‐based approach. This approach may more effectively find an innovative study design outside of the traditional standard and empirical alternatives.
In the first case, a blood‐sampling schedule for the pediatric BE study was designed under strict limitations in terms of the number of times blood could be drawn. All 10 sampling plans adopted rich sampling (3–4 points) around the expected time of C max (that is, near T max), which enabled high‐precision prediction of C max. Although the preciseness of the AUC t was lower than that of the C max, the GA‐recommended sampling schedule obtained PK parameters with sufficient accuracy and precision (Figure 4). If the true parameters from all 49 timepoints were used for the optimization instead of the reference parameter values from 15 typical timepoints, a few sampling times, around T max, were added to the recommendation (data were not shown). The GA is a metaheuristic method that can find a quasi‐optimal solution in a considerably large search space in which a traditional systematic method (e.g., grid search and random search) might not be applicable. 40 , 41 In this first case, there were ~1013 combinations of seven to eight points selected from 49 timepoint candidates. Considering the feasibility of the study, and the standard theory of a sampling schedule—for example, T max must be included at the time of blood sampling 26 —the number of options may decrease considerably. However, numerous options remain. The phenomenon in which the combination pattern increases exponentially with an increase in the number of options is called “combination explosion.” 42 A comprehensive approach requires considerable computer resources and calculation time owing to this issue. Thus, the GA, which can obtain a quasi‐optimum solution from numerous options in a relatively short time, is highly useful for designing a clinical study. In the BE case, all the GA‐recommended designs had unique sampling schedules, and their times of blood sampling (7–8 points) were less than the traditional design. They were also comparable with a previous optimizational investigation. 35 When the weight of the number of samples in the fitness function was changed from six to eight, the trend of the recommended schedule and the required number of samples was not changed. The seven to eight sampling points were considered a minimum requirement to obtain precise PK parameters. When the weight was set to nine or higher, the number of blood collection points increased according to the weight, but it did not increase in a specific time zone. Hughes et al. has reported a GA utilized sampling schedule optimization based on the given number of samples. 43 Even though a favorable sampling schedule was not given, they were in line with the known art in all 10 runs. Some of the timepoints in narrow ranges should be treated as a recommended window. Additionally, it is essential to make decisions while objectively evaluating the study design presented by the computer, considering the PK profile and the study feasibility, rather than only relying on the accuracy of prediction. The GA does not always find the global optima for this type of problem. Considering the possibility of getting stuck in a local optima, the recommendation to the development team should be based on multiple results and/or their ensemble.
The second case considered in this study was the optimization of subject allocation for a dose‐finding study. We presented several different patterns of study designs. The proposed designs included one with a 10% reduction in the total number of required subjects compared to that of the conventional method (“Minimum Subjects” vs. “Proportional”). In clinical development practice, the best design for a clinical trial cannot be defined. The results show that the GA can propose several designs that are almost equivalent in terms of requirements. This will enable the development team to select the design that meets the predefined requirements and considers the additional value. For example, the design with the smallest placebo group‐sample size could slightly reduce the risk of placebo administration, which is not expected to provide efficacy. We expect that new findings and improved study designs will be discovered, based on design candidates that have been proposed by AI, by continuing discussions in the development team.
The model‐informed drug development approach, which has revolutionized the clinical development of medicines in recent decades, has enabled the trial and error of computer‐simulated clinical studies that cannot be realized in the real world, thereby helping to identify better trial designs. 44 , 45 , 46 , 47 , 48 This process can compare the superiority and inferiority of designs; however, it may be difficult to produce novel and innovative designs. In this study, we aimed to find an innovative clinical trial design using AI. In the first case, there were no novel designs. Thus, the proposed BE study designs were in line with the traditional sampling guide. This could be because the already‐established knowledge for efficiently sampling for a BE assessment is robust. This result also indicates that the GA selected the correct design for selection. The second case considered in this study indicated that a computer could create designs with a smaller number of subjects compared to that of traditional designs. Additionally, an innovative design that can drastically reduce the assignment of subjects into the placebo group, without increasing the total number of subjects compared to conventional designs, was proposed.
In this study, a computer‐based design was used to design some of the elements of clinical trials. However, there are many design elements and options in the protocol of an actual clinical study. The other design factors include inclusion/exclusion criteria, dosing patterns (e.g., crossover vs. parallel), scheduling (i.e., timing and frequency) of the outcome assessments, sample sizing, the analysis method (i.e., parametric or non‐parametric), etc. Instead of MCP‐Mod, a population‐based exposure‐response analysis that combined data across all arms can also be an option for case 2. If all of these elements were designed by the GA, combinatorial explosion would occur. Hence, many design factors need to be optimized sequentially. For example, after the sampling schedule optimization was performed as in case 1 during the first stage, other design factors were optimized during the second stage, based on the BE success rate. Furthermore, uncertainty in both the model and parameter space must be considered during the design study of actual conditions. These were strong preconditions for both cases. In the first BE case, the PK profiles were assumed to be known. In the second case, six dose–response relationship patterns were assumed. If the actual data will not be suited with these assumptions, the expected outcome may not be obtained. For these situations, sensitivity analysis with several model and parameter sets should be considered. The knowledge coming from GA recommended designs is more important than the recommendations themselves. This approach requires numerous computer resources to process multiple calculations to simulate clinical trials. These limitations pose difficulties for using a computer to fully design a clinical trial. We believe that parallel computing technology, which is applicable to the GA, 49 , 50 will be the key for implementing AI‐assisted clinical trial design.
In this study, we demonstrated the potential of a computer‐assisted approach to design innovative clinical studies.
AUTHOR CONTRIBUTIONS
S.T. and Y.T. wrote the manuscript. S.T. designed the research. S.T. and Y.T. performed the research. S.T. analyzed the data.
FUNDING INFORMATION
No funding was received for this work.
CONFLICT OF INTEREST STATEMENT
The authors declared no competing interests for this work.
Supporting information
Appendix S1
Appendix S2
Table S1
Table S2
Tsuchiwata S, Tsuji Y. Computational design of clinical trials using a combination of simulation and the genetic algorithm. CPT Pharmacometrics Syst Pharmacol. 2023;12:522‐531. doi: 10.1002/psp4.12944
DATA AVAILABILITY STATEMENT
The R scripts used in this study are provided as Appendices S1 and S2.
REFERENCES
- 1. Rodrigues LF, Backes AR, Travencolo BAN, de Oliveira GMB. Optimizing a deep residual neural network with genetic algorithm for acute lymphoblastic leukemia classification. J Digit Imaging. 2022;35:623‐637. [DOI] [PMC free article] [PubMed] [Google Scholar]
- 2. Masud M, Sikder N, Nahid AA, Bairagi AK, AlZain MA. A machine learning approach to diagnosing lung and colon cancer using a deep learning‐based classification framework. Sensors (Basel). 2021;21:748. [DOI] [PMC free article] [PubMed] [Google Scholar]
- 3. Chaturvedula A, Calad‐Thomson S, Liu C, Sale M, Gattu N, Goyal N. Artificial intelligence and pharmacometrics: time to embrace, capitalize, and advance? CPT Pharmacometrics Syst Pharmacol. 2019;8:440‐443. [DOI] [PMC free article] [PubMed] [Google Scholar]
- 4. Koch G, Pfister M, Daunhawer I, Wilbaux M, Wellmann S, Vogt JE. Pharmacometrics and machine learning partner to advance clinical data analysis. Clin Pharmacol Ther. 2020;107:926‐933. [DOI] [PMC free article] [PubMed] [Google Scholar]
- 5. Sibieude E, Khandelwal A, Girard P, Hesthaven JS, Terranova N. Population pharmacokinetic model selection assisted by machine learning. J Pharmacokinet Pharmacodyn. 2021;49:257‐270. [DOI] [PMC free article] [PubMed] [Google Scholar]
- 6. Sibieude E, Khandelwal A, Hesthaven JS, Girard P, Terranova N. Fast screening of covariates in population models empowered by machine learning. J Pharmacokinet Pharmacodyn. 2021;48:597‐609. [DOI] [PMC free article] [PubMed] [Google Scholar]
- 7. Ogami C, Tsuji Y, Seki H, et al. An artificial neural network‐pharmacokinetic model and its interpretation using Shapley additive explanations. CPT Pharmacometrics Syst Pharmacol. 2021;10:760‐768. [DOI] [PMC free article] [PubMed] [Google Scholar]
- 8. Tang BH, Guan Z, Allegaert K, et al. Drug clearance in neonates: a combination of population pharmacokinetic modelling and machine learning approaches to improve individual prediction. Clin Pharmacokinet. 2021;60:1435‐1448. [DOI] [PubMed] [Google Scholar]
- 9. Lu J, Deng K, Zhang X, Liu G, Guan Y. Neural‐ODE for pharmacokinetics modeling and its advantage to alternative machine learning models in predicting new dosing regimens. iScience. 2021;24:102804. [DOI] [PMC free article] [PubMed] [Google Scholar]
- 10. Gim JA, Kwon Y, Lee HA, et al. A machine learning‐based identification of genes affecting the pharmacokinetics of tacrolimus using the DMET(TM) plus platform. Int J Mol Sci. 2020;21:2517. [DOI] [PMC free article] [PubMed] [Google Scholar]
- 11. McComb M, Bies R, Ramanathan M. Machine learning in pharmacometrics: opportunities and challenges. Br J Clin Pharmacol. 2021;88:1482‐1499. [DOI] [PubMed] [Google Scholar]
- 12. Howlader KC, Satu MS, Awal MA, et al. Machine learning models for classification and identification of significant attributes to detect type 2 diabetes. Health Inf Sci Syst. 2022;10:2. [DOI] [PMC free article] [PubMed] [Google Scholar]
- 13. McComb M, Ramanathan M. Generalized pharmacometric modeling, a novel paradigm for integrating machine learning algorithms: a case study of metabolomic biomarkers. Clin Pharmacol Ther. 2020;107:1343‐1351. [DOI] [PubMed] [Google Scholar]
- 14. Rieger TR, Allen RJ, Bystricky L, et al. Improving the generation and selection of virtual populations in quantitative systems pharmacology models. Prog Biophys Mol Biol. 2018;139:15‐22. [DOI] [PubMed] [Google Scholar]
- 15. Tsigelny IF. Artificial intelligence in drug combination therapy. Brief Bioinform. 2019;20:1434‐1448. [DOI] [PubMed] [Google Scholar]
- 16. McComb M, Blair RH, Lysy M, Ramanathan M. Machine learning‐guided, big data‐enabled, biomarker‐based systems pharmacology: modeling the stochasticity of natural history and disease progression. J Pharmacokinet Pharmacodyn. 2022;49:65‐79. [DOI] [PubMed] [Google Scholar]
- 17. Kuwashima K. Organizational capabilities in pharmaceutical research and development. Organ Sci. 2015;47:11‐28. [Google Scholar]
- 18. Hummel J, Wang S, Kirkpatrick J. Using simulation to optimize adaptive trial designs: applications in learning and confirmatory phase trials. Clin Invest (Lond). 2015;5:401‐413. [Google Scholar]
- 19. Price D, Scott J, The US. Food and Drug Administration's complex innovative trial design pilot meeting program: progress to date. Clin Trials. 2021;18:706‐710. [DOI] [PubMed] [Google Scholar]
- 20. Sessler DI, Myles PS. Novel clinical trial designs to improve the efficiency of research. Anesthesiology. 2020;132:69‐81. [DOI] [PubMed] [Google Scholar]
- 21. European Federation of Pharmaceutical Industries and Associations . Innovation in Clinical Trial Design: A Review of the Clinical Trial Design Landscape . 2020. https://www.efpia.eu/media/547507/efpia‐position‐paper‐innovation‐in‐clinical‐trial‐design‐white‐paper.pdf. Accessed May 10, 2022.
- 22. Galgatte UC, Jamdade VR, Aute PP, Chaudhari PD. Study on requirements of bioequivalence for registration of pharmaceutical products in USA, Europe and Canada. Saudi Pharm J. 2014;22:391‐402. [DOI] [PMC free article] [PubMed] [Google Scholar]
- 23. Pawar G, Wu F, Zhao L, et al. Development of a pediatric relative bioavailability/bioequivalence database and identification of putative risk factors associated with evaluation of pediatric oral products. AAPS J. 2021;23:57. [DOI] [PMC free article] [PubMed] [Google Scholar]
- 24. Illamola SM, Birnbaum AK, Sherwin CM. Generic drug products in paediatrics: where are the data? Br J Clin Pharmacol. 2019;85:1871‐1873. [DOI] [PMC free article] [PubMed] [Google Scholar]
- 25. Choi L, Caffo B, Rohde C. Optimal sampling times in bioequivalence studies using a simulated annealing algorithm. Stat Comput. 2007;17:337‐347. [Google Scholar]
- 26. Kano EK, Chiann C, Fukuda K, Porta V. Effect of different sampling schedules on results of bioavailability and bioequivalence studies: evaluation by means of Monte Carlo simulations. Drug Res (Stuttg). 2017;67(451–457):451‐457. [DOI] [PubMed] [Google Scholar]
- 27. Bretz F, Dette H, Pinheiro JC. Practical considerations for optimal designs in clinical dose finding studies. Stat Med. 2010;29:731‐742. [DOI] [PMC free article] [PubMed] [Google Scholar]
- 28. Aouni J, Bacro JN, Toulemonde G, Colin P, Darchy L, Sebastien B. Design optimization for dose‐finding trials: a review. J Biopharm Stat. 2020;30:662‐673. [DOI] [PubMed] [Google Scholar]
- 29. Ting N. General considerations in dose–response study designs. In: Ting N, ed. Dose Finding in Drug Development. Springer; 2006:89‐105. [Google Scholar]
- 30. Bretz F, Pinheiro JC, Branson M. Combining multiple comparisons and modeling techniques in dose‐response studies. Biometrics. 2005;61:738‐748. [DOI] [PubMed] [Google Scholar]
- 31. Pinheiro J, Bornkamp B, Bretz F. Design and analysis of dose‐finding studies combining multiple comparisons and modeling procedures. J Biopharm Stat. 2006;16:639‐656. [DOI] [PubMed] [Google Scholar]
- 32. McCall J. Genetic algorithms for modelling and optimisation. J Comput Appl Math. 2005;84:205‐222. [Google Scholar]
- 33. Acharya C, Hooker AC, Turkyilmaz GY, Jonsson S, Karlsson MO. A diagnostic tool for population models using non‐compartmental analysis: the ncappc package for R. Comput Methods Programs Biomed. 2016;127:83‐93. [DOI] [PubMed] [Google Scholar]
- 34. Japan Ministry of Health, Labour and Welfare . Guideline for Bioequivalence Studies of Generic Products. 2020. https://www.nihs.go.jp/drug/be‐guide(e)/2020/GL1_BE_2020.pdf. Accessed May 10, 2022.
- 35. Kong FH, Gonin R. Optimal sampling times in bioequivalence tests. J Biopharm Stat. 2000;10:31‐44. [DOI] [PubMed] [Google Scholar]
- 36. Ryeznik Y, Sverdlov O, Hooker AC. Adaptive optimal designs for dose‐finding studies with time‐to‐event outcomes. AAPS J. 2017;20:24. [DOI] [PubMed] [Google Scholar]
- 37. Pinheiro J, Bornkamp B, Glimm E, Bretz F. Model‐based dose finding under model uncertainty using general parametric models. Stat Med. 2014;33:1646‐1661. [DOI] [PubMed] [Google Scholar]
- 38. Willighagen E, Ballings M. genalg: R Based Genetic Algorithm . 2022. https://cran.nyuad.nyu.edu/web/packages/genalg/genalg.pdf. Accessed May 10, 2022.
- 39. R Core Team . R: A Language and Environment for Statistical Computing. R Foundation for Statistical Computing; 2020. [Google Scholar]
- 40. Liashchynskyi PB, Liashchynskyi PB. Grid Search, random search, genetic algorithm: a big comparison for NAS. ArXiv; 1912.06059. 2019. doi: 10.48550/arXiv.1912.06059. [DOI]
- 41. Alibrahim H, Ludwig SA. Hyperparameter optimization: comparing genetic algorithm against grid search and bayesian optimization. 2021 IEEE Congress on Evolutionary Computation (CEC). 2021:1551–1559. doi: 10.1109/CEC45853.2021.9504761 [DOI]
- 42. Gass SI, Harris CM, eds. Combinatorial explosion. In: Encyclopedia of Operations Research and Management Science. Springer US; 2001:102. doi: 10.1007/1-4020-0611-X_130 [DOI] [Google Scholar]
- 43. Hughes JH, Upton RN, Reuter SE, Phelps MA, Foster DJR. Optimising time samples for determining area under the curve of pharmacokinetic data using non‐compartmental analysis. J Pharm Pharmacol. 2019;71:1635‐1644. [DOI] [PubMed] [Google Scholar]
- 44. Girard P. Clinical trial simulation: a tool for understanding study failures and preventing them. Basic Clin Pharmacol Toxicol. 2005;96:228‐234. [DOI] [PubMed] [Google Scholar]
- 45. Hill‐McManus D, Marshall S, Liu J, Willke RJ, Hughes DA. Linked pharmacometric‐pharmacoeconomic modeling and simulation in clinical drug development. Clin Pharmacol Ther. 2021;110:49‐63. [DOI] [PubMed] [Google Scholar]
- 46. Hill‐McManus D, Hughes DA. Combining model‐based clinical trial simulation, Pharmacoeconomics, and value of information to optimize trial design. CPT Pharmacometrics Syst Pharmacol. 2021;10:75‐83. [DOI] [PMC free article] [PubMed] [Google Scholar]
- 47. Milligan PA, Brown MJ, Marchant B, et al. Model‐based drug development: a rational approach to efficiently accelerate drug development. Clin Pharmacol Ther. 2013;93:502‐514. [DOI] [PubMed] [Google Scholar]
- 48. Lesko LJ. Perspective on model‐informed drug development. CPT Pharmacometrics Syst Pharmacol. 2021;10:1127‐1129. [DOI] [PMC free article] [PubMed] [Google Scholar]
- 49. Sastry K, Goldberg D, Kendall G. Genetic algorithms. In: Burke EK, Kendall G, eds. Search Methodologies: Introductory Tutorials in Optimization and Decision Support Techniques. Springer US; 2005:97‐125. doi: [DOI] [Google Scholar]
- 50. Katoch S, Chauhan SS, Kumar V. A review on genetic algorithm: past, present, and future. Multimed Tools Appl. 2021;80:8091‐8126. [DOI] [PMC free article] [PubMed] [Google Scholar]
Associated Data
This section collects any data citations, data availability statements, or supplementary materials included in this article.
Supplementary Materials
Appendix S1
Appendix S2
Table S1
Table S2
Data Availability Statement
The R scripts used in this study are provided as Appendices S1 and S2.