

Abstract
The need for clean water is the most basic human right. Water scarcity will be one important environmental problem of all countries in the future. Phosphate is a harmful matter for public health and the environment. In this study, the removal of phosphate from water by chitosan, which is an environmentally friendly material, was investigated. Chitosan adsorbent spheres were prepared for phosphate separation from water by adsorption, which is a feasible method. The effects of phosphate concentration, adsorbent dosage, and operation time on the removal were investigated. The removal increased with acid concentration and adsorbent amount. The maximum adsorption capacity of chitosan beads is 87.26 mg/g. Adsorption behavior of the chitosan beads were examined by Langmuir and Freundlich isotherms and pseudo-first and second-order kinetic models. The adsorption process was optimized by the response surface method (RSM). Trial version of Design Expert® 12.0 was used in the study. It has been understood as a result of the RSM statistical analysis that higher phosphate removal values would be obtained by increasing the amount of adsorbent. ANOVA analysis showed that adsorbent dosage had the biggest effect on removal of phosphate using chitosan beads prepared for adsorption.
Keywords: Water, Chitosan, Phosphate removal, Adsorption, Optimization
Introduction
Due to climate change, pollution in lake and seawaters as a result of increasing water temperatures causes a serious threat to people and the environment. Phosphate is necessary for the growth of living things, but its excessive presence in the waters induces gigantism of algae, bacteria, and aquatic plants. Phosphate is used in different fields such as fertilizers, medicine, detergents, animal feeds, corrosion inhibitors, and cosmetics (Harech et al., 2022). Overdischarge of phosphate from domestic and industrial wastewater and agricultural activities to lakes and seas blocks sunlight. Failure of sunlight to reach the bottom of lakes and seas causes a serious environmental problem such as eutrophication (Xu et al., 2021, Banu et al., 2020, Chen et al., 2020, Omwene & Kobya, 2018). Thirty-two to seventy percent of the amount of phosphate results from detergents in the urban sewage water. In recent years, consumption habits have changed in the COVID-19 epidemic, and excessive use of detergent has caused eutrophication in freshwater resources and seawaters. It is evidenced that the formation of harmful algal bloom (HAB) in lakes and seas has increased due to climate change (Sha et al., 2021). HABs growing in water with excessive phosphate undo aquatic ecosystems irreparably. The threats posed by HABs are mucilage, water discoloration, depletion of oxygen at the bottom, and mass death of bios in aquatic ecosystems. Therefore, discharge of phosphate into the water systems should be prevented (Mackay et al., 2022).
The removal of phosphate from wastewater has been studied for years (Eltaweil et al., 2021). The conventional treatment methods such as biological and chemical techniques are restricted due to the costs of investment and operation, requiring high energy, and the formation of secondary pollutants like the sludge (Pap et al., 2020; Tao et al., 2020). For these reasons, environmentally friendly, sustainable, and innovative approaches like bioremediation, membrane techniques, ion exchange, and adsorption have been developed in recent years (Cheng et al., 2018). Adsorption that has a lower production cost and higher efficiency is preferred as an energy-friendly technique (Eltaweil et al., 2021; Shirazinezhad et al., 2021; Verma & Nadagouda, 2021; Zhao et al., 2020). Adsorbent selection in the adsorption method is an important point. A lot of adsorbents such as metal oxides (Shirazinezhad et al., 2021), graphene (Verma & Nadagouda, 2021), clay (Banu et al., 2020; Chen et al., 2020), active carbon (Han et al., 2020, Karthikeyan et al., 2020), nanocomposite (Yang et al., 2021; Zhou et al., 2014), biochar (Tao et al., 2020; Zhou et al., 2013), and chitosan (Liu et al., 2020, Pap et al., 2020, Mackay et al., 2022; Kong et al., 2023) are used for phosphate removal from water. In literature, it has been seen that the adsorption property of chitosan is increased by modifying it with different materials. The cost of adsorbent would increase with these processes. The adsorbents of biochar modified with chitosan have great availability as green material at lower costs (Zhou et al., 2013). There are studies for phosphate removal with cross-linked pure chitosan also (Filipkowska et al., 2014). In this study, the use of pristine chitosan and rising of adsorption efficiency with the RSM method are significant and notable in terms of sustainability and economy. In the literature, adsorbents are good but have limitations for trace amounts. It is requested a higher adsorption efficiency for lower phosphate concentrations (Liu et al., 2020). Chitosan is a sustainable, nontoxic, biocompatible, economic, and environmentally friendly material and has high adsorption ability. Chitosan is like a shining material in different areas such as medical, environmental, industrial, pharmaceutical, and wastewater treatment (Eltaweil et al., 2021). Chitosan is a plentiful and low-cost material. Chitosan contains high amounts of amino and hydroxyl functional groups, These functional groups directly affect the adsorption capacity of chitosan, especially amino groups which are strongly active for the adsorption process. The electron pair on the amino groups of chitosan act as an adsorption center (Wang & Zhuang, 2017, Salehi et al., 2022).
Therefore, it draws attention (Filipkowska et al., 2014, Mackay et al., 2022, Liu et al., 2020, Oktor & Hilmioglu, 2021). In this study, adsorbent spheres were prepared in the laboratory. Adsorption tests were performed with 0.1 g, 0.3 g, and 0.5 g chitosan adsorbent spheres at 25 °C for 0.5 mg/L, 1 mg/L, and 1.5 mg/L phosphate concentrations. The operating conditions were determined by optimization with the response surface method (RSM) to achieve high removal rates in waters with different phosphate concentrations untested. Accordingly it has been understood that high adsorption efficiency can be obtained with chitosan for low phosphate concentrations.
Materials and Method
Chitosan, epichlorohydrin, NaOH, NaH2PO4, and vanadate-molybdate reactives were supplied from Sigma-Aldrich. In this study, adsorptive beads were prepared with chitosan natural biopolymer to adsorb phosphate in the water. Before and after adsorption, phosphate concentration in the synthetic phosphate solutions was determined by UV–Vis spectrometer using vanadate-molybdate reagent. The adsorption process is optimized with RSM statistical analysis. Trial version of Design Expert® 12.0 was used in this study.
Adsorptive chitosan beads were prepared in the laboratory. 1% wt. chitosan solution is prepared by mixing with 1% wt. acetic acid. It was cross-linked with 0.25% wt. epichlorohydrin. After that, chitosan sphere beads are prepared by dropping the polymer solution into 2 M NaOH solution. The beads are stirred in a 2 M NaOH solution for a long time to be stable. Then it is washed with pure water. The beads are dried at room temperature and then at 70 °C in the oven.
Synthetic phosphate solution is prepared with NaH2PO4 and water. The stock phosphate solution is obtained by dissolving NaH2PO4 salt in water. 1 M stock solution is prepared by dissolving a constant amount of solid salt in 1 L distilled water. Different solution concentrations (mg/L) are prepared by diluting this solution.
Solution concentration is determined by using a UV–Vis spectrometer. The solution is colored by vanadate-molybdate reagent, and the UV absorbance value is read at 400 nm. The absorbance-concentration calibration curve is prepared. Solution concentrations are determined with the curve.
Batch adsorption operations were made as described in the following procedure. The amount of solution was taken as 50 mL; the dosages of adsorbent were taken as 0.1 g, 0.3 g, and 0.5 g; and the concentrations of solution were taken as 0.5 mg/L, 1 mg/L, and 1.5 mg/L.
Adsorption experiments were made at 25 °C temperature during 45 min. The removal was calculated in Eq. 1.
| 1 |
In Eq. 1, C0 and C show the solution concentration before adsorption and after adsorption, respectively.
The adsorption behavior of the beads was investigated by adsorption isotherms and adsorption kinetic models. The adsorption isotherm models were investigated to approve the adsorption operation. Due to popularity, Langmuir and Freundlich models were studied in this study. Langmuir isotherm model equation is given in Eq. 2.
| 2 |
In Eq. 2, qe is the adsorbed amount per adsorbent (mg/g), Ce is the equilibrium concentration of solution (mg/L), qm is the maximum adsorbed amount (mg/g), and kL and b are the constant. The constants are determined from slope and intercept of the 1/qe versus 1/Ce graph. A dimensionless parameter kL is given in Eq. 3 also.
| 3 |
C0 is the initial concentration of solution (mg/L) in Eq. 3. Freundlich isotherm model equation is given in Eq. 4.
| 4 |
The terms in Eq. 4 are as follows: qe is the adsorbed amount per adsorbent (mg/g), Ce is the equilibrium concentration of solution mg/L), and kF and n are the constants. The constants are determined from slope and intercept of the log qe versus log Ce graph. At equilibrium condition, qe (mg/g) is given in Eq. 5 (Tümkor, 2018, Ilgen & Dulger, 2016).
| 5 |
C0 is the initial concentration of solution (mg/L), Ce is the equilibrium concentration of solution (mg/L), v is the solution volume (l), and m is the adsorbent amount (gr) in Eq. 5. Adsorption mechanism is explained by kinetic model equations. Lagergren pseudo-first-order and pseudo-second-order models were investigated for the adsorption operation in this study. Lagergren pseudo-first-order model equation is as seen in Eq. 6.
| 6 |
In Eq. 6, qe and qt are adsorption capacity at equilibrium (mg/g) and adsorption capacity at any t time (mg/g), respectively. k1 is a pseudo-first-order model constant (h−1). Theoretical qe and k1 are obtained from the graph log (qe − qt) versus t as intercept and slope, respectively. Lagergren pseudo-second-order model equation is as seen in Eq. 7.
| 7 |
In Eq. 7, qe and qt are adsorption capacity at equilibrium (mg/g), and adsorption capacity at any t time (mg/g), respectively. k2 is a pseudo-second-order model constant (h−1). Theoretical qe and k2 are obtained from the graph t/qt versus t as slope and intercept, respectively (Ilgen, 2014; Tümkor, 2018).
Optimization of an experimental process can be made by the response surface method. The response surface method (RSM) is a mathematical and statistical technique. Response surface methodology has been successfully used for many years (Aydar, 2018). The RSM is a statistical method. Modeling is done by analyzing the response to independent variables that are called factors; the answers to different variables are determined by the model equation that is obtained by the method. It is ensured that the results are predicted without further experimentation. Therefore, time and process cost are decreased by optimization (Hilmioğlu, 2022). The Box-Behnken design model is one method of the response surface method (RSM) and used widely (Hilmioglu et al., 2021). In this study, experimental data was examined by the Box-Behnken method.
The response surface method shows what the results would be under operation conditions where experimental work cannot be performed. The variables affecting the removal rate can be found with the RSM. In this study, variables as factors are concentration, adsorbent amount, and time, while the result as response is removal rate. The variable that most affects the removal is determined.
Results and Discussion
Characterization of Chitosan Beads
The photo of the prepared chitosan beads is given in Fig. 1.
Fig. 1.

The images of chitosan beads
FT-IR and TGA analyses are given in Figs. 2 and 3.
Fig. 2.
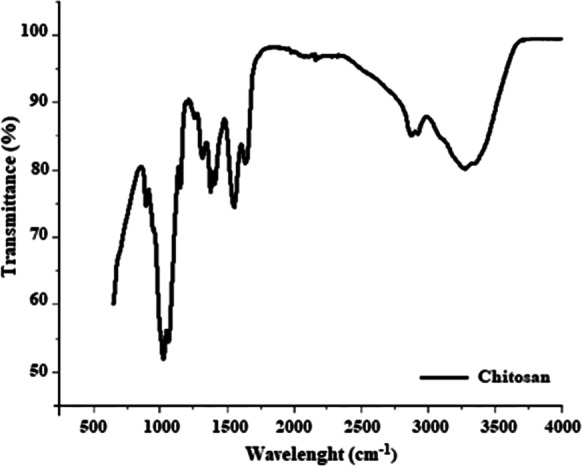
FT-IR analysis for the chitosan beads
Fig. 3.
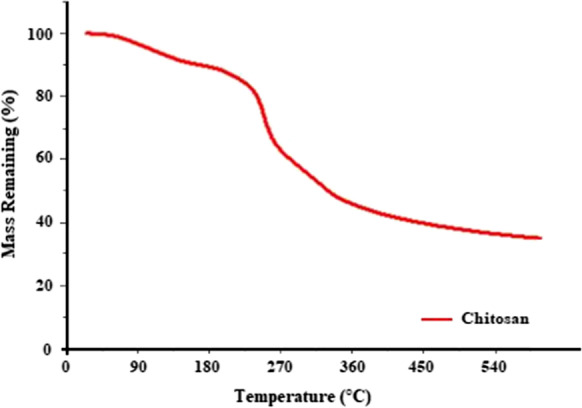
TGA analysis for the chitosan beads
Figure 2 shows the result of FT-IR analysis for the chitosan beads. The chitosan polymer characteristically contains hydroxyl, carbonyl, and amine groups. The peak in the 1150–1040 bands refers to the –C–O–C– group. The peaks in the 1560–1590 bands indicate the presence of NH- and NH2, respectively. The peaks in the 3400– 3500 and 1415–1320 bands indicate the presence of -OH and -CH, respectively. The peak around 1750 indicates the presence of the carbonyl group. The result of this analysis confirms the characteristic features of the chitosan when compared with the literature and proves that the chitosan adsorbent did not undergo any agglomeration during the preparation stage.
Figure 3 shows the result of TGA analysis for the chitosan beads. Thermogravimetric analysis of the chitosan bead was performed with a Mettler Toledo brand device at room temperature to 600 °C and a heating rate of 10 °C/min. As a result of the analysis, it was seen that the first mass loss started at 98–80 °C. The fact that the mass loss started at such a high temperature is a very good result for the phosphate removal experiment. The usability of the prepared adsorbent is suitable for this experiment by concluding that no problems will be encountered for the chitosan beads used at the temperatures where phosphate removal occurs.
Adsorption Tests
Because of the electrostatic interaction between phosphate and chitosan, it is emphasized that adsorption at acidic pH is more suitable. It is stated that the adsorption efficiency decreased at alkaline pH (Banu et al., 2020, Liu et al., 2020, Eltaweil et al., 2021). High phosphate removal value was obtained with cross-linked chitosan at pH 4 (Filipkowska et al., 2014).
During phosphate adsorption, protonated amino groups are electrostatically attracted to negatively charged phosphate ions (Zhang et al., 2018). pH is an important factor that directly affects the form of adsorption. At pH 5, the amino groups contained in chitosan are protonated in acidic solutions, and the adsorbent becomes positively charged. Thus, electrostatic attraction forms between positively charged chitosan and phosphate anions. The adsorption of phosphate becomes easier. As the pH increases, the adsorbent surface becomes negatively charged. This causes a reduction in adsorption due to the repulsion between the adsorbent charged negatively and negatively charged phosphate anions (Rajeswari et al., 2015).
Adsorption tests were made at different pH values such as pH 2–11, and the highest removal was obtained at 4.95, the pH of the solution itself. Therefore, tests were carried out at the solution’s own pH value of 4.95.
Figure 4 shows the relationship between time and removal. Adsorption was made for 3 h at 25° C with 1 mg/L phosphate solution by using 0.5 g adsorbent. The highest removal rate was reached in 45 min. After 45 min, removal decreased because the beads may have lowered their adsorption ability. Therefore, important removal was not observed in the 120th and 180th min. As a result, adsorption time was determined as 45 min.
Fig. 4.
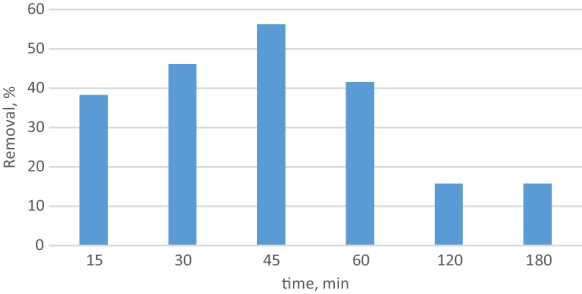
Removal versus time
Adsorbent dosage effect on removal was investigated. Adsorption was carried out for 45 min at 25 °C with 1 mg/L phosphate solution by using 0.1 g, 0.3 g, and 0.5 g adsorbent. The highest removal rate was reached by using 0.5 g adsorbent dosage. Figure 5 shows the relationship between adsorbent dosage and removal. As the amount of adsorbent increases, the removal rate also increases.
Fig. 5.

Removal versus adsorbent dosage
Since the accessibility to the empty areas on the adsorbent surface increased, the removal ratio increased as the adsorbent amount increased (Banu et al., 2020). To see the solution concentration effect on removal, adsorption was carried out for 45 min at 25 °C with 0.5 mg/L, 1 mg/L, and 1.5 mg/L phosphate solution by using 0.5 g adsorbent. The highest removal rate was reached with 1.5 mg/L solution concentration. Figure 6 shows the relationship between solution concentration and removal. Removal values obtained for 1 mg/L and 1.5 mg/L phosphate solution concentrations were approximate values. The removal increased with increasing solution concentration. In order to achieve high efficiency at low concentrations by chitosan, the adsorbent dosage should be increased. Increasing the amount of chitosan in the adsorbent beads is another option.
Fig. 6.
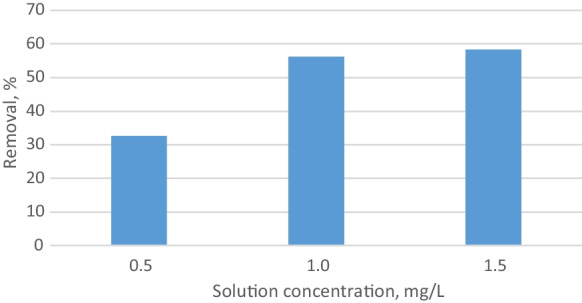
Removal versus solution concentration
Chitosan is a nitrogen-containing biosorbent. It can bind and sorb anionic pollutants by means of various processes like hydrogen bonding, ion exchange, Van der Waals forces, and molecular interactions. These mechanisms increase the adsorption affinity and ability of chitosan for phosphate. The free amine groups in chitosan cause higher adsorption capacity. There is great interest in the positively charged adsorbent surface to adsorb negatively charged phosphate ions. Therefore, chitosan was chosen as adsorbent material for phosphate removal (Filipkowska et al., 2014; Liu et al., 2020). The removal mechanism between adsorbent chitosan and polluting phosphate ions is electrostatic attraction of phosphate ions with chitosan’s amine groups.
Comparison of Results with Literature
In this study, the maximum adsorption capacity of chitosan beads is 87.26 mg/g. In 45 min, 56.2% removal was obtained for 1 mg/L phosphate solution using 0.5 g adsorbent.
Mohammadi et al. used biochar obtained from Rosmarinus officinalis leaves for phosphate removal from wastewater. They investigated the adsorption capacity depending on the phosphate concentration and the effect of PH. They obtained the maximum adsorption capacity of 78.24 mg/g and 67% removal ratio. Adsorption is pH dependent and increased in acidic environments (Mohammadi et al., 2021). Atnafu and Leta produced Fe3O4 clay polymer nanocomposites based on plasticized magnetic starch and used them for phosphate removal from aqueous solutions. The effects of solution pH, adsorbent concentration, and amount of adsorbent on phosphate removal were investigated. They achieved 45–95% removal efficiency at pH 6. They observed that phosphate adsorption increased when the pH was increased from 3 to 7. They observed that adsorption increased as the amount of adsorbent increased (Atnafu & Leta, 2021). Zhang et al. produced La/Ca-loaded adsorbents from modified wheat straw for phosphate removal. They obtained 84.72 mg/g adsorption capacity for phosphate removal and 85% removal ratio. They obtained a good adsorption capacity between pH 3 and 10 (Zhang et al., 2023).
Isotherms and Kinetic Models
Langmuir isotherm is given in Fig. 7.
Fig. 7.

Langmuir isotherm
From Langmuir isotherm, kL was estimated as 0.0683. If this value is between 0 and 1, the adsorption isotherm suits the Langmuir isotherm model. b was estimated as 13.627 also.
Freundlich isotherm is given in Fig. 8.
Fig. 8.
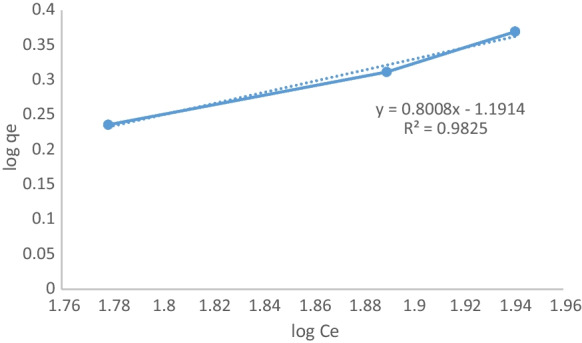
Freundlich isotherm
From Freundlich isotherm, n value was found as 1.248. Because n is greater than one, the adsorption isotherm also suits the Freundlich isotherm model. kF value was found as 0.0643. In Table 1 isotherm constants are seen.
Table 1.
Isotherm constants
| Langmuir | Freundlich | ||||
|---|---|---|---|---|---|
| kL | b | R2 | kF | n | R2 |
| 0.0683 | 13.627 | 1 | 0.0643 | 1.248 | 0.9825 |
Although the data seems to be suitable for both isotherms, it is understood that experimental values are compatible with the Langmuir isotherm since the R2 value is the bigger one. The pseudo-first-order kinetic is given in Fig. 9.
Fig. 9.

Pseudo-first-order kinetic
The calculated qe value is close to the experimental qe value, and the R2 value is close to one. This situation indicates the suitableness of the adsorption kinetics to the pseudo-first-order kinetics. The pseudo-second-order kinetic is given in Fig. 10.
Fig. 10.
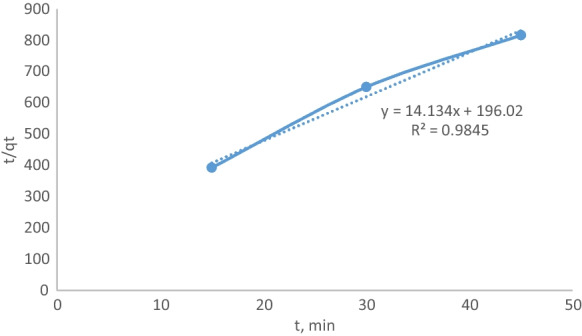
Pseudo-second-order kinetic
Though the R2 value is close to one, the calculated qe value is not close to the experimental qe value. This situation indicates that the adsorption kinetics are not proper to the pseudo-second-order kinetics. In Table 2, kinetic parameters are given.
Table 2.
Kinetic parameters
| Pseudo-first-order | Pseudo-second-order | |||||
|---|---|---|---|---|---|---|
| qe experimental | k1 | qe theoretical | R2 | k2 | qe theoretical | R2 |
| 0.45 | 1.38 × 10⁻³ | 0.421 | 0.9959 | 1.021 | 0.0707 | 0.9845 |
The experimental and calculated qe values were close to each other, and R2 was bigger; these situations indicate that the data were suitable with the pseudo-first-order kinetic model.
Statistical Analysis Results
In this study, the factors were adsorbent dosage (A), solution concentration (B), and time (C). Response was adsorption removal (%). The Design Expert Program that used the Box-Behnken method suggested 17 experiments for the selected factors. Factors and responses obtained by adsorption experiments were entered to the program.
The model suggested by the program is given in Table 3. Linear model has the smallest p value and the biggest sum of squares. Therefore, it was selected for the following procedure.
Table 3.
Fitting models
| Source | Sum of squares, SS | Degree of medium, df | Mean square | F value | p value | |
|---|---|---|---|---|---|---|
| Mean vs total | 13,060.56 | 1 | 13,060.56 | |||
| Linear vs mean | 3159.65 | 3 | 1053.22 | 49.92 | < 0.0001 | Suggested |
| 2FI vs linear | 120.08 | 3 | 40.03 | 2.60 | 0.1105 | |
| Quadratic vs 2FI | 104.02 | 3 | 34.67 | 4.84 | 0.0395 | Suggested |
| Cubic vs quadratic | 50.18 | 3 | 16.73 | Aliased | ||
| Residual | 0.0000 | 4 | 0.0000 | |||
| Total | 16,494.48 | 17 | 970.26 |
Values in bold indicate linear vs Mean and Quadratic vs 2FI
In Table 3, F value of the model should be bigger than 4. In this respect, the linear model is a more suitable model. ANOVA analysis of the linear model is given in Table 4.
Table 4.
ANOVA variance analysis for linear model
| Source | Sum of squares, SS | Degree of medium, df | Mean square | F value | p value | |
|---|---|---|---|---|---|---|
| Model | 3159.65 | 3 | 1053.22 | 49.92 | < 0.0001 | Significant |
| A—Adsorbent dosage (g) | 1940.65 | 1 | 1940.65 | 91.98 | < 0.0001 | |
| B—Solution concentration (mg/L) | 905.25 | 1 | 905.25 | 42.91 | < 0.0001 | |
| C—Time (minute) | 313.75 | 1 | 313.75 | 14.87 | 0.0020 | |
| Residual | 274.28 | 13 | 21.10 | |||
| Lack of fit | 274.28 | 9 | 30.48 | |||
| Pure error | 0.0000 | 4 | 0.0000 | |||
| Cor total | 3433.92 | 16 |
The factor with the highest F value has the highest effect on the response. The values of F, p, and sum of squares (SS) point to the significance of the model. When the SS rises, the significance of that factor rises. Because the adsorbent dosage has the highest SS and F values, it is understood that the adsorbent dosage shows the biggest effect on removal of phosphate by adsorption using chitosan beads prepared. It is necessary for the value of p in the table to be less than 0.05 for model compliance. The suitability of the value of p indicates that compatibility of the experimental data and the model data is at 95% confidence interval. It has been seen that the data obtained from linear models are 95% reliable. Table 4 also shows the probability values for each factor in the model. Factors with p values bigger than 0.10 are not suitable for the model. It can be said that all the factors adsorbent dosage, solution concentration, and time are favorable for adsorption operation. Fit statistics are given in Table 5.
Table 5.
Fit statistics
| Standard deviation | 4.59 | R2 | 0.9201 |
| Mean | 27.72 | Adjusted R2 | 0.9017 |
| C.V. % | 16.57 | Predicted R2 | 0.8422 |
| Adequate precision | 23.5293 |
The experimental results are evaluated with model results by the p value proposed by the program, the model regression coefficient R2, adequate precision, adjusted regression coefficient R2, and predicted regression coefficient R2 values. The cases that the p value is under than 0.05, the adequate precision that is representing the signal to noise ratio value is bigger than 4, and the difference there among the adjusted regression coefficient and the predicted regression coefficient is under than 0.2 indicate the fit of the model. The closer the R2 value to 1, the more suitable the model. When Table 5 is evaluated, it is understood that the R2 (0.9201) is closer to 1, the difference of adjusted R2 (0.9017) and predicted R2 (0.8422) is less than 0.2, and the adequate precision (23.5293) is bigger than 4. In this situation, the linear model proposed by the program can be said to be a quite proper model. The equation of the linear model proposed by the model is given in Eq. 8. The effects of all factors are seen in the equation.
| 8 |
The plot of diagnostics of predicted vs actual responses is given in Fig. 11.
Fig. 11.

Diagnostic plots of predicted vs actual responses
The data values should not have large deviations for comparison of actual and predicted values. If the data is close to the black linear line, the actual and predicted values are close to each other. In Fig. 11, there is no excessive deviation. This indicates that the program presented a compatible model with experimental data. The plot of Cook’s distance versus run number is given in Fig. 12. The Cook’s distance value versus run number should be below 1. The Cook’s distance value shown in Fig. 12 is lower than 1. It is stated that the data have anticipated Cook’s distance range.
Fig. 12.

Plot of Cook’s distance vs runs
A 2D contour graph and a 3D surface graph can be drawn in the linear model. The plot in Fig. 13 is the linear model contour graphic. The contour chart makes toning gradually. The relationship between adsorbent dosage and solution concentration on removal ratio were plotted. A two-dimensional surface plot is a two-dimensional contour plot of the two factors on responses. According to contour plot, as adsorbent dosage and solution concentration increase, removal in the adsorption increases also.
Fig. 13.

2D contour plot of adsorbent dosage and solution concentration on removal
A 3-dimensional surface plot is a three-dimensional plot of the two factors on responses, while one factor is constant. A three-dimensional surface plot shows relation between factors. The dependence of a factor that is constant on other factors is seen, while the other two factors are changed. In Fig. 14, the change of adsorption removal was observed by solution concentration and adsorbent dosage factors when the time factor was kept constant. Adsorbent dosage and solution concentration have the same effect on removal in 3D plot also as seen 2D plot.
Fig. 14.

3D surface plot of adsorbent dosage and solution concentration on removal
It is seen that from Figs. 13 to. 14, the adsorption removal is enhanced by the solution concentration and adsorbent dose enhancement. A report of the model is presented in Table 6. In this report, the experimental data and the model data obtained in the program are compared. The values deviated from Cook’s distance and DFFITS values are shown in color. Cook’s distance and DFFITS values should be less than 1.
Table 6.
Report on linear model
| Run order | Actual value | Predicted value | Residual | Leverage | Internally studentized residuals | Externally studentized residuals | Cook’s distance | Influence on fitted value DFFITS |
|---|---|---|---|---|---|---|---|---|
| 1 | 51.40 | 53.93 | − 2.53 | 0.309 | − 0.663 | − 0.648 | 0.049 | − 0.433 |
| 2 | 8.90 | 10.82 | − 1.92 | 0.309 | − 0.502 | − 0.487 | 0.028 | − 0.326 |
| 3 | 45.80 | 44.62 | 1.18 | 0.309 | 0.310 | 0.299 | 0.011 | 0.200 |
| 4 | 23.70 | 32.66 | − 8.96 | 0.309 | − 2.345 | − 2.966 | 0.614 | − 1.983(1) |
| 5 | 8.90 | 5.88 | 3.02 | 0.309 | 0.791 | 0.779 | 0.070 | 0.521 |
| 6 | 56.20 | 49.56 | 6.64 | 0.309 | 1.740 | 1.909 | 0.338 | 1.276 |
| 7 | 15.80 | 22.78 | − 6.98 | 0.309 | − 1.828 | − 2.037 | 0.373 | − 1.362 |
| 8 | 30.30 | 27.72 | 2.58 | 0.059 | 0.580 | 0.564 | 0.005 | 0.141 |
| 9 | 38.20 | 37.03 | 1.17 | 0.309 | 0.306 | 0.295 | 0.010 | 0.197 |
| 10 | 30.30 | 27.72 | 2.58 | 0.059 | 0.580 | 0.564 | 0.005 | 0.141 |
| 11 | 14.50 | 18.41 | − 3.91 | 0.309 | − 1.023 | − 1.025 | 0.117 | − 0.685 |
| 12 | 30.30 | 27.72 | 2.58 | 0.059 | 0.580 | 0.564 | 0.005 | 0.141 |
| 13 | 30.50 | 32.09 | − 1.59 | 0.309 | − 0.417 | − 0.403 | 0.019 | − 0.270 |
| 14 | 30.30 | 27.72 | 2.58 | 0.059 | 0.580 | 0.564 | 0.005 | 0.141 |
| 15 | 5.70 | 1.51 | 4.19 | 0.309 | 1.098 | 1.108 | 0.135 | 0.741 |
| 16 | 20.10 | 23.34 | − 3.24 | 0.309 | − 0.849 | − 0.839 | 0.081 | − 0.561 |
| 17 | 30.30 | 27.72 | 2.58 | 0.059 | 0.580 | 0.564 | 0.005 | 0.141 |
When DFFITS (difference in fits) are looked at, there is only one value in colorful in Table 6. That means it exceeded the limit; it can be ignored because it could not put at risk the fit of the model. Cook’s distance values are also below 1. It is seen that from the report table, the model is valid.
Conclusion
The phosphate removal from water by adsorption was done by chitosan beads prepared. Acid concentration and adsorbent dosage had effects on the removal of the phosphate.
The experimental data were suitable with the Langmuir isotherm model and pseudo-first-order kinetic model. The modeling was made with the Box-Behnken method; modeling has shown that the linear model is the compatible model for the experimental data.
In this study, 56.2% highest removal was obtained for 1 mg/L phosphate solution in 45 min when 0.5 g adsorbent was used. According to the results obtained with RSM, the highest removal of phosphate is obtained as 88.49% for phosphate solution concentration is 1 mg/L and adsorbent dosage is 1 g, when the time is 45 min. It is determined that by optimization, the phosphate removal value would increase by 57.45% for the same phosphate concentration that is 1 mg/L at the same time that is 45 min, when the adsorbent dosage is increased by 100% from 0.5 to 1 g.
Data Availability
The datasets used and/or analyzed during the current study are available from the corresponding author upon reasonable request.
Declarations
Ethics Declarations
Not applicable.
Conflict of Interest
The authors declare no competing interests.
Footnotes
Publisher's Note
Springer Nature remains neutral with regard to jurisdictional claims in published maps and institutional affiliations.
Contributor Information
Kadriye Oktor, Email: oktor@kocaeli.edu.tr.
Nilufer Hilmioglu, Email: niluferh@kocaeli.edu.tr.
References
- Atnafu T, Leta S. Plasticized magnetic starch-based Fe3O4 clay polymer nanocomposites for phosphate adsorption from aqueous solution. Heliyon. 2021;7(9):e07973. doi: 10.1016/j.heliyon.2021.e07973. [DOI] [PMC free article] [PubMed] [Google Scholar]
- Aydar A.Y. (2018). Utilization of response surface methodology in optimization of extraction of plant materials, Silva, V. (Eds) Statistical approaches with emphasis on design of experiments applied to chemical processes (10th ed., pp. 157–169). Intech
- Banu HAT, Karthikeyan P, Vigneshwaran S, Meenakshi S. Adsorptive performance of lanthanum encapsulated biopolymer chitosan-kaolin clay hybrid composite for the recovery of nitrate and phosphate from water. International Journal of Biological Macromolecules. 2020;154:188–197. doi: 10.1016/j.ijbiomac.2020.03.074. [DOI] [PubMed] [Google Scholar]
- Chen H, Lu C, Yang H. Lanthanum compounds-modified rectorite composites for highly efficient phosphate removal from wastewater. Applied Clay Science. 2020;199:105875. doi: 10.1016/j.clay.2020.105875. [DOI] [Google Scholar]
- Cheng R, Shen L-J, Zhang Y-Y, Dai D-Y, Zheng X, Liao L-W, Wang L, Shi L. Enhanced phosphate removal from water by honeycomb-like microporous lanthanum-chitosan magnetic spheres. Water. 2018;10:1659. doi: 10.3390/w10111659. [DOI] [Google Scholar]
- Eltaweil AS, Omer AM, El-Aqapa HG, Gaber NM, Attia NF, El-Subruiti GM, Mohy-Eldin MS, Abd El-Monaem EM. Chitosan based adsorbents for the removal of phosphate and nitrate: A critical review. Carbohydrate Polymers. 2021;274:118671. doi: 10.1016/j.carbpol.2021.118671. [DOI] [PubMed] [Google Scholar]
- Filipkowska, U., Jóźwiak, T., & Szymczyk, P. (2014). Application of cross-linked chitosan for phosphate removal from aqueous solutions progress on chemistry and application of chitin and its derivatives. XIX. 10.15259/PCACD.19.01
- Han T, Lu X, Sun Y, Jiang J, Yang W, Jönsson PG. Magnetic bio-activated carbon production from lignin via a streamlined process and its use in phosphate removal from aqueous solutions. Science of the Total Environment. 2020;708:135069. doi: 10.1016/j.scitotenv.2019.135069. [DOI] [PubMed] [Google Scholar]
- Harech MA, Dabbebi R, Abouliatim Y, Elhafiane Y, Smith A, Mesnaoul M, Niboue L, Baklouti S. A comparative study of the thermal behaviour of phosphate washing sludge from Tunisia and Morocco. Journal of Thermal Analysis and Calorimetry. 2022;147:5677–5686. doi: 10.1007/s10973-021-10936-7. [DOI] [Google Scholar]
- Hilmioğlu N. Optimization of synthesis of ethyl acetate by response surface method and investigation of reactive sorption effect of hydrogel in synthesis. The European Journal of Science and Technology (EJOSAT) 2022;35:94–101. doi: 10.31590/ejosat.1061611. [DOI] [Google Scholar]
- Hilmioglu N, Balaban E, Yavas B, Kurtuldu F. Application of optimization of adsorption by response surface method. Kocaeli University; 2021. [Google Scholar]
- Karthikeyan P, Sirajudheen P, Nikitha MR, Meenakshi S. Removal of phosphate and nitrate via a zinc ferrite@activated carbon hybrid composite under batch experiments: study of isotherm and kinetic equilibriums. Environmental Nanotechnology, Monitoring & Management. 2020;14:100378. doi: 10.1016/j.enmm.2020.100378. [DOI] [Google Scholar]
- Kong H, Li Q, Zheng X, Chen P, Zhang G, Huang Z. Lanthanum modified chitosan-attapulgite composite for phosphate removal from water: Performance, mechanisms and applicability. International Journal of Biological Macromolecules. 2023;224:984–997. doi: 10.1016/j.ijbiomac.2022.10.183. [DOI] [PubMed] [Google Scholar]
- Liu B, Yu Y, Han Q, Lou S, Zhang L, Zhang W. Fast and efficient phosphate removal on lanthanum-chitosan composite synthesized by controlling the amount of cross-linking agent. International Journal of Biological Macromolecules. 2020;157:247–258. doi: 10.1016/j.ijbiomac.2020.04.159. [DOI] [PubMed] [Google Scholar]
- Mackay SE, Malherbe F, Eldridge DS. Quaternary amine functionalized chitosan for enhanced adsorption of low concentration phosphate to remediate environmental eutrophication. Colloids and Surfaces A: Physicochemical and Engineering Aspects. 2022;653:129984. doi: 10.1016/j.colsurfa.2022.129984. [DOI] [Google Scholar]
- Ilgen O. Adsorption of oleic acid from sunflower oil on Amberlyst A26 (OH) Fuel Processing Technology. 2014;118:69–74. doi: 10.1016/j.fuproc.2013.08. [DOI] [Google Scholar]
- Ilgen O, Dulger HS. Removal of oleic acid from sunflower oil on zeolite 13X: Kinetics, equilibrium and thermodynamic studies. Industrial Crops and Products. 2016;81:66–71. doi: 10.1016/j.indcrop.2015.11.050. [DOI] [Google Scholar]
- Mohammadi R, Hezarjaribi M, Ramasamy DL, Sillanpää M, Pihlajamäki A. Application of a novel biochar adsorbent and membrane to the selective separation of phosphate from phosphate-rich wastewaters. Chemical Engineering Journal. 2021;407:126494. doi: 10.1016/j.cej.2020.126494. [DOI] [Google Scholar]
- Oktor, K., & Hilmioglu, N. (2021). Removal of ammonium from aqueous solutions by adsorption processes using environment friendly natural biopolymer chitosan. Fresenius Environmental Bulletin, 30(2A), 1970–1976. Retrieved from: https://www.scopus.com/record/display.uri?eid=2-s2.0-85101387396&origin=resultslist. Accessed 19 Jun 2023
- Omwene PI, Kobya M. Treatment of domestic wastewater phosphate by electrocoagulation using Fe and Al electrodes: A comparative study. Process Safety and Environmental Protection. 2018;116:34–51. doi: 10.1016/j.psep.2018.01.005. [DOI] [Google Scholar]
- Pap S, Kirk C, Bremner B, Sekulic MT, Shearer L, Gibb SW, Taggart MA. Low-cost chitosan-calcite adsorbent development for potential phosphate removal and recovery from wastewater effluent. Water Research. 2020;173:115573. doi: 10.1016/j.watres.2020.115573. [DOI] [PubMed] [Google Scholar]
- Rajeswari A, Amalraj A, Pius A. Removal of phosphate using chitosan-polymer composites. Journal of Environmental Chemical Engineering. 2015;3:2213–3437. doi: 10.1016/j.jece.2015.08.022. [DOI] [Google Scholar]
- Salehi E, Khajavian M, Sahebjamee N, Mahmoudi M, Drioli E, Matsuura T. Advances in nanocomposite and nanostructured chitosan membrane adsorbents for environmental remediation: a review. Desalination. 2022;527:115565. doi: 10.1016/j.desal.2022.115565. [DOI] [Google Scholar]
- Sha J, Xiong H, Li C, Lu Z, Zhang J, Zhong H, Zhang W, Yan B. Harmful algal blooms and their eco-environmental indication. Chemosphere. 2021;274:129912. doi: 10.1016/j.chemosphere.2021.129912. [DOI] [PubMed] [Google Scholar]
- Shirazinezhad M, Faghihinezhad M, Baghdadi M, Ghanbari M. Phosphate removal from municipal effluent by a porous MgO-expanded graphite composite as a novel adsorbent: evaluation of seawater as a natural source of magnesium ions. Journal of Water Process Engineering. 2021;43:102232. doi: 10.1016/j.jwpe.2021.102232. [DOI] [Google Scholar]
- Tao X, Huang T, Lv B. Synthesis of Fe/Mg-biochar nanocomposites for phosphate removal. Materials. 2020;13:816. doi: 10.3390/ma13040816. [DOI] [PMC free article] [PubMed] [Google Scholar]
- Tümkor E., (2018). “Investigation of adsorption of oleic acid from sunflower oil by using Amberlyst 21 as an adsorbent”, MSc Thesis, Kocaeli University, Institute of Science, Chemical Engineering, Kocaeli
- Verma S, Nadagouda MN. Graphene-based composites for phosphate removal. ACS Omega. 2021;6:4119–4125. doi: 10.1021/acsomega.0c05819. [DOI] [PMC free article] [PubMed] [Google Scholar]
- Wang J, Zhuang S. Removal of various pollutants from water and wastewater by modified chitosan adsorbents. Critical Reviews in Environmental Science and Technology. 2017;47:2331–2386. doi: 10.1080/10643389.2017.1421845. [DOI] [Google Scholar]
- Xu W, Zheng W, Wang F, Xiong Q, Shic XL, Kalkhajeh YK, Xu G, Gao H. Using iron ion-loaded aminated polyacrylonitrile fiber to efficiently remove wastewater phosphate. Chemical Engineering Journal. 2021;403:126349. doi: 10.1016/j.cej.2020.126349. [DOI] [Google Scholar]
- Yang W, Shi X, Dong H, Tang H, Chen W, Wu M, Hua M, Zhang W. Fabrication of a reusable polymer-based cerium hydroxide nanocomposite with high stability for preferable phosphate removal. Chemical Engineering Journal. 2021;405:126649. doi: 10.1016/j.cej.2020.126649. [DOI] [Google Scholar]
- Zhang B, Chen N, Feng C, Zhang Z. Adsorption for phosphate by crosslinked/non-crosslinked-chitosan-Fe(III) complex sorbents: Characteristic and mechanism. Chemical Engineering Journal. 2018;353:361–372. doi: 10.1016/j.cej.2018.07.092. [DOI] [Google Scholar]
- Zhang L, Feng M, Zhao D, Li M, Qiu S, Yuan M, Guo C, Han W, Zhang K, Wang F. La-Ca-quaternary amine-modified straw adsorbent for simultaneous removal of nitrate and phosphate from nutrient-polluted water. Separation and Purification Technology. 2023;304:122248. doi: 10.1016/j.seppur.2022.122248. [DOI] [Google Scholar]
- Zhao Y, Guo L, Shen W, An Q, Xiao Z, Wang H, Cai W, Zhai S, Li Z. Function integrated chitosan-based beads with throughout sorption sites and inherent diffusion network for efficient phosphate removal. Carbohydrate Polymers. 2020;230:115639. doi: 10.1016/j.carbpol.2019.115639. [DOI] [PubMed] [Google Scholar]
- Zhou Y, Gao B, Zimmerman AR, Chen H, Zhang M, Cao X. Biochar-supported zerovalent iron for removal of various contaminants from aqueous solutions. Bioresource Technology. 2014;152:538–542. doi: 10.1016/j.biortech.2013.11.021. [DOI] [PubMed] [Google Scholar]
- Zhou Y, Gao B, Zimmerman AR, Fang J, Sun Y, Cao X. Sorption of heavy metals on chitosan-modified biochars and its biological effects. Chemical Engineering Journal. 2013;231:512–518. doi: 10.1016/j.cej.2013.07.036. [DOI] [Google Scholar]
Associated Data
This section collects any data citations, data availability statements, or supplementary materials included in this article.
Data Availability Statement
The datasets used and/or analyzed during the current study are available from the corresponding author upon reasonable request.