Abstract
Introduction
Conduction system pacing (CSP), in the form of His bundle pacing (HBP) or left bundle branch pacing (LBBP), is emerging as valuable cardiac resynchronization therapy (CRT) delivery methods. However, patient selection and therapy personalization for CSP delivery remain poorly characterized. We aim to compare pacing-induced electrical synchrony during CRT, HBP, LBBP, HBP with left ventricular (LV) epicardial lead (HOT-CRT), and LBBP with LV epicardial lead (LOT-CRT) in patients with different conduction disease presentations using computational modeling.
Methods
We simulated ventricular activation on twenty-four four-chamber heart geometries including His-Purkinje systems with proximal left bundle branch block (LBBB). We simulated septal scar, LV lateral wall scar, and mild and severe myocardium and LV His-Purkinje system conduction disease by decreasing the conduction velocity (CV) down to 70% and 35% of healthy CV. Electrical synchrony was measured by the shortest interval to activate 90% of the ventricles (BIVAT-90).
Results
Severe LV His-Purkinje conduction disease favored CRT (BIVAT-90: HBP 101.5±7.8ms vs CRT 93.0±8.9ms, P<0.05), with additional electrical synchrony induced by HOT-CRT (87.6±6.7ms, P<0.05) and LOT-CRT (73.9±7.6ms, P<0.05). Patients with slow myocardium CV benefit more from CSP compared to CRT (BIVAT-90: CRT 134.5±24.1ms; HBP 97.1±9.9ms, P<0.01; LBBP: 101.5±10.7ms, P<0.01). Septal but not lateral wall scar made CSP ineffective, while CRT was able to resynchronize the ventricles in the presence of septal scar (BIVAT-90: baseline 119.1±10.8ms vs CRT 85.1±14.9ms, P<0.01).
Conclusion
Severe LV His-Purkinje conduction disease attenuates benefits of CSP, with additional improvements achieved with HOT-CRT and LOT-CRT. Septal but not lateral wall scar make CSP ineffective.
Keywords: Cardiac resynchronization therapy, Heart failure, His bundle pacing, Left bundle pacing, Conduction system pacing, left bundle branch block
Graphical Abstract
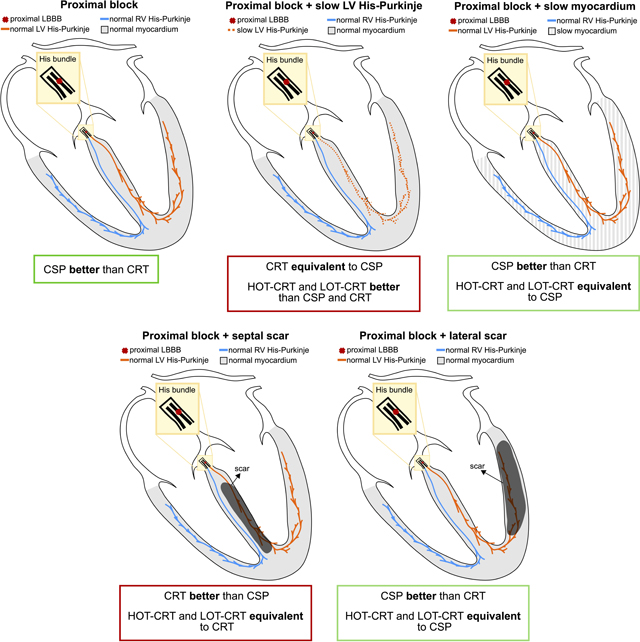
The yellow area represents the His bundle, with a proximal block (red cross) introduced along the strands going to the left bundle. The LV and the RV Purkinje system are represented in orange and the blue, and the ventricular myocardium is depicted in grey. Black areas in the two bottom images represent scar. Abbreviations as in Figure 1. Other abbreviations: CRT=cardiac resynchronization therapy, CSP = condution system pacing, HOT-CRT=His optimized CRT, LOT-CRT=LBBP optimized CRT.
Introduction
Cardiac resynchronization therapy (CRT) is one of the most effective treatments for heart failure (HF) with left bundle branch block (LBBB).1 However, between 30% and 50% of patients do not respond to therapy.1 Suboptimal response to standard CRT, delivered with one right ventricular (RV) lead and one left ventricular (LV) coronary venous lead, has been attributed to many factors, including operator experience, scar, intricate coronary sinus (CS) anatomy and suboptimal LV lead placement.1
Conduction system pacing (CSP), performed either through His bundle (HBP) or left bundle pacing (LBBP), has emerged as an effective alternative approach to deliver CRT in LBBB patients.2–5 Although clinical studies have shown HBP feasibility and efficacy2,6, HBP is challenging to deliver and results in high pacing thresholds.6 On the other hand, LBBP is easier to perform, does not result in high pacing thresholds,6 and leads to comparable synchrony to HBP when atrioventricular (AV) delay optimization is possible.7 However, not all patients benefit from CSP. For example, lower efficacy of CSP is reported in patients with diffuse rather than focal conduction disease.8 As access to CSP increases, it will be important to identify patients most likely to benefit from its delivery.
CSP relies on accessing the fast electrical conduction in the His-Purkinje system. In dogs, HF decreases the conduction velocity (CV) from 2.2 m/s to 1.5 m/s9 in the Purkinje system and may impact CSP outcomes. Septal scar at the base of the ventricles was also reported to cause failure to deliver LBBP.10 In patients not responding to standard CSP, His-optimized CRT (HOT-CRT) and left bundle-optimized (LOT-CRT), delivered as CSP in combination with an LV epicardial lead, have been proposed as alternative delivery methods to resynchronize the ventricles.11,12 Additional studies are needed to assess when CRT, HBP, LBBP, HOT-CRT and LOT-CRT are feasible and effective in different patient groups.
We aim to study the effect of different conduction disturbances on response to HBP, LBBP, CRT, HOT-CRT and LOT-CRT using computational modeling. Electrical activation of the ventricles was simulated on twenty-four HF meshes inclusive of a His-Purkinje system. Simulations were performed in the presence of proximal LBBB combined with normal LV His-Purkinje CV, slower LV His-Purkinje system CV, slower ventricular myocardium CV, and LV septal or lateral wall scar. Response to pacing was quantified by computing the reduction in ventricular activation times, and different pacing modalities were compared to determine whether CRT, CSP alone, or a combination of the two would lead to the best response.
Methods
Anatomical Models
In this study, we used twenty-four 1mm-resolution four-chamber heart meshes generated from HF patients from a previous study.13 The CT images used to generate the heart models were gathered as part of two CRT clinical trials (REC numbers 14/WM/1069 and 18/LO/0752) approved by the West Midlands Coventry and by the London-Harrow ethics committees, respectively. The CT datasets were analyzed anonymously. We included a His-Purkinje network on the LV and the RV based on Gillette et al.14 The His-Purkinje model accounts for the presence of three LV fascicles, one RV septal fascicle and the RV moderator band. More details about the His-Purkinje tree generation are provided in the Supplement.
Electrophysiology Simulations
We simulated ventricular electrical activation with an eikonal model.15 Ventricular myocardium was simulated as a transversely isotropic conducting tissue with CV of 0.6 m/s and 0.24 m/s along the fibers and the transverse direction, respectively, within ranges of healthy CV measured in mammals.16 CV along the Purkinje was set to 3.0 m/s.16–18 The CV of the individual fascicles was computed so that, during sinus rhythm, the activation wave reached the end of all three LV fascicles at the same time and 10 ms before the end of the two RV fascicles were activated to be consistent with the Durrer maps.19 This allowed us to time the first LV and RV activations during sinus rhythm. The Supplement shows a validation of the simulated activation patterns achieved at baseline against electrocardiographic imaging (ECGi) data. We also compared metrics for LV and BIV synchrony during baseline and selective HBP against literature data and metrics extracted from ECGi data (see Supplement). This shows that the model replicates the LBBB activation pattern for all twenty-four patient-specific meshes and that the simulated metrics agree with metrics derived from clinical data for LBBB patients.
To simulate diffuse conduction disease of the LV, the CV of the LV Purkinje system (including all three fascicles and left bundle branch) were decreased down to 70% of LV His-Purkinje baseline CV of 3.0 m/s, based on measurements in HF dogs.9 However, since this still resulted in healthy LV His-Purkinje CV (2.1 m/s), we performed simulations with the LV-His Purkinje CV decreased down to 35% of healthy CV, to simulate severe diffuse LV conduction disease. We also simulated mild (reduced to 70% of healthy myocardium CV) and severe (reduced to 35% of healthy myocardium CV) myocardium conduction disease by decreasing the CV of ventricular myocardium.
Scar Mapping and Simulation
To simulate the effect of septal scar and LV lateral wall scar, we mapped patient-specific scar and border zone geometries from publicly available 1mm-resolution LV patient-specific meshes using the universal ventricular coordinates (UVCs).20,21 The UVCs were computed on the LV of our twenty-four meshes and on the LV meshes the scar was mapped from. Then, the scar and border zones were mapped by finding the closest element in UVC distance on the target mesh for every scar and corresponding border zone to each heart. We mapped a septal and a lateral wall scar and corresponding border zone to each heart. Scar was then simulated as non-conducting, while the CV in the border zone was set to isotropic and 50% of the transverse CV in healthy myocardium.20 Finally, we assumed that the Purkinje fibers within the scar were non-conducting.
CRT Simulations
In this study, we considered seven different baseline simulations in combination with proximal LBBB: 1) normal His-Purkinje system CV of 3.0 m/s; 2) CV in the LV His-Purkinje system decreased to 2.1 m/s (70% of healthy CV), simulating mild diffuse LV conduction disease; 3) CV in the LV His-Purkinje system reduced to 1.05 m/s (35% of healthy CV), simulating severe diffuse LV conduction disease; 4) CV in ventricular myocardium decreased to 0.42 m/s (70% of healthy CV); 5) CV in ventricular myocardium decreased to 0.21 m/s (35% of healthy CV); 6) large septal non-conducting scar; 7) large non-conducting LV lateral wall scar. Pacing in all these different scenarios was simulated as described below.
Standard CRT was simulated by pacing the RV apex and the LV epicardial lateral wall from the latest activated point at baseline. Ventricular-ventricular delay was set to 0.0 ms. Selective HBP was simulated by pacing the His below the block, assuming perfect correction of proximal LBBB. CRT and HBP simulations were performed under the assumption that pacing completely over-writes the patient’s intrinsic activation. Selective LBBP was simulated by pacing the left bundle. LBBP was always simulated with AV delay optimization as described previously to minimize biventricular activation times,7 as this was shown to lead to comparable response to HBP. HOT-CRT was simulated by combining HBP with an LV epicardial lead, placed in the latest activated region in the LV. The LV was paced with a delay equal to the His-ventricular delay during HBP alone.11 Similarly, LOT-CRT was simulated by combining LBBP with optimal AV delay and the LV epicardial lead. In this case, the LV epicardium was stimulated with a delay equal to the first myocardial activation computed during selective LBBP alone.
We investigated the effect of healthy His-Purkinje CV on our results by repeating all simulations and comparisons with a healthy His-Purkinje CV of 2 m/s, as opposed to 3 m/s as reported above. The results of this analysis are reported in the Supplement. In addition, we investigated the effect of His-Purkinje system conduction properties within non-conductive septal scar by running additional simulations with healthy, moderately and severely slow Purkinje within the scar, as shown in the Supplement.
Metrics for Response
We assessed LV synchrony by computing 95% of LV activation (LVAT-95), computed as the shortest interval to activate 95% of the LV, and the LV dyssynchronous index (LVDI), defined as the standard deviation of LV activation times. Both LVAT-95 and LVDI have been used in the literature to quantify response to pacing from ECGi data.22 Similarly, BIV dyssynchrony was quantified by computing 90% of biventricular activation (BIVAT-90) and the biventricular dyssynchronous index (BIVDI). For all metrics, the outflow tracts and the area around the mitral and the tricuspid valve annuli were excluded from the activation time calculations. This was done to be consistent with the clinical data that we used to validate the model (see supplement).
Statistical Methods
Simulation results were compared using one-way analysis of variance (ANOVA). Post-hoc comparison analysis was performed to see which pairwise comparisons were statistically different using the Tukey’s honestly significant difference test.
Results
The results obtained in this study are summarized in Table 1. The top and bottom sections report BIVAT-90 and LVAT-95, respectively. We show metrics obtained at baseline LBBB, during CRT, selective HBP, selective LBBP, HOT-CRT and LOT-CRT for different conduction disturbances considered in this study.
1.
Results summary. Simulated BIVAT-90 (top section) and LVAT-95 (bottom section) during baseline, CRT, selective HBP (S-HBP) and LBBP (S-LBBP), HOT-CRT and LOT-CRT for different conduction disturbances.
| Biventricular response – BIVAT-90 | ||||||
|---|---|---|---|---|---|---|
| Baseline | CRT | S-HBP | S-LBBP | HOT-CRT | LOT-CRT | |
| LBBB | 87.6 ± 9.0 | 68.0 ± 8.0 | 42.6 ± 3.8 | 48.0 ± 5.3 | - | - |
| LBBB & moderately slow LV Purkinje | 98.0 ± 9.6 | 76.4 ± 8.3 | 49.1 ± 4.6 | 56.7 ± 6.5 | 45.9 ± 4.1 | 51.7 ± 5.3 |
| LBBB & severely slow LV Purkinje | 129.9 ± 11.8 | 93.0 ± 8.9 | 101.5 ± 7.8 | 89.1 ± 9.8 | 87.6 ± 6.7 | 73.9 ± 7.6 |
| LBBB & moderately slow myocardium | 107.2 ± 12.6 | 83.6 ± 11.8 | 54.7 ± 5.1 | 59.8 ± 6.3 | 52.5 ± 4.6 | 56.7 ± 5.5 |
| LBBB & severely slow myocardium | 172.7 ± 26.2 | 134.5 ± 24.1 | 97.1 ± 9.9 | 101.5 ± 10.7 | 94.6 ± 9.4 | 98.2 ± 10.0 |
| LBBB & septal scar | 119.1 ± 10.8 | 85.1 ± 9.8 | 117.2 ± 14.9 | 118.1 ± 12.9 | 94.5 ± 11.6 | 96.7 ± 13.0 |
| LBBB & LV lateral wall scar | 124.8 ± 13.2 | 119.0 ± 17.4 | 105.3 ± 12.8 | 102.6 ± 12.5 | 101.9 ± 12.3 | 99.5 ± 12.0 |
| Left ventricular response – LVAT-95 | ||||||
| LBBB | 94.8 ± 9.3 | 79.8 ± 7.7 | 51.2 ± 14.0 | 59.0 ± 6.5 | - | - |
| LBBB & moderately slow LV Purkinje | 106.7 ± 9.9 | 89.4 ± 8.2 | 59.4 ± 5.6 | 70.4 ± 7.4 | 53.2 ± 4.4 | 62.7 ± 5.9 |
| LBBB & severely slow LV Purkinje | 143.6 ± 11.7 | 108.5 ± 9.2 | 113.4 ± 8.7 | 108.7 ± 10.2 | 95.1 ± 7.6 | 89.9 ± 8.4 |
| LBBB & moderately slow myocardium | 116.4 ± 12.6 | 96.6 ± 10.4 | 65.5 ± 6.1 | 73.0 ± 7.8 | 61.0 ± 5.1 | 67.6 ± 6.5 |
| LBBB & severely slow myocardium | 189.6 ± 25.8 | 152.1 ± 21.7 | 115.0 ± 11.0 | 121.8 ± 12.5 | 109.2 ± 9.8 | 115.2 ± 10.8 |
| LBBB & septal scar | 130.9 ± 11.2 | 100.1 ± 9.5 | 129.4 ± 13.9 | 130.2 ± 11.6 | 101.7 ± 10.7 | 104.1 ± 13.6 |
| LBBB & LV lateral wall scar | 148.0 ± 15.2 | 142.2 ± 19.6 | 129.2 ± 14.1 | 125.4 ± 14.0 | 125.1 ± 14.1 | 122.0 ± 13.9 |
Conduction Slowing in the His-Purkinje but not in the Myocardium Worsens Response to CSP
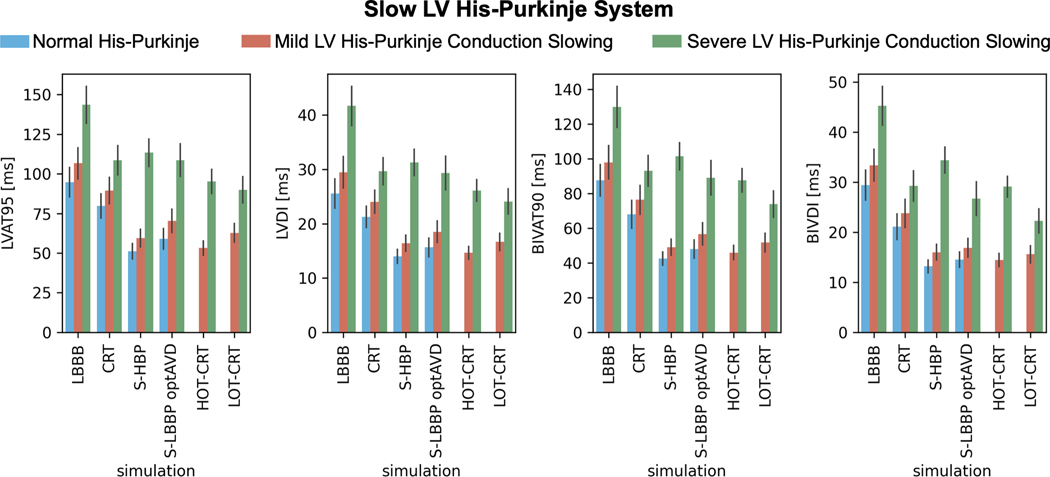
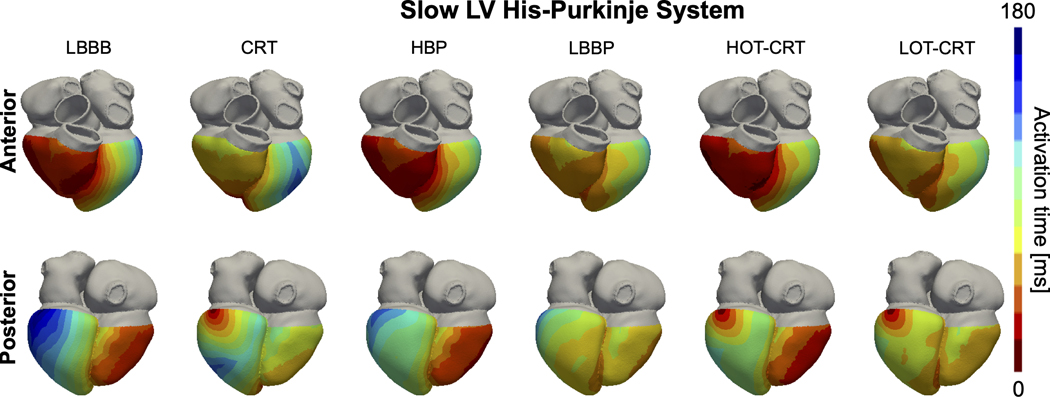
In presence of proximal LBBB and otherwise normal His-Purkinje system (Figure 1, blue bars), HBP and LBBP led to improved LV and BIV activation times and synchrony compared to standard CRT (LVAT-95: HBP 51.2±4.9 ms and LBBP 59.0±6.5 ms vs CRT 79.8±7.7 ms; BIVAT-90: HBP 42.6±3.8 ms and LBBP 48.0±5.3 ms vs CRT 68.0±8.0 ms), with all differences being statistically significant (P<0.01). Reducing LV His-Purkinje CV from 3.0 m/s to 2.1 m/s (Figure 1, orange bars) also led to better response with CSP compared to CRT (P<0.01 for all metrics). When the LV His-Purkinje CV was further reduced to 1.05 m/s (Figure 1, green bars), CRT was comparable to HBP (LVAT-95: HBP 113.4±8.7 ms vs CRT 108.5±9.2 ms, P=0.45) and LBBP (LVAT-95: LBBP 108.7±10.2 ms vs CRT 108.5±9.2 ms, P=0.9) in terms of LV activation times. BIV activation times were shorter with CRT compared to HBP (BIVAT-90: HBP 101.5±7.8 ms vs CRT 93.0±8.9 ms, P<0.05), while LBBP was comparable to CRT in terms of biventricular indices (BIVAT-90: LBBP 89.1±9.8 ms vs CRT P=0.7). This difference between HBP and LBBP in patients with severely slow LV His-Purkinje system is caused by the longer distance the stimulus has to travel across the LV fascicles during HBP compared to LBBP. While this is irrelevant when the fascicles are fast, in the presence of severe LV His-Purkinje CV slowing this causes worse response with HBP compared to LBBP. Figure 2 shows the distribution of simulated activation times for one patient at baseline, CRT, HBP, LBBP, HOT-CRT and LOT-CRT, with red and blue areas representing early and late activated areas, respectively.
Figure 1. Effect of LV His-Purkinje conduction on response to pacing.
Bar chart of LVAT-95, LVDI, BIVAT-90 and BIVDI for three different pathologies: proximal LBBB but otherwise normal His-Purkinje system (blue), mild LV His-Purkinje conduction slowing (orange) and severe LV His-Purkinje system conduction slowing. The values are presented as mean ± standard deviation (black lines). LVAT-95 = 95% left ventricular activation time, LVDI = left ventricular dyssynchronous index, BIVAT-90 = 90% biventricular activation time, BIVDI = biventricular dyssynchronous index, LBBB = left bundle branch block, CRT = cardiac resynchronization therapy, S-HBP = selective His bundle pacing, S-LBBP optAVD = selective left bundle pacing with optimized atrioventricular delay, HOT-CRT = His optimized CRT, LOT-CRT = left bundle optimized CRT
Figure 2. Effect of LV His-Purkinje conduction on activation times.
Simulated ventricular activation times for one of the patient-specific meshes with proximal LBBB and severe LV His-Purkinje system conduction slowing during baseline (LBBB) and pacing. Red and blue areas represent early and late activated regions, respectively. Abbreviations as in Figure 1.
Our simulations predict that patients with CV decreased to 1.05 m/s in LV His-Purkinje system (severe LV conduction disease) significantly benefit from HOT-CRT and LOT-CRT (Figure 1, green bars, and Figure 2). LV activation times and synchrony were shorter with HOT-CRT (LVAT-95: 95.2±7.6 ms and LVDI: 26.2±2.0 ms) and LOT-CRT (LVAT-95: 89.8±8.4 ms and LVDI: 24.1±2.3 ms) compared to CRT (108.5±9.2 ms, P<0.01) or CSP alone (HBP: 113.4±8.7 ms, P<0.01; LBBP: 108.7±10.2). Similarly, BIV synchrony was better when CSP was combined with an LV lead, but differences were statistically significant only between CRT and LOT-CRT in terms of BIVDI and BIVAT-90 (P<0.01), indicating that HOT-CRT is more likely to benefit the LV but not BIV synchrony.
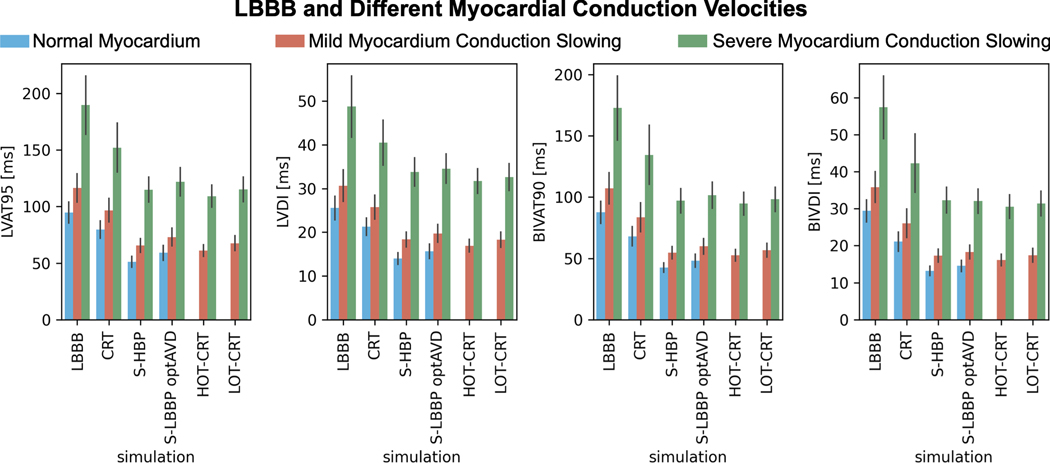
Patients with slow ventricular myocardium but normal His-Purkinje CV benefit more from CSP compared to CRT (Figure 3). BIVAT-90 was shorter with HBP and LBBP compared to CRT in case of myocardial CV slowed from 0.6 m/s to 0.42 m/s (CRT: 83.6±11.8 ms HBP: 54.7±5.1 ms , P<0.01; LBBP: 59.8±6.3 ms , P<0.01) and 0.21 m/s (CRT: 134.5±24.1 ms HBP: 97.1±9.9 ms , P<0.01; LBBP: 101.5±10.7 ms , P<0.01). LV activation times followed a similar trend, with CSP achieving significantly shorter LVAT-95 compared to CRT. HOT-CRT and LOT-CRT are not significantly more effective than HBP and LBBP, respectively. When the myocardium CV was reduced from 0.6 m/s to 0.42 m/s, BIVAT-90 during HOT-CRT and LOT-CRT were 52.5±4.6 ms (P=0.9 vs HBP) and 56.7±5.5 ms (P= 0.78 vs LBBP). Myocardium CV reduced to 0.21 m/s led to similar results, with HOT-CRT (BIVAT-90: 94.6±9.4 ms vs HBP P=0.9; LVAT-95: 109.2±9.8 ms vs HBP P=0.82) and LOT-CRT (BIVAT-90: 98.2±10.0 ms vs LBBP, P=0.9; LVAT-95: 115.0±10.8 ms vs LBBP P=0.72) not being more effective than CSP alone in reducing both BIV and LV activation times.
Figure 3. Effect of myocardium conduction on response to pacing.
Bar chart of LVAT-95, LVDI, BIVAT-90 and BIVDI for three different pathologies: proximal LBBB but otherwise normal myocardium (blue), mild myocardium conduction slowing (orange) and severe myocardium conduction slowing. The values are presented as mean ± standard deviation (black lines). Abbreviations as in Figure 1.
The results presented in this paragraph were not affected by decreasing the healthy His-Purkinje CV from 3 m/s to 2 m/s. Severely slow LV His-Purkinje CV led to better response to CRT compared to HBP or LBBP, while moderate and severe myocardial CV slowing favored response to CSP.
Septal but not Lateral Wall Scar Makes CSP Ineffective in Resynchronizing Ventricular Activation
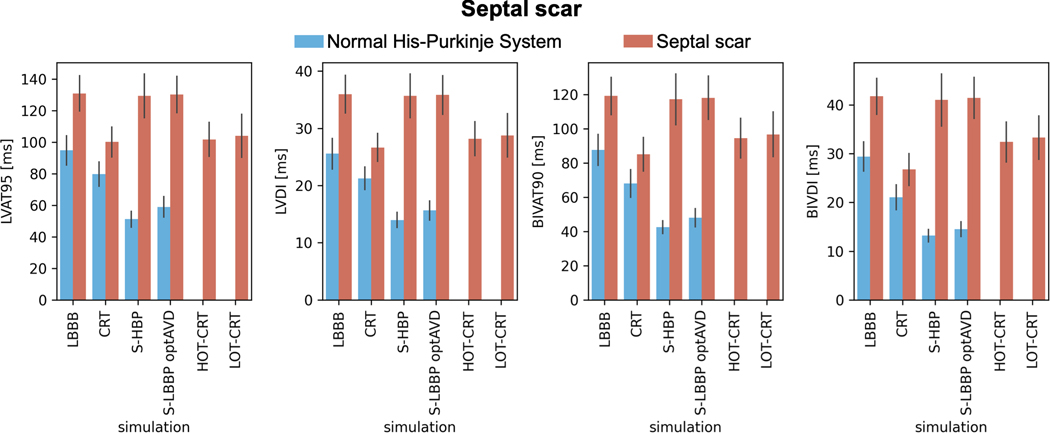
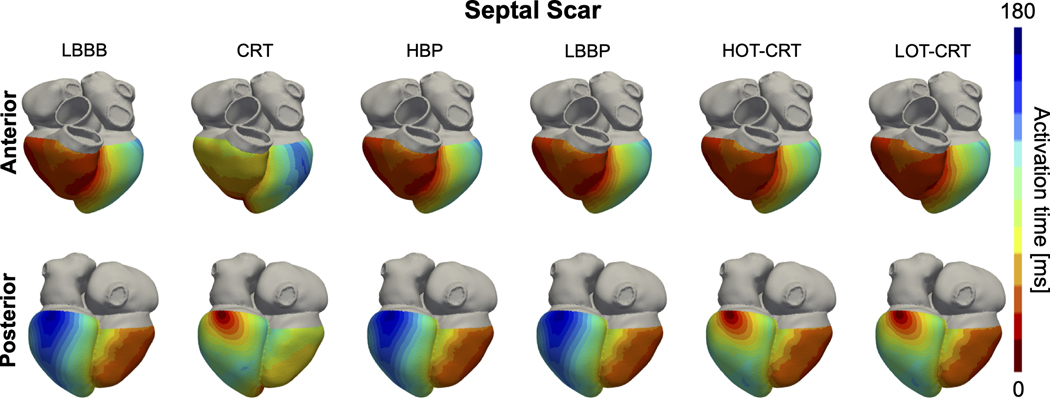
In the presence of proximal LBBB and septal scar (Figure 4, orange bars), HBP and LBBP are ineffective in resynchronizing the ventricles, leading to comparable activation to baseline (BIVAT-90: baseline 119.1±10.8 ms vs HBP 117.2±14.9 ms, P=0.9 and LBBP: 118.1±12.6 ms, P=0.9; LVAT-95: baseline 130.9±11.2 ms vs HBP 129.4±13.9 ms, P=0.9 and LBBP: 130.2.0±11.6 ms, P=0.9). On the other hand, CRT significantly shortened ventricular activation compared to baseline (BIVAT-90: 85.1±9.8 ms, P<0.01; LVAT-95: 100.1±9.5 ms, P<0.01). Figure 5 shows the simulated activation times for one of the geometries with septal scar during baseline (LBBB with septal scar) and different pacing modes. Activation times with CSP are the same as during baseline, while CRT synchronizes the ventricles. LV activation times during HOT-CRT (LVAT-95: 101.7±10.7 ms, P=0.9 vs CRT) and LOT-CRT (LVAT-95: 104.1±13.6, P=0.85 vs CRT) were similar to CRT, while BIV activation times were better during CRT compared to HOT-CRT (BIVAT-90: 94.5±11.6 ms, P=0.11 vs CRT) or LOT-CRT (BIVAT-90: 96.7±13.0 ms, P=0.02 vs CRT), although the difference was not statistically significant. The presence of extended septal scar leads to a distal block that cannot be treated by CSP. In these patients, CRT remains a valuable solution, as response to CRT is less sensitive to the presence of scar in the septum compared to CSP.
Figure 4. Effect of septal scar on response to pacing.
Bar chart of LVAT-95, LVDI, BIVAT-90 and BIVDI for two different pathologies: proximal LBBB but otherwise normal His-Purkinje system (blue) and septal scar (orange). The values are presented as mean ± standard deviation (black lines). Abbreviations as in Figure 1.
Figure 5. Effect of septal scar on activation times.
Simulated ventricular activation times for one of the patient-specific meshes with proximal LBBB and septal scar during baseline (LBBB) and pacing. Red and blue areas represent early and late activated regions, respectively. Abbreviations as in Figure 1.
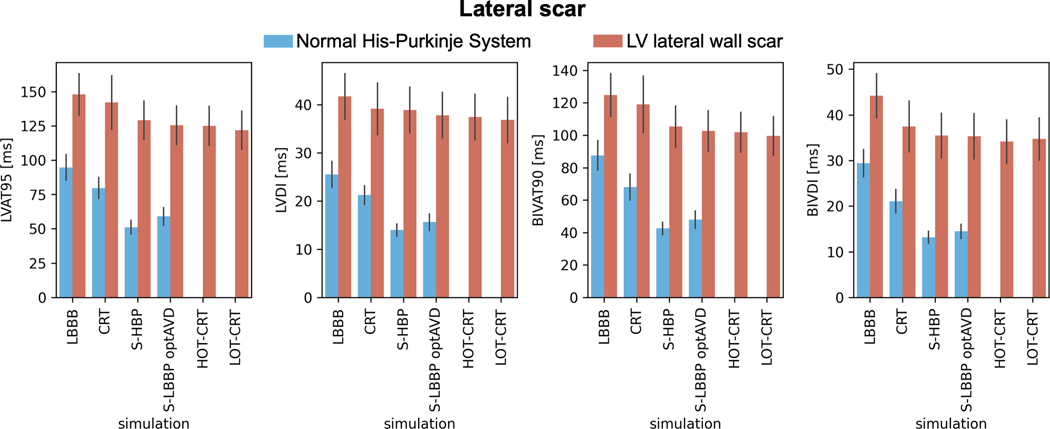
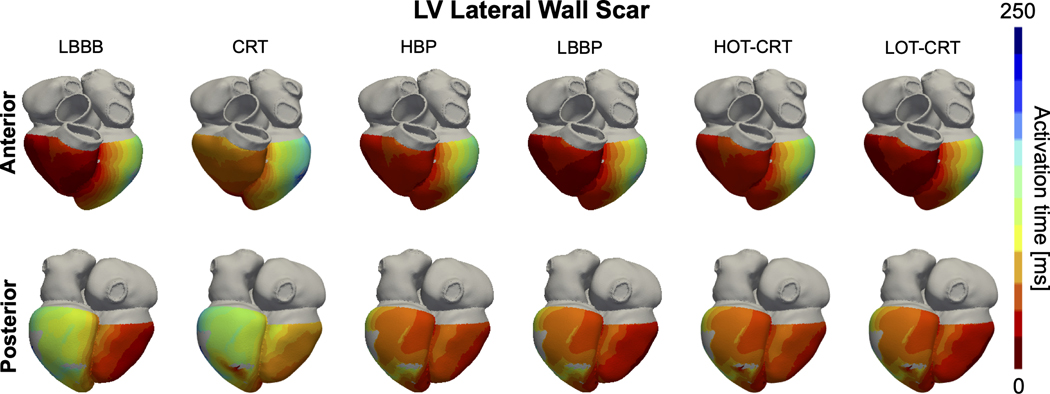
CRT is ineffective in patients with LV lateral wall scar (Figure 6, orange bars). BIVAT-90 (baseline: 124.8±13.2 ms vs CRT: 119.0±17.4 ms, P=0.68) and LVAT-95 (baseline: 148.0±15.2 ms vs CRT: 142.2±19.6 ms, P=0.76) during CRT were comparable to baseline. Scar in the LV lateral wall only mildly affects response to CSP (Figure 6, orange bars). In the presence of LV lateral wall scar, LVAT-95 is reduced from 148.0±15.2 ms to 129.2±14.1 ms (P<0.01) with HBP and to 125.4±14.0 ms (P<0.01) with LBBP. Similarly, biventricular activation was quicker with HBP and LBBP compared to baseline (BIVAT-90: baseline 124.8±13.2 ms vs HBP 105.3±12.8 ms P<0.01 and LBBP 102.6±12.5 ms P<0.01). HOT-CRT (BIVAT-90: 101.9±12.3 ms vs HBP P=0.9; LVAT-95: 125.1±14.1 ms P=0.9) and LOT-CRT (BIVAT-90: 99.5±12.0 ms vs HBP P=0.9; LVAT-95: 122.0±13.9 ms P=0.9) are equivalent to CSP alone in these patients, as the LV epicardial lead is close to the scar. Simulated activation times with LV lateral wall scar in Figure 7 show that HBP and LBBP improve LV activation times compared to baseline, because these pacing methods are able to correct for proximal LBBB. However, due to the presence of scar in the LV (grey areas), propagation across the LV is still slow. Therefore, the reduction in activation times following CSP in the presence of LV lateral wall scar is smaller compared to when the scar is not present (Figure 6).
Figure 6. Effect of lateral wall scar on response to pacing.
Bar chart of LVAT-95, LVDI, BIVAT-90 and BIVDI for two different pathologies: proximal LBBB but otherwise normal His-Purkinje system (blue) and scar in the LV lateral wall (orange). The values are presented as mean ± standard deviation (black lines). Abbreviations as in Figure 1.
Figure 7. Effect of lateral wall scar on activation times:
Simulated ventricular activation times for one of the patient-specific meshes with proximal LBBB and scar in the LV lateral wall during baseline (LBBB) and pacing. Red and blue areas represent early and late activated regions, respectively. Gray areas in the LV represent scar, simulated as non-conductive tissue. Abbreviations as in Figure 1.
Decreasing the healthy His-Purkinje CV from 3 m/s to 2 m/s did not affect the resulted presented in the presence of septal scar, as shown in the Supplement. In this case, CSP remained ineffective, while CRT led to significantly reduced activation times. However, when the Purkinje system within the septal scar was viable, even if slow, HBP and LBBP were more effective than CRT in reducing activation times. On the other hand, in the presence of LV lateral wall scar, reduced healthy His-Purkinje CV worsened response to CSP, while activation metrics during CRT remained unaltered. This is due to CSP being more reliant than CRT on His-Purkinje CV.
Discussion
We performed an in-silico electrophysiology clinical trial to study the effect of altered LV His-Purkinje CV, myocardial CV, and the presence of scar on patient response to CRT, HBP, LBBP, HOT-CRT and LOT-CRT. The central illustration summarizes the results of the study. In patients with severe LV His-Purkinje system slowing (CV reduced from 3.0 m/s to 1.05 m/s), CSP was worse than CRT, while HOT-CRT and LOT-CRT as extensions of CSP led to shorter activation compared to CSP or CRT alone. Patients with slow myocardial CV benefit more from CSP than CRT, with HOT-CRT and LOT-CRT not bringing any additional benefits to CSP alone. Patients with septal scar benefit from CRT but not CSP. On the other hand, in the presence of LV lateral wall scar, CRT was ineffective while CSP was effective.
Although selective HBP was reported to shorten and sometimes normalize the QRS duration,6,22 many patients are left with partial dyssynchrony. HBP effectiveness relies on the assumption that most blocks happen proximally along the His bundle. Furthermore, HBP requires mapping the His bundle together with high pacing thresholds to target the His bundle and achieve QRS shortening. Upadhyay et al.8 performed left septal mapping in 85 patients to compare response to HBP in patients with proximal or distal blocks. HBP corrected LBBB in 94% of patients with proximal LBBB along the His and otherwise intact Purkinje network. On the other hand, patients with intact His-Purkinje system (no conduction block) or with more distal blocks (e.g. no viable Purkinje fibers) did not benefit from HBP. Our results agree with this study. We have shown that proximal block with normal His-Purkinje CV leads to better response with HBP, while HBP is ineffective in the absence of viable LV His-Purkinje system in the septum (as, for instance, in the presence of septal scar) or diffuse LV conduction disease. Furthermore, our simulations predict that HBP is also effective in patients with LV lateral wall scar, while CRT is ineffective, consistent with clinical observations where patient with scar are less likely to respond to CRT or would require LV lead location optimization to achieve response.23 In agreement with our study, LBBP is also ineffective in the presence of septal scar.10
HOT-CRT has been proposed as an extension of HBP that could improve pacing-induced electrical synchrony in patients with severe HF.11 Vijayaraman et al. reported significantly shorter QRS duration with HOT-CRT compared to CRT and HBP alone, showing the potential benefits of combining these two pacing modalities, in agreement with our study.11 Padeletti et al.24 showed that CRT and LV-only pacing required AV delay optimization to achieve significant improvements of LV systolic function. On the other hand, HBP is able to activate intact right bundle branch fibers, allowing for fusion of the LV lead wavefront and intrinsic conduction of the RV without AV delay optimization. Although the His-LV lead delay could be optimized in HOT-CRT, HOT-CRT was reported to be superior to HBP or CRT alone even without His-LV delay optimization,11 making it potentially more convenient than CRT or LV-only pacing. Nevertheless, HOT-CRT delivery is challenging, especially in patients in sinus rhythm due to difficulties in incorporating an additional lead in the pacemaker, and might result in increased pacing thresholds.11
Consistent with our simulations, Jastrzębski et al. found that LOT-CRT achieves superior electrical synchrony compared to CRT and LBBP alone.12 The QRS narrowing reported with HOT-CRT was however greater than LOT-CRT, possibly caused by late RV activation induced by LBBP.12 RV delayed activation can be improved with AV delay optimization, when the patient does not suffer from complete heart block.7 Our results show that LBBP delivered with optimized AV delay in combination with an LV epicardial lead achieves superior electrical synchrony to all other pacing modalities in patients with severe LV His-Purkinje conduction slowing, but not in patients with slow myocardial conduction or scar in either the septum or the LV lateral wall. HOT-CRT and LOT-CRT represent valuable alternatives for patients with advanced HF, where HBP, LBBP and CRT alone were not able to achieve significant QRS narrowing. LOT-CRT has an advantage over HOT-CRT due to low and stable pacing thresholds.12 LOT-CRT has some technical advantages compared to HOT-CRT, but it may require AV delay optimization to achieve optimal synchrony, thus relying on the patients not suffering from complete heart block.
Limitations
In-silico trials allow systematic comparison of pathologies and therapies. However, they rely on models and have inherent limitations. Our study assumes that acute pacing-induced electrical synchrony correlates with long-term functional response, while additional factors other than electrical synchrony contribute to patient outcome. Nevertheless, a systematic review of CRT clinical trials has reported that responders had significantly larger QRS narrowing compared to non-responders,25 highlighting the importance of electrical synchrony following CRT.
The results of our study suggest that response to different pacing strategies depends on the CV of the myocardium and the LV His-Purkinje system, and on the presence of scar. Although scar can be quantified through late gadolinium enhanced MRI, currently it is not possible to measure His-Purkinje CV in-vivo. This makes clinical validation of part of our results challenging.
Our heart models include a synthetically generated His-Purkinje system and was not adapted to represent a specific patient. This approach allowed us to simulate the main features of LBBB activation at baseline and response to pacing. The model validation we reported in the Supplement shows that all twenty-four models represent general features of LBBB depolarization pattern and replicates how different activation metrics change in response to CRT.
Our model assumes perfect delivery of HBP and LBBP, while a significant proportion of patients are delivered with non-selective capture. Furthermore, LBBP was always simulated with optimized AV delay, although this cannot be achieved in patients with complete heart block or atrial fibrillation. Therefore, our results might overestimate benefits induced by CSP. Although these factors could be accounted with further in-silico trials, they were outside the scope of this study.
In our scar model, we assumed that the scar tissue was non-conducting. Different scar densities, conduction properties and types could be considered based on previous computational studies.26 Furthermore, the Purkinje fibers within the scar were also assumed to be non-conducting, due to the lack of information about the effect of scar on the Purkinje network. However, in the Supplement, we have shown that if the Purkinje within septal non-conducting scar is viable, the CSP is still more effective than CRT.
Despite its limitations, this computational study succeeds in testing different possible scenarios in which CSP may or may not be effective and predict which patients are likely to respond to CSP in a clinical setting. However, while our results suggest that CSP may be most effective, these need to be reproduced in a clinical study to ensure clinical relevance of our findings.
Conclusion
CSP is negatively affected by severe conduction slowing in the LV His-Purkinje system and by the presence of extensive septal scar, but not by myocardial conduction slowing. Dyssynchrony induced by LV His-Purkinje conduction slowing can be corrected using HOT-CRT and LOT-CRT. On the other hand, CRT remains more effective in patients with septal scar as septal scar leads to a distal block that makes CSP completely ineffective. CSP is able to reduce activation times in the presence of LV lateral wall scar, although electrical synchronization was smaller compared to patients without scar.
Supplementary Material
Acknowledgements
This work was supported by the Wellcome/EPSRC Centre for Medical Engineering (WT 203148/Z/16/Z). SAN is supported by NIH R01-HL152256, ERC PREDICT-HF 453 (864055), BHF (RG/20/4/34803), EPSRC (EP/P01268X/1). This study received financial support from the French Government as part of the “Investments of the Future” program managed by the National Research Agency (ANR) (ANR-10-IAHU-04).
Funding statement:
This work was supported by the Wellcome/EPSRC Centre for Medical Engineering (WT 203148/Z/16/Z). SAN is supported by NIH R01-HL152256, ERC PREDICT-HF 453 (864055), BHF (RG/20/4/34803), EPSRC (EP/P01268X/1).
Footnotes
Data availability statement: The data supporting the conclusions of the manuscript are available upon request.
Conflict of interest statement: Dr A. Neic is employed by NumeriCor GmbH. All other authors believe this does not constitute a conflict of interest.
References
- 1.Sieniewicz BJ, Gould J, Porter B, et al. Understanding non-response to cardiac resynchronisation therapy: common problems and potential solutions. Heart Fail Rev. 2019;24(1). doi: 10.1007/s10741-018-9734-8 [DOI] [PMC free article] [PubMed] [Google Scholar]
- 2.Arnold AD, Shun-Shin MJ, Keene D, et al. His Resynchronization Versus Biventricular Pacing in Patients With Heart Failure and Left Bundle Branch Block. J Am Coll Cardiol. 2018;72(24). doi: 10.1016/j.jacc.2018.09.073 [DOI] [PMC free article] [PubMed] [Google Scholar]
- 3.Vinther M, Risum N, Svendsen JH, Møgelvang R, Philbert BT. A Randomized Trial of His Pacing Versus Biventricular Pacing in Symptomatic HF Patients With Left Bundle Branch Block (His-Alternative). JACC Clin Electrophysiol. 2021;7(11). doi: 10.1016/j.jacep.2021.04.003 [DOI] [PubMed] [Google Scholar]
- 4.Wang Y, Zhu H, Hou X, et al. Randomized Trial of Left Bundle Branch vs Biventricular Pacing for Cardiac Resynchronization Therapy. J Am Coll Cardiol. 2022;80(13):1205–1216. doi: 10.1016/j.jacc.2022.07.019 [DOI] [PubMed] [Google Scholar]
- 5.Pujol-Lopez M, Jiménez-Arjona R, Garre P, et al. Conduction System Pacing vs Biventricular Pacing in Heart Failure and Wide QRS Patients. JACC Clin Electrophysiol. Published online November 2022. doi: 10.1016/j.jacep.2022.08.001 [DOI] [PubMed] [Google Scholar]
- 6.Arnold AD, Whinnett ZI, Vijayaraman P. His-Purkinje conduction system pacing: State of the art in 2020. Arrhythm Electrophysiol Rev. 2020;9(3). doi: 10.15420/AER.2020.14 [DOI] [PMC free article] [PubMed] [Google Scholar]
- 7.Strocchi M, Lee AWC, Neic A, et al. His-bundle and left bundle pacing with optimized atrioventricular delay achieve superior electrical synchrony over endocardial and epicardial pacing in left bundle branch block patients. Heart Rhythm. 2020;17(11). doi: 10.1016/j.hrthm.2020.06.028 [DOI] [PubMed] [Google Scholar]
- 8.Upadhyay GA, Cherian T, Shatz DY, et al. Intracardiac Delineation of Septal Conduction in Left Bundle-Branch Block Patterns. Circulation. 2019;139(16). doi: 10.1161/circulationaha.118.038648 [DOI] [PubMed] [Google Scholar]
- 9.Maguy A, le Bouter S, Comtois P, et al. Ion Channel Subunit Expression Changes in Cardiac Purkinje Fibers. Circ Res. 2009;104(9). doi: 10.1161/circresaha.108.191809 [DOI] [PubMed] [Google Scholar]
- 10.Ponnusamy SS, Arora V, Namboodiri N, Kumar V, Kapoor A, Vijayaraman P. Left bundle branch pacing: A comprehensive review. J Cardiovasc Electrophysiol. 2020;31(9). doi: 10.1111/jce.14681 [DOI] [PubMed] [Google Scholar]
- 11.Vijayaraman P, Herweg B, Ellenbogen KA, Gajek J. His-Optimized Cardiac Resynchronization Therapy to Maximize Electrical Resynchronization: A Feasibility Study. Circ Arrhythm Electrophysiol. 2019;12(2). doi: 10.1161/CIRCEP.118.006934 [DOI] [PubMed] [Google Scholar]
- 12.Jastrzębski M, Moskal P, Huybrechts W, et al. Left bundle branch–optimized cardiac resynchronization therapy (LOT-CRT): Results from an international LBBAP collaborative study group. Heart Rhythm. 2022;19(1). doi: 10.1016/j.hrthm.2021.07.057 [DOI] [PubMed] [Google Scholar]
- 13.Strocchi M, Augustin CM, Gsell MAF, et al. A publicly available virtual cohort of four-chamber heart meshes for cardiac electromechanics simulations. PLoS One. 2020;15(6). doi: 10.1371/journal.pone.0235145 [DOI] [PMC free article] [PubMed] [Google Scholar]
- 14.Gillette K, Gsell MAF, Bouyssier J, et al. Automated Framework for the Inclusion of a His–Purkinje System in Cardiac Digital Twins of Ventricular Electrophysiology. Ann Biomed Eng. 2021;49(12). doi: 10.1007/s10439-021-02825-9 [DOI] [PMC free article] [PubMed] [Google Scholar]
- 15.Neic A, Campos FO, Prassl AJ, et al. Efficient computation of electrograms and ECGs in human whole heart simulations using a reaction-eikonal model. J Comput Phys. 2017;346. doi: 10.1016/j.jcp.2017.06.020 [DOI] [PMC free article] [PubMed] [Google Scholar]
- 16.Draper MH, Mya-Tu M. A COMPARISON OF THE CONDUCTION VELOCITY IN CARDIAC TISSUES OF VARIOUS MAMMALS. Q J Exp Physiol Cogn Med Sci. 1959;44(1). doi: 10.1113/expphysiol.1959.sp001379 [DOI] [PubMed] [Google Scholar]
- 17.Ono N, Yamaguchi T, Ishikawa H, et al. Morphological varieties of the purkinje fiber network in mammalian hearts, as revealed by light and electron microscopy. Arch Histol Cytol. 2009;72(3). doi: 10.1679/aohc.72.139 [DOI] [PubMed] [Google Scholar]
- 18.Kassebaum DG, van Dyke AR. Electrophysiological effects of isoproterenol on Purkinje fibers of the heart. Circ Res. 1966;19(5). doi: 10.1161/01.RES.19.5.940 [DOI] [PubMed] [Google Scholar]
- 19.Durrer D, van Dam RT, Freud GE, Janse MJ, Meijler FL, Arzbaecher RC. Total excitation of the isolated human heart. Circulation. 1970;41(6). doi: 10.1161/01.CIR.41.6.899 [DOI] [PubMed] [Google Scholar]
- 20.Mendonca Costa C, Neic A, Kerfoot E, et al. Pacing in proximity to scar during cardiac resynchronization therapy increases local dispersion of repolarization and susceptibility to ventricular arrhythmogenesis. Heart Rhythm. 2019;16(10). doi: 10.1016/j.hrthm.2019.03.027 [DOI] [PMC free article] [PubMed] [Google Scholar]
- 21.Bayer J, Prassl AJ, Pashaei A, et al. Universal ventricular coordinates: A generic framework for describing position within the heart and transferring data. Med Image Anal. 2018;45. doi: 10.1016/j.media.2018.01.005 [DOI] [PubMed] [Google Scholar]
- 22.Arnold AD, Shun-Shin MJ, Keene D, et al. His resynchronization therapy vs. biventricular pacing for heart failure with LBBB: a within-patient comparison of effects on acute haemodynamic function and ventricular activation. Europace. 2018;20. [Google Scholar]
- 23.Behar JM, Jackson T, Hyde E, et al. Optimized Left Ventricular Endocardial Stimulation Is Superior to Optimized Epicardial Stimulation in Ischemic Patients With Poor Response to Cardiac Resynchronization Therapy: A Combined Magnetic Resonance Imaging, Electroanatomic Contact Mapping, and Hemodynamic Study to Target Endocardial Lead Placement. JACC Clin Electrophysiol. 2016;2(7). doi: 10.1016/j.jacep.2016.04.006 [DOI] [PMC free article] [PubMed] [Google Scholar]
- 24.Padeletti L, Pieragnoli P, Ricciardi G, et al. Simultaneous His Bundle and Left Ventricular Pacing for Optimal Cardiac Resynchronization Therapy Delivery. Circ Arrhythm Electrophysiol. 2016;9(5). doi: 10.1161/circep.115.003793 [DOI] [PubMed] [Google Scholar]
- 25.Bazoukis G, Naka KK, Alsheikh-Ali A, et al. Association of QRS narrowing with response to cardiac resynchronization therapy—a systematic review and meta-analysis of observational studies. Heart Fail Rev. 2020;25(5). doi: 10.1007/s10741-019-09839-5 [DOI] [PubMed] [Google Scholar]
- 26.Balaban G, Halliday BP, Mendonca Costa C, et al. Fibrosis Microstructure Modulates Reentry in Non-ischemic Dilated Cardiomyopathy: Insights From Imaged Guided 2D Computational Modeling. Front Physiol. 2018;9. doi: 10.3389/fphys.2018.01832 [DOI] [PMC free article] [PubMed] [Google Scholar]
Associated Data
This section collects any data citations, data availability statements, or supplementary materials included in this article.


