

Objectives
The UK Biobank (UKBB) and German National Cohort (NAKO) are among the largest cohort studies, capturing a wide range of health-related data from the general population, including comprehensive magnetic resonance imaging (MRI) examinations. The purpose of this study was to demonstrate how MRI data from these large-scale studies can be jointly analyzed and to derive comprehensive quantitative image-based phenotypes across the general adult population.
Materials and Methods
Image-derived features of abdominal organs (volumes of liver, spleen, kidneys, and pancreas; volumes of kidney hilum adipose tissue; and fat fractions of liver and pancreas) were extracted from T1-weighted Dixon MRI data of 17,996 participants of UKBB and NAKO based on quality-controlled deep learning generated organ segmentations. To enable valid cross-study analysis, we first analyzed the data generating process using methods of causal discovery. We subsequently harmonized data from UKBB and NAKO using the ComBat approach for batch effect correction. We finally performed quantile regression on harmonized data across studies providing quantitative models for the variation of image-derived features stratified for sex and dependent on age, height, and weight.
Results
Data from 8791 UKBB participants (49.9% female; age, 63 ± 7.5 years) and 9205 NAKO participants (49.1% female, age: 51.8 ± 11.4 years) were analyzed. Analysis of the data generating process revealed direct effects of age, sex, height, weight, and the data source (UKBB vs NAKO) on image-derived features. Correction of data source-related effects resulted in markedly improved alignment of image-derived features between UKBB and NAKO. Cross-study analysis on harmonized data revealed comprehensive quantitative models for the phenotypic variation of abdominal organs across the general adult population.
Conclusions
Cross-study analysis of MRI data from UKBB and NAKO as proposed in this work can be helpful for future joint data analyses across cohorts linking genetic, environmental, and behavioral risk factors to MRI-derived phenotypes and provide reference values for clinical diagnostics.
Key Words: cohort study, MRI, deep learning, causality, cross-study analysis, abdomen, segmentation, age, NAKO, UK Biobank
The UK Biobank (UKBB)1 conducted in the United Kingdom and the German National Cohort (NAKO)2 conducted in Germany are 2 of the largest ongoing population-scale cohort studies. Collecting a wide array of health-related information, including MR imaging data, these studies provide a unique level of individual phenotypic characterization of participants.3
UKBB enrolls adults between ages 50 and 80 years, whereas NAKO enrolls participants between ages 20 and 70 years.1,2 This restriction naturally limits the generalizability of study results for each of these single studies. Merging study data performing cross-study analyses may potentially overcome such limitations and in addition yield higher statistical power, the opportunity to independently replicate results and improve resource efficiency.4,5
Data compatibility among different studies however poses challenges for proper merging. Recorded parameters and data structures might be substantially different with little overlap. From a statistical point of view, the presence of distribution shifts, or biases, in the observed data due to differences in the data-generating processes can result in data misinterpretation when data from different sources are merged.
Cross-study analyses of imaging data are particularly challenging due to additional sources of variation regarding the image acquisition process such as different scanner types, varying imaging protocols, and study-specific image processing algorithms. These factors can influence image-derived biomarkers, especially when magnetic resonance imaging (MRI) is used—a modality that is inherently difficult to standardize.6 The practical relevance of such biases has previously been reported on different medical image data sets.7,8
In the case of UKBB and NAKO, image acquisition protocols are partially aligned with the strategic intention to potentially enable cross-study analyses. Similarities cover an overall agreement on anatomic coverage and partial agreement on MRI sequences.9 Still, central aspects of MR acquisition protocols vary significantly including scanner models, magnetic field strengths, sequence parameters,1,2 or the occurrence of artifacts.10 Thus, it is unclear whether image-derived features from UKBB and NAKO can be pooled in a meaningful way for subsequent combined analyses.
Aiming to overcome such challenges, several techniques for data harmonization across studies have been proposed including model-based approaches (eg, batch effect correction using ComBat11 [“Combining Batches”] and its modifications7,12–14). The advantage of model-based data harmonization is the possibility to selectively correct for undesired bias while preserving informative factors of variation.7 This has recently been demonstrated also in a medical imaging context, mainly in a neuroimaging and oncological imaging context.7,12,13
The effective and valid application of such model-based data correction techniques requires detailed understanding of the data generating process. Usually, prior (common sense) knowledge about causal interactions among observed variables is used to harmonize data. As an extension, methods of causal discovery15 may provide complementary information about the data generating process and thus inform the application of data harmonization techniques. This can be of particular relevance in large-scale studies with complex data interactions.16
The purpose of this study is to demonstrate how imaging data from large-scale studies such as UKBB and NAKO can be jointly analyzed and to derive comprehensive quantitative image-based organ phenotypes across the general adult population.
MATERIALS AND METHODS
Population Characteristics and Imaging Data
Data were obtained from UKBB and NAKO, which obtained written informed consents from all subjects and approved our data analysis. Analysis of anonymized data from these studies was approved by the local institutional ethics committee.
This study reports findings from the first 20,000 data sets including MRI data available to us from the 2 study cohorts (10,000 data sets per study). After exclusion of data samples with MRI acquisition artifacts and erroneous automated organ segmentations (see below), image data and related demographic information (age, sex, body weight, and height) from 17,996 participants (8791 from UKBB and 9205 from NAKO) were used for further analysis. Summary statistics describing the study cohorts are provided in Table 1 and visualized in Figure 1. All image data analyzed in this work have been part of a previously reported technical work on deep learning–based abdominal organ segmentation,17 which was the technical foundation for this present work. There is no overlap in data analysis or reported results between these 2 studies.
TABLE 1.
Demographic Characteristics of Study Populations Included in This Analysis
| UKBB | NAKO | Combined | |
|---|---|---|---|
| No. participants | 8791 | 9205 | 17,996 |
| Sex (F/M) % | 49.9% / 50.1% | 48.4% / 51.6% | 49.1% / 50.9% |
| Age (SD), y | 63.0 (7.5) | 51.8 (11.4) | 57.3 (11.2) |
| Weight (SD), kg | 77.1 (15.1) | 79.5 (16.2) | 78.3 (15.7) |
| Height (SD), cm | 169.4 (9.4) | 171.8 (9.5) | 170.7 (9.5) |
| BMI (SD), kg/m2 | 26.7 (4.3) | 26.8 (4.7) | 26.8 (4.5) |
UKBB, UK Biobank; NAKO, German National Cohort; F, female; M, male; SD, standard deviation.
FIGURE 1.
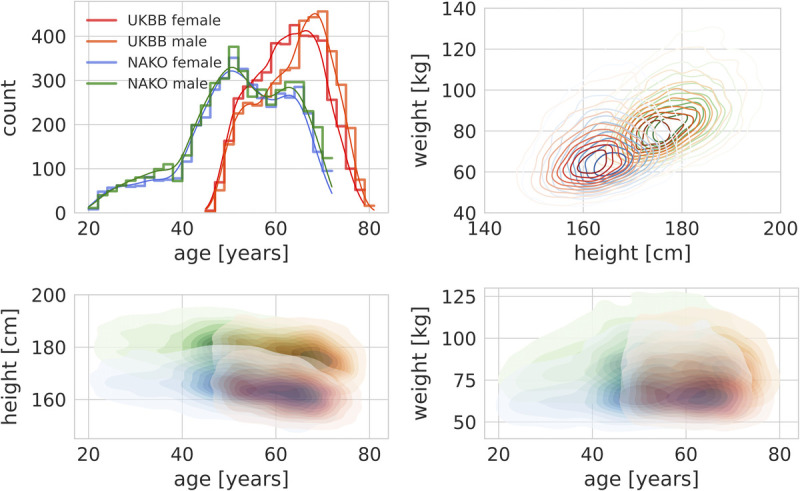
Epidemiological cohort characteristics. Upper left, Different age distributions between UKBB and NAKO. Upper right, Empirical joint densities of height and weight in UKBB and NAKO separated by sex. Bottom left, Empirical joint densities of age and height in UKBB and NAKO separated by sex. Bottom right, Empirical joint densities of age and weight in UKBB and NAKO separated by sex (red, UKBB + female; orange, UKBB + male; blue, NAKO + female; green, NAKO + male).
Both UKBB and NAKO acquire whole-body MRI data on a subset of participants using clinical MR scanners (UKBB: 1.5 T Siemens Magnetom Avanto; NAKO: 3 T Siemens Magnetom Skyra, Siemens Healthineers, Erlangen, Germany). In this study, whole-body T1-weighted images obtained from dual-echo gradient echo imaging—which is available in UKBB and NAKO—were used. This includes 4 tissue contrasts per participant and image volume (fat, water, in-phase, and opposed-phase). Although these image contrasts are comparable between the 2 studies, other acquisition parameters vary markedly. Notably, voxel size is higher in UKBB (2.23 × 2.23 × 3 mm3 to 2.23 × 2.23 × 4.5 mm3) compared with NAKO (1.2 × 1.2 × 3 mm3), which has a direct impact on spatial resolution, image signal, and image noise.2,9
Extraction of Image-Derived Features
This study focuses on the phenotypic characterization of abdominal organs (liver, spleen, left and right kidneys, and pancreas). These target organs were automatically segmented on MRI scans of 10,000 data samples per study using a pretrained and publicly available deep learning model based on a 3D full resolution convolutional architecture (nnUNet9,18). Resulting organ segmentation masks were visually inspected for the purpose of quality control, and data samples with severe MR image artifacts or substantial automated segmentation errors were excluded. This resulted in a total of 17,996 data sets (8791 from UKBB and 9205 from NAKO) that were used for further analysis in this study. This entire process of organ segmentation and quality control is described in detail in previous work17 and was the technical basis for this work.
In a subsequent postprocessing step, the segmentation masks of the kidneys were split into a parenchymal kidney mask and a kidney hilum adipose tissue (AT) mask by applying a threshold of 0.5 to the relative signal of the fat image (=fat/[fat + water]). Thus, 7 segmentation masks were obtained per data set (5 organs + right and left kidney hilum AT). The corresponding organ and tissue volumes were calculated from these segmentation masks by multiplying the respective voxel count with the voxel volume. In addition to volume features, proton density fat fractions (PDFFs) of liver and pancreas were estimated. To this end, mean fat-image and water-image voxel signal intensities were extracted from liver and the pancreas segmentation masks, and relative fat signal intensities (=fat/[fat + water]) were computed as a measure for the relative organ fat content.19 Thus, 9 image-derived features were extracted in total (organ volumes, kidney hilum AT volumes, and PDFFs of liver and pancreas).
Analysis of the Data Generating Process
To acquire a comprehensive understanding of the data-generating process—a prerequisite for subsequent data harmonization—we combined prior knowledge with methods of causal discovery. Specifically, we used the knowledge that age was causally dependent on the data source (UKBB vs NAKO) due to different inclusion criteria among these studies. Based on common medical knowledge, we assumed that age and sex have a direct effect on height and weight, and that height has a direct effect on weight.20 Finally, based on scientific literature, it is well-established that age impacts at least a subset of the observed image features, for example, organ sizes of individuals decrease with age.21–23
Beyond these causal relations established by prior knowledge, we aimed to investigate further potential causal relations among image-derived features, observed demographic features, and the data source. To this end, we used conditional independence testing as a method of causal discovery combined with the knowledge about the direction of potential causal relation. Specifically, we assumed that observed image features are purely children of a parent-child connection in the causal sense, whereas the data source has only a parent role in the causal sense.
To identify the causal graph, we performed nonparametric nonlinear conditional independence testing by Invariant Environment Prediction previously described by Heinze-Deml et al.24 Concretely, we implemented Invariant Environment Prediction using random forest classifiers/regressors (depending on the type of target variable) that were trained with 100 trees and 5-fold cross-validation. The predictive accuracies on the respective validation sets were statistically compared using nonparametric Wilcoxon testing with a significance value of 0.01 with Holm-Bonferroni correction as previously suggested for Invariant Environment Prediction.24 The null hypothesis of statistical independence was rejected below this threshold.
Data Harmonization
Before cross-study analysis, we aimed to reduce undesired bias caused by differences in imaging protocols while preserving informative variation due to, for example, age-dependent biological effects. To this end, we used the ComBat technique initially described by Johnson et al.11 In summary, ComBat achieves batch effect correction by fitting a model to the observed data predicting the features that are to be corrected from the data source (in this case UKBB vs NAKO) and from observed covariates. Subsequently, the contribution of the data source is eliminated obtaining corrected features.
Formally, the value Yijf of a feature f of a participant j at site i is modeled as:
with αf being the feature mean, γif the site-specific deviation from the mean, βf and kj regression coefficients and input variables of which the (linear) effect should be preserved, and δif a site- and feature-dependent scaling factor for the residue εijf accounting for scaling effects. Harmonized feature values are then computed as:
preserving the influence of the input variables kj. As suggested in previous studies,7,25 we used a quadratic age-term to also account for nonlinear age-dependent feature variation.
We applied ComBat for harmonization of image features using the data source (UKBB vs NAKO) as the batch variable (of which the effect should be corrected) and based on the previous analysis of the data generating process using age, sex, height, and weight as covariates (of which the effects should be preserved). For ComBat harmonization, we chose UKBB as the reference data set in this study (ie, and δif = 1 for all image features from UKBB).
Cross-Study Analyses
Finally, we merged harmonized data from UKBB and NAKO for subsequent large-scale cross-study analyses. Specifically, we investigated age-dependent changes in extracted imaging features and performed multilinear quantile regression (with an additional quadratic age term accounting for nonlinear effects of age) describing the impact of available demographic parameters on image-derived abdominal phenotypes.
Software
All analyses were performed in Python 3 using the packages Scikit-learn (for random forest implementation, quantile regression, and statistical testing) and neuroCombat (ComBat implementation, https://github.com/Jfortin1/neuroCombat). Graphs were created using the Seaborn package.
RESULTS
Demographic Data
Image data and related demographic information from a total of 17,996 participants (8791 from UKBB and 9205 from NAKO) were included. Notably, due to different prospective inclusion criteria, participants of UKBB were on average significantly older than NAKO participants with peaks between ages 60 and 70 years in UKBB and around the age of 50 years in NAKO (Table 1, Fig. 1). Participant sex was largely balanced in both studies—a result of a balanced participant recruiting process. We observed similarly shaped empirical joint densities of body height and weight in participants from UKBB and NAKO stratified for sex (Fig. 1). Across data sets, a slight age-dependent decrease in height was observable resulting in slightly lower average height of UKBB participants (Fig. 1).
Image-Derived Features
Overall, the observed marginal densities of image-derived features showed varying degrees of deviation between UKBB and NAKO (Fig. 2A). Organ volumes of liver, spleen, and the kidney showed a tendency toward higher values in NAKO, whereas measured volumes of kidney hilar AT were slightly higher in UKBB.
FIGURE 2.
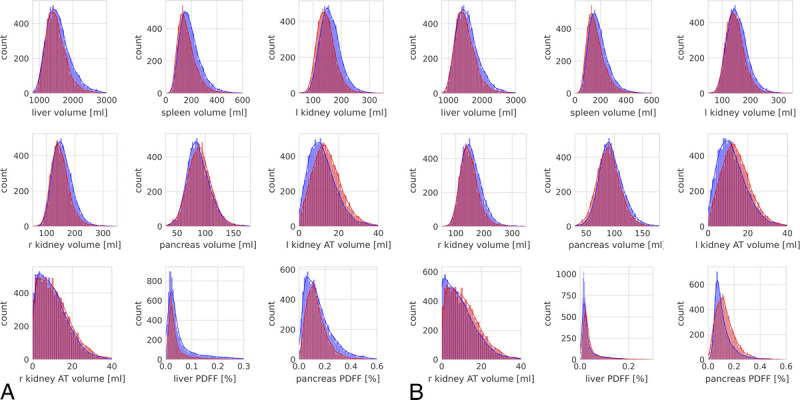
Histograms of observed marginal distributions of image-derived features from UKBB (red) and NAKO (blue) before (A) and after (B) ComBat feature harmonization.
Analysis of the Data Generating Process
To further understand these observed feature distribution shifts, we analyzed the data generating process using methods of causal discovery. We were able to use prior knowledge about the causal relation among subsets of observed variables to formulate a partial causal model of the data generating process as a starting point (Fig. 3A).
FIGURE 3.
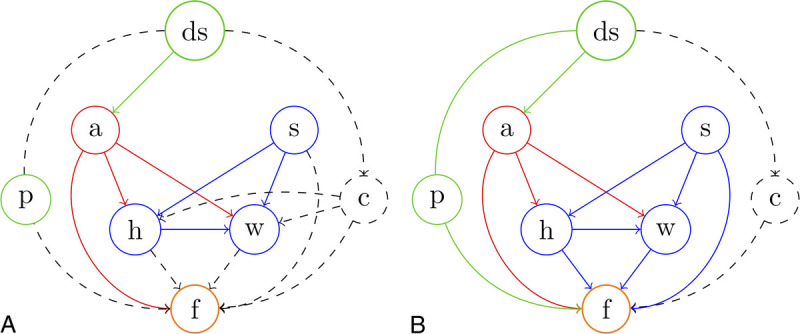
Causal view on the data generating process. ds indicates data source (UKBB vs NAKO); a, age; s, sex; h, height; w, weight; f, image features; p, imaging protocol; c, unknown confounder. Solid lines represent established causal relations; dashed lines represent possible causal relations. Solid circles represent observed variables. Dashed circles represent unobserved variables. Note that ds and p are interchangeable in this case as each study has exactly one image protocol, which is different from the other study. A, Causal graph of the data generating process based solely on prior knowledge. B, Causal graph based on prior knowledge and with additional results from causal discovery (conditional independence testing). We were able to establish a direct effect of the data source (the imaging protocol) on image features and were able to exclude indirect effects mediated by height or weight through an unknown confounder. However, the existence of an additional, unobserved confounder, beyond the different imaging protocols, cannot be excluded in principle.
Further, using nonparametric nonlinear conditional independence testing,24 we were able to uncover direct causal effects of sex (P < 0.0001), height (P < 0.0001), and weight (P < 0.0001) on observed image features and, importantly, of the image source itself (UKBB vs NAKO, P < 0.0001) on image features. In contrast, no causal effect of the data source could be observed on weight (P = 0.95) or height (P = 0.99) beyond the effect mediated by age (Fig. 3B). These results confirm a direct effect (bias) of the data source (NAKO vs UKBB) on observed image features.
Data Harmonization
Image feature harmonization across studies resulted in a better alignment of empirical marginal feature densities between UKBB and NAKO in a subset of features, particularly for pancreas volume and liver PDFF (Fig. 2B). Interestingly, the above-described distribution shifts between unharmonized features from UKBB and NAKO (Fig. 2A) were slightly even further increased through harmonization in a subset of image features, most pronounced for pancreas PDFF and right kidney AT volume (Fig. 2B). Clearly, this was a result of preserving and enhancing age-related effects through feature harmonization. As shown for liver and pancreas PDFF in Figure 4, feature harmonization resulted in a markedly improved alignment of age-dependent empirical feature densities between UKBB and NAKO and thus enhanced conspicuity of age-related changes in liver and pancreas PDFF.
FIGURE 4.
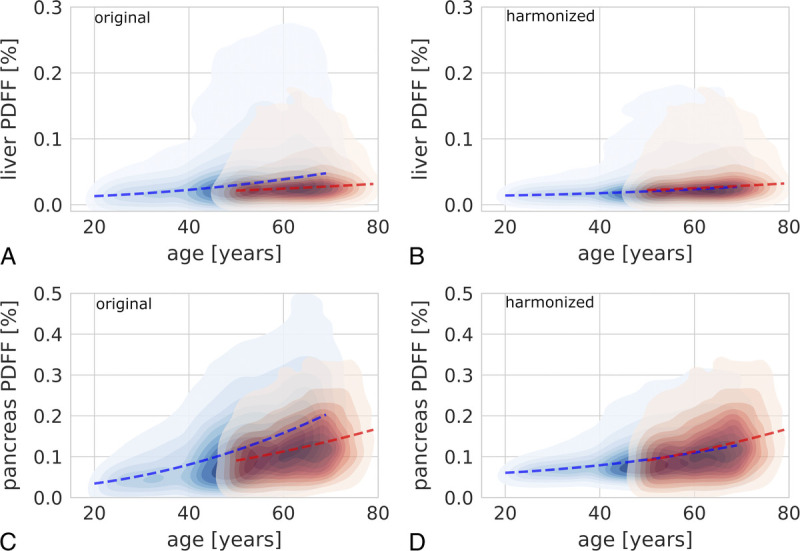
Exemplary visualization of the effect of data harmonization on cross-study analyses. A, Kernel density plot showing the change of liver proton density fat fraction (PDFF) with age on the original data (UKBB, red; NAKO, blue). B, Kernel density plot showing the change of liver PDFF with age on the harmonized data (UKBB, red; NAKO, blue). C, Kernel density plot showing the change of pancreas PDFF with age on the original data (UKBB, red; NAKO, blue). D, Kernel density plot showing the change of pancreas PDFF with age on the harmonized data (UKBB, red; NAKO, blue). Dashed red and blue lines represent 50% quantile regression separately for UKBB and NAKO data, respectively. Regression lines showed markedly better consistency between studies after feature harmonization.
In a supplemental analysis (Supplemental Material 1, http://links.lww.com/RLI/A787), we assessed the success of data harmonization by predicting the data source (UKBB vs NAKO) based on image-derived features. The underlying rationale is that, after optimal data harmonization, identification of the data source should not be possible better than by random choice. We found that before data harmonization identification of the data source based on image features was possible to a high degree, whereas after data harmonization this classification accuracy was markedly decreased, pointing to successful harmonization of image-derived features (Supplemental Material 1, http://links.lww.com/RLI/A787).
Cross-Study Analyses
Using merged harmonized data from UKBB and NAKO, we assessed age-related changes of image-derived features over a wider age range (20–80 years) than would have been possible for UKBB (50–80 years) or NAKO (20–70 years) alone.
Overall, we observed a marked, nonlinear decrease in organ volumes with age with the steepest volume decline between ages 40 and 80 years. In contrast, volumes of left and right kidney AT compartments increased substantially with age with the steepest increase between ages 40 and 80 years (Figs. 5, 6).
FIGURE 5.
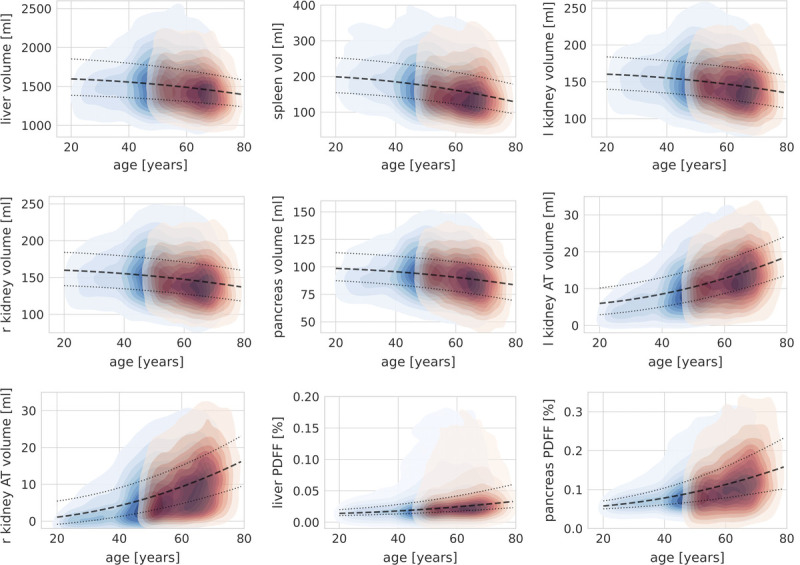
Kernel density plots showing age-dependent changes of image-derived features based on harmonized data for the liver, spleen, pancreas, left (l) and right (r) kidney volume, kidney hilum adipose tissue (AT) volume, as well as liver and pancreas proton density fat fraction (PDFF). Red, UKBB; blue, NAKO. Dashed line, 50% quantile regression line; dotted lines, 25% and 75% quantile regression lines.
FIGURE 6.
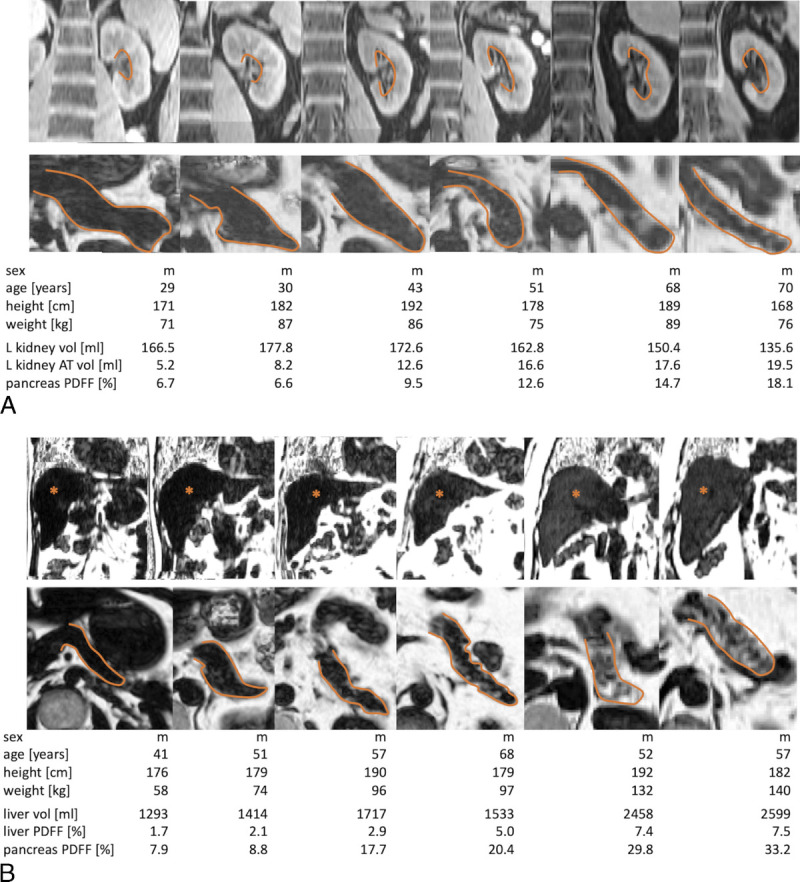
Representative examples for phenotypic organ alterations with increasing age (A) and with increasing body mass index (BMI) (B). A, Top row: water contrast images; bottom row: relative fat signal images depicting decrease in left kidney volume, increase in left kidney hilum adipose tissue (AT) (top), and increase in pancreatic fat content (bottom) in 6 representative participants (closest to the respective group median values) of increasing age (from left to right: 20–30, 30–40, 40–50, 50–60, 60–70, and 70–80 years). Orange lines mark pancreatic organ borders and the left kidney hilum. B, Top and bottom rows: relative fat signal images depicting increase in liver volume, liver fat content (top), and pancreas fat content (bottom) in 6 representative participants (closest to the respective group median values) of increasing BMI (from left to right: BMI of 15–20, 20–25, 25–30, 30–35, and 35–40 kg/m2). Orange lines mark pancreatic organ borders; asterisks mark the liver parenchyma.
Liver PDFF and pancreas PDFF both increased nonlinearly with age. This age-dependent increase in organ fat content was more pronounced for the pancreas. Regarding hepatic fat content, a slight age-dependent increase was observed, whereas a subpopulation of individuals with markedly increased hepatic fat content appeared after the age of approximately 40 years (Fig. 5).
Finally, joint analysis of harmonized data from UKBB and NAKO allowed us to generate quantitative models of interactions between epidemiological variables and image-derived features. Using quantile regression, we derived median feature values as well as 25% and 75% quantile feature values as a function of age (including a quadratic age term), weight, and height separately for male and female subpopulations. Interestingly, only the quadratic age term and body weight had nonzero coefficients in the final models (Table 2, Supplemental Material 2, http://links.lww.com/RLI/A788). These models provide a unique characterization of the expected phenotypic range of abdominal organ volumes and AT distributions in the investigated populations across a large age range. Beyond age-related changes described previously, these quantitative models revealed a positive effect of body weight on organ volumes and liver and pancreas PDFF of varying degree. Representative examples of abdominal organ phenotypes are shown in Figure 6.
TABLE 2.
Coefficients of Median (50% Quantile) Regression of Image-Derived Features Separated by Sex
| Female | Male | ||||||
|---|---|---|---|---|---|---|---|
| Interc. (%) | Age2 (%/y2) | Weight (%/kg) | Interc. (%) | Age2 (%/y2) | Weight (%/kg) | ||
| Li PDFF (%) | −5.80E-03 | 2.80E-06 | 2.40E-04 | Li PDFF | −1.50E-02 | 3.00E-06 | 3.90E-04 |
| Pc PDFF (%) | −7.40E-03 | 1.20E-05 | 8.60E-04 | Pc PDFF | −1.50E-02 | 1.90E-05 | 9.00E-04 |
| Interc. (mL) | Age2 (mL/y2) | Weight (mL/kg) | Interc. (mL) | Age2 (mL/y2) | Weight (mL/kg) | ||
|---|---|---|---|---|---|---|---|
| Li vol (mL) | 6.60E+02 | −2.10E-02 | 1.10E+01 | Li vol | 6.70E+02 | −4.00E-02 | 1.30E+01 |
| Sp vol (mL) | 9.20E+01 | −1.10E-02 | 1.20E+00 | Sp vol | 1.20E+02 | −1.30E-02 | 1.40E+00 |
| Kd l vol (mL) | 1.20E+02 | −5.30E-03 | 4.10E-01 | Kd l vol | 1.00E+02 | −3.80E-03 | 8.70E-01 |
| Kd r vol (mL) | 1.20E+02 | −4.60E-03 | 4.40E-01 | Kd r vol | 1.00E+02 | −3.30E-03 | 8.50E-01 |
| Pc vol (mL) | 8.40E+01 | −3.50E-03 | 1.70E-01 | Pc vol | 7.40E+01 | −2.30E-03 | 3.90E-01 |
| Kd l AT vol (mL) | −3.20E+00 | 1.90E-03 | 9.60E-02 | Kd l AT vol | −4.30E+00 | 2.20E-03 | 1.40E-01 |
| Kd r AT vol (mL) | −7.10E+00 | 1.80E-03 | 9.40E-02 | Kd r AT vol | −1.20E+01 | 2.80E-03 | 1.80E-01 |
The coefficients for the linear age term and the height term were 0 in all regression models and were thus omitted in this table.
Li, liver; Pc, pancreas; Sp, spleen; Kd l, left kidney; Kd r, right kidney; Kd l AT, left kidney hilum adipose tissue; Kd r AT, right kidney hilum adipose tissue; PDFF, proton density fat fraction; Interc., intercept.
DISCUSSION
In this study, we demonstrated joint, cross-study analysis of imaging data from UKBB and NAKO. We investigated the data generating process and corrected for undesired bias related to the data source. After data harmonization, we performed cross-study analyses characterizing abdominal organ phenotypes in the normal population across a wide age range.
To understand data biases, we investigated the data generating process using a combination of prior knowledge and methods of causal discovery. We found that the data source (UKBB vs NAKO) had a direct effect on image-derived features beyond the effects of age, sex, height, and weight. This source-related bias is most likely the result of differences in the image acquisition process between the studies resulting in acquisition shift.16 Beyond the effects of different imaging protocols, however, it cannot be excluded that unobserved confounders (eg, differences in ethnicity, lifestyle, or nutrition between UKBB and NAKO participants) mediate additional effects of the data source on image features. Overall, we expect these unobserved effects to be far less significant compared with the direct effects of different imaging protocols on image features.
Cross-study analysis of image features revealed how joint analysis of data from different sources enables a more comprehensive understanding of phenotypic variation. We were able to characterize age-related changes of abdominal organ phenotypes in a way that reflects the majority of the adult population in the United Kingdom and Germany. What has been previously reported for small cohorts with a focus on single organs was possible in this study on a large and representative data set thanks to a combination of a unique large-scale data, automated feature extraction using deep learning and cross-study analysis of harmonized data, grounded in causal analysis of the data generating process. We were thus able to provide quantitative models for abdominal organ volumes as well as abdominal AT distribution (liver PDFF, pancreas PDFF, kidney hilum AT volume). This information can potentially be used for defining normative and reference values also in clinical settings with diagnostic utility. To this end, however, the analysis of all data to be acquired in UKBB and NAKO as well as their joint interpretation with outcome data will be required.
The observed ranges of organ volumes in this study are in accordance with existing literature reports.26–31 Similarly, our findings on AT distribution are comparable to previous reports on liver PDFF,32 pancreas PDFF,33 and kidney hilum AT.34 In contrast to these previous studies, the size of the underlying data combined with the wide age range of participants in our study provide a much more comprehensive and general description of parameter distribution.
This study has limitations. Most importantly, feature extraction can be further improved for a subset of features by using dedicated image sequences available in UKBB and NAKO. For example, the analysis of dedicated multiecho sequences for estimation of liver and pancreas PDFF may increase accuracy for these parameters. Furthermore, the addition of further nonimaging data will allow for a more detailed understanding of the data generating process by considering information about, for example, lifestyle, patient history, or genetic predispositions. We will have to leave these analyses to future studies that can be performed once data collection in UKBB and NAKO are completed.
ComBat normalization (and comparable methods), by design, is performed relative to a reference, which can be one of the included data sets or their weighted combination. Without external calibration, the choice of this reference is not well-defined. In this study, we chose UKBB as the reference data set. The rational for this choice was the assumption that particularly signal intensity measurements are more robust and less prone to artifacts on a 1.5 T scanner with larger voxel size due to higher field homogeneity and less noise or ghosting artifacts. To resolve the question of the choice of reference more definitely, additional external calibration measurements (eg, multiecho acquisitions available in UKBB for precise PDFF estimation) will be required in future studies.
In this study, we provided a blueprint of how cross-study analyses can be performed in the context of epidemiological cohort imaging studies and demonstrated the remarkable potential of such analyses.
In conclusion, cross-study analysis of image-derived features from UKBB and NAKO is feasible and can provide unique, population-wide insights into imaging phenotypes and their relation to epidemiological data. Data from UKBB and NAKO harmonized as proposed in this work can be helpful for future joint data analyses across cohorts linking genetic, environmental, and behavioral risk factors to MRI-derived phenotypes and provide reference values for clinical diagnostics.
Supplementary Material
ACKNOWLEDGMENTS
This project was conducted with data from the German National Cohort (NAKO) (www.nako.de). The NAKO is funded by the Federal Ministry of Education and Research (project funding reference numbers: 01ER1301A/B/C and 01ER1511D), German Federal States, and the Helmholtz Association with additional financial support by the participating universities and the institutes of the Leibniz Association. The authors thank all participants who took part in the NAKO study and the staff in this research program.
This work was carried out under UKBB Application 12579. The authors wish to thank all UKBB participants and staff.
This research was supported by the UK Research and Innovation London Medical Imaging and Artificial Intelligence Centre for Value Based Healthcare and in part by the German Research Foundation (project number 428219130). This project conducted under Germany's Excellence Strategy, EXC number 2064/1, project number 390727645.
Footnotes
S.G. and T.K. contributed equally to this work.
Conflicts of interest and sources of funding: none declared.
Supplemental digital contents are available for this article. Direct URL citations appear in the printed text and are provided in the HTML and PDF versions of this article on the journal’s Web site (www.investigativeradiology.com).
Contributor Information
Turkay Kart, Email: t.kart@imperial.ac.uk.
Marc Fischer, Email: marc.fischer@iss.uni-stuttgart.de.
Stefan Winzeck, Email: stefan.winzeck13@imperial.ac.uk;.
Ben Glocker, Email: b.glocker@imperial.ac.uk.
Wenjia Bai, Email: w.bai@imperial.ac.uk.
Robin Bülow, Email: Robin.Buelow@med.uni-greifswald.de.
Carina Emmel, Email: carina.emmel@uk-essen.de.
Lena Friedrich, Email: Lena.Friedrich@uk-augsburg.de.
Hans-Ulrich Kauczor, Email: hans-ulrich.kauczor@med.uni-heidelberg.de.
Thomas Keil, Email: thomas.keil@charite.de.
Thomas Kröncke, Email: thomas.keil@charite.de.
Philipp Mayer, Email: philipp1.mayer@med.uni-heidelberg.de.
Thoralf Niendorf, Email: thoralf.niendorf@mdc-berlin.de.
Annette Peters, Email: peters@helmholtz-muenchen.de.
Tobias Pischon, Email: tobias.pischon@mdc-berlin.de.
Benedikt M. Schaarschmidt, Email: benedikt.schaarschmidt@uk-essen.de.
Börge Schmidt, Email: benedikt.schaarschmidt@uk-essen.de.
Matthias B. Schulze, Email: mschulze@dife.de.
Lale Umutle, Email: Lale.Umutlu@uk-essen.de.
Henry Völzke, Email: voelzke@uni-greifswald.de.
Thomas Küstner, Email: thomas.kuestner@med.uni-tuebingen.de.
Fabian Bamberg, Email: fabian.bamberg@uniklinik-freiburg.de.
Bernhard Schölkopf, Email: bs@tuebingen.mpg.de.
Daniel Rueckert, Email: daniel.rueckert@tum.de.
REFERENCES
- 1.Petersen SE Matthews PM Bamberg F, et al. Imaging in population science: cardiovascular magnetic resonance in 100,000 participants of UK Biobank—rationale, challenges and approaches. J Cardiovasc Magn Reson. 2013;15:46. [DOI] [PMC free article] [PubMed] [Google Scholar]
- 2.Bamberg F Kauczor HU Weckbach S, et al. Whole-body MR imaging in the German National Cohort: rationale, design, and technical background. Radiology. 2015;277:206–220. [DOI] [PubMed] [Google Scholar]
- 3.Gatidis S Heber SD Storz C, et al. Population-based imaging biobanks as source of big data. Radiol Med. 2017;122:430–436. [DOI] [PubMed] [Google Scholar]
- 4.Allen J Inder KJ Lewin TJ, et al. Integrating and extending cohort studies: lessons from the eXtending Treatments, Education and Networks in Depression (xTEND) study. BMC Med Res Methodol. 2013;13:122. [DOI] [PMC free article] [PubMed] [Google Scholar]
- 5.Collins FS, Manolio TA. Merging and emerging cohorts: necessary but not sufficient. Nature. 2007;445:259. [DOI] [PubMed] [Google Scholar]
- 6.Hagiwara A Fujita S Ohno Y, et al. Variability and standardization of quantitative imaging: monoparametric to multiparametric quantification, radiomics, and artificial intelligence. Invest Radiol. 2020;55:601–616. [DOI] [PMC free article] [PubMed] [Google Scholar]
- 7.Wachinger C Rieckmann A Polsterl S, et al. Detect and correct bias in multi-site neuroimaging datasets. Med Image Anal. 2021;67:101879. [DOI] [PubMed] [Google Scholar]
- 8.Schlett CL Hendel T Hirsch J, et al. Quantitative, organ-specific interscanner and intrascanner variability for 3 T whole-body magnetic resonance imaging in a multicenter, multivendor study. Invest Radiol. 2016;51:255–265. [DOI] [PubMed] [Google Scholar]
- 9.Kart T Fischer M Kustner T, et al. Deep learning–based automated abdominal organ segmentation in the UK Biobank and German National Cohort Magnetic Resonance Imaging Studies. Invest Radiol. 2021;56:401–408. [DOI] [PubMed] [Google Scholar]
- 10.Schuppert C Kruchten RV Hirsch JG, et al. Whole-body magnetic resonance imaging in the large population-based German National Cohort Study: predictive capability of automated image quality assessment for protocol repetitions. Invest Radiol. 2022;57:478–487. [DOI] [PubMed] [Google Scholar]
- 11.Johnson WE, Li C, Rabinovic A. Adjusting batch effects in microarray expression data using empirical Bayes methods. Biostatistics. 2007;8:118–127. [DOI] [PubMed] [Google Scholar]
- 12.Beer JC Tustison NJ Cook PA, et al. Longitudinal ComBat: a method for harmonizing longitudinal multi-scanner imaging data. Neuroimage. 2020;220:117129. [DOI] [PMC free article] [PubMed] [Google Scholar]
- 13.Da-Ano R Masson I Lucia F, et al. Performance comparison of modified ComBat for harmonization of radiomic features for multicenter studies. Sci Rep. 2020;10:10248. [DOI] [PMC free article] [PubMed] [Google Scholar]
- 14.Horng H Singh A Yousefi B, et al. Generalized ComBat harmonization methods for radiomic features with multi-modal distributions and multiple batch effects. Sci Rep. 2022;12:4493. [DOI] [PMC free article] [PubMed] [Google Scholar]
- 15.Glymour C, Zhang K, Spirtes P. Review of causal discovery methods based on graphical models. Front Genet. 2019;10:524. [DOI] [PMC free article] [PubMed] [Google Scholar]
- 16.Castro DC, Walker I, Glocker B. Causality matters in medical imaging. Nat Commun. 2020;11:3673. [DOI] [PMC free article] [PubMed] [Google Scholar]
- 17.Kart T Fischer M Winzeck S, et al. Quality control matters: automated magnetic resonance imaging-based abdominal organ segmentation in 20,000 participants of the UK Biobank and German National Cohort Studies. Sci Rep. 2022;12:18733. [DOI] [PMC free article] [PubMed] [Google Scholar]
- 18.Isensee F Jaeger PF Kohl SAA, et al. nnU-net: a self-configuring method for deep learning–based biomedical image segmentation. Nat Methods. 2021;18:203–211. [DOI] [PubMed] [Google Scholar]
- 19.Reeder SB, Sirlin CB. Quantification of liver fat with magnetic resonance imaging. Magn Reson Imaging Clin N Am. 2010;18:337–357, ix. [DOI] [PMC free article] [PubMed] [Google Scholar]
- 20.Dubois L Ohm Kyvik K Girard M, et al. Genetic and environmental contributions to weight, height, and BMI from birth to 19 years of age: an international study of over 12,000 twin pairs. PLoS One. 2012;7:e30153. [DOI] [PMC free article] [PubMed] [Google Scholar]
- 21.Denic A, Glassock RJ, Rule AD. Structural and functional changes with the aging kidney. Adv Chronic Kidney Dis. 2016;23:19–28. [DOI] [PMC free article] [PubMed] [Google Scholar]
- 22.Löhr JM Panic N Vujasinovic M, et al. The ageing pancreas: a systematic review of the evidence and analysis of the consequences. J Intern Med. 2018;283:446–460. [DOI] [PubMed] [Google Scholar]
- 23.Hunt NJ Kang SWS Lockwood GP, et al. Hallmarks of aging in the liver. Comput Struct Biotechnol J. 2019;17:1151–1161. [DOI] [PMC free article] [PubMed] [Google Scholar]
- 24.Heinze-Deml C, Peters J, Meinshausen N. Invariant causal prediction for nonlinear models. arXiv e-prints. 2017;arXiv:1706.08576. [Google Scholar]
- 25.Walhovd KB Westlye LT Amlien I, et al. Consistent neuroanatomical age-related volume differences across multiple samples. Neurobiol Aging. 2011;32:916–932. [DOI] [PMC free article] [PubMed] [Google Scholar]
- 26.Harada K Ishinuki T Ohashi Y, et al. Nature of the liver volume depending on the gender and age assessing volumetry from a reconstruction of the computed tomography. PLoS One. 2021;16:e0261094. [DOI] [PMC free article] [PubMed] [Google Scholar]
- 27.Chow KU Luxembourg B Seifried E, et al. Spleen size is significantly influenced by body height and sex: establishment of normal values for spleen size at US with a cohort of 1200 healthy individuals. Radiology. 2016;279:306–313. [DOI] [PubMed] [Google Scholar]
- 28.Langner T Ostling A Maldonis L, et al. Kidney segmentation in neck-to-knee body MRI of 40,000 UK Biobank participants. Sci Rep. 2020;10:20963. [DOI] [PMC free article] [PubMed] [Google Scholar]
- 29.Piras D Masala M Delitala A, et al. Kidney size in relation to ageing, gender, renal function, birthweight and chronic kidney disease risk factors in a general population. Nephrol Dial Transplant. 2020;35:640–647. [DOI] [PMC free article] [PubMed] [Google Scholar]
- 30.Owler J Triay Bagur A Marriage S, et al. Pancreas volumetry in UK Biobank: comparison of models and inference at scale. In: Papież BW, Yaqub M, Jiao J, Namburete AIL, Noble JA, editors. Medical Image Understanding and Analysis. MIUA 2021. Lecture Notes in Computer Science. Springer, Cham, Switzerland; 2021:265–279. doi: 10.1007/978-3-030-80432-9_21. [DOI] [Google Scholar]
- 31.Saisho Y Butler AE Meier JJ, et al. Pancreas volumes in humans from birth to age one hundred taking into account sex, obesity, and presence of type-2 diabetes. Clin Anat. 2007;20:933–942. [DOI] [PMC free article] [PubMed] [Google Scholar]
- 32.Ulbrich EJ Fischer MA Manoliu A, et al. Age- and gender dependent liver fat content in a healthy normal BMI population as quantified by fat-water separating DIXON MR imaging. PLoS One. 2015;10:e0141691. [DOI] [PMC free article] [PubMed] [Google Scholar]
- 33.Heber SD Hetterich H Lorbeer R, et al. Pancreatic fat content by magnetic resonance imaging in subjects with prediabetes, diabetes, and controls from a general population without cardiovascular disease. PLoS One. 2017;12:e0177154. [DOI] [PMC free article] [PubMed] [Google Scholar]
- 34.Notohamiprodjo M Goepfert M Will S, et al. Renal and renal sinus fat volumes as quantified by magnetic resonance imaging in subjects with prediabetes, diabetes, and normal glucose tolerance. PLoS One. 2020;15:e0216635. [DOI] [PMC free article] [PubMed] [Google Scholar]
Associated Data
This section collects any data citations, data availability statements, or supplementary materials included in this article.