

Abstract
Background.
The incidence of diabetes is increasing in youth. Our aim was to describe the incidence of type 1 diabetes (T1D) and type 2 diabetes (T2D) in US youth aged < 20 years over a 17-year period.
Methods.
The SEARCH for Diabetes in Youth Study identified youth with a physician diagnosis of T1D or T2D at five US centers between 2002–2018. The number of youth at risk was obtained from the census or health plan member counts. Generalized autoregressive moving average models were used to examine trends, and data were presented as incidence per 100,000 youth across categories of age, sex, race, ethnicity, geographic region, and month/season of diagnosis.
Findings.
We identified 18,169 youth aged 0–19 years with T1D and 5,293 youth aged 10–19 years with T2D in over 85 million person-years. The annual incidence for T1D and T2D was 22·2/100,000 and 17·9/100,000 in 2017/2018, respectively. The model for trend captured both a linear effect and a moving average effect, with a significant increasing (annual) linear effect for both T1D (2·0%) and T2D (5·3%). Youth from racial and ethnic minority groups had greater increases in incidence for both types of diabetes. Peak age at diagnosis was 10 and 16 years, for T1D and T2D, respectively. Season was significant (p<0·001) with a January peak in T1D and an August peak in T2D.
Interpretation.
The increasing incidence of T1D and T2D in US youth will result in an expanding population of young adults at risk for developing early complications of diabetes, whose health care needs will exceed those of their peers. Findings regarding age and season of diagnosis will inform focused prevention efforts.
Funding.
Centers for Disease Control and Prevention and National Institutes of Health
Diabetes is one of the most common chronic diseases among persons aged <20 years1. Onset of diabetes in the first two decades of life is associated with numerous complications, including diabetic kidney disease, retinopathy, and peripheral neuropathy2. Diabetes-related complications and all-cause mortality are more common among individuals with youth-onset type 2 diabetes (T2D) than those with youth-onset type 1 diabetes (T1D)2,3. The SEARCH for Diabetes in Youth Study (SEARCH) has reported increases in the incidence of T1D and T2D in US youth for the period 2002–2015, with rates of increase being greater for T2D than T1D4, 5. Steeper increases in age- and sex-adjusted incidence of T1D and T2D have been observed in youth from race and ethnic minority groups, with limited (T1D) or no increases (T2D) observed among non-Hispanic White youth. Thus, the increasing incidence of both T1D and T2D in youth along with the associated morbidity and mortality and growing race and ethnic disparities is a clinical and public health concern.
In this report, SEARCH extends the prior findings by three additional years to examine whether the previously observed trends are changing, overall and within specific racial or ethnic subgroups. Additionally, this report examines the peak age of diagnosis and the peak season of diagnosis, neither of which have been previously reported for youth with T2D. These data may provide information on the optimal period(s) to target prevention or interventions, as well as provide ideas about the underlying pathophysiology of youth-onset diabetes.
METHODS
Study Design and Population
SEARCH is a population-based study of diabetes from 2002–2018 of approximately 5 million youth aged <20 years under surveillance (85 million person-years), covering geographically defined populations in Colorado (all 64 counties plus selected American Indian reservations in Arizona and New Mexico), Ohio (eight counties), South Carolina (all 46 counties), Washington (five counties), and Kaiser Permanente Southern California (KPSC) health plan enrollees in seven counties. The combined populations in these areas resemble the US population with regards to race, ethnicity, age, parental education, and household income6. Eligible participants included nonmilitary and noninstitutionalized persons with diabetes other than gestational diabetes diagnosed at age <20 years and who resided in one of the study areas at the time of diagnosis. For persons in California, eligibility required membership in KPSC, and for American Indians, participation in Indian Health Services (IHS) at the time of diagnosis. All participating sites received Institutional Review Board approval for this research. The study protocol is located at https://searchfordiabetes.org.
Case Characteristics
Trained research staff identified new (incident) diabetes cases through physicians’ report, medical record review, and self-report. Cases were considered valid if the medical record indicated a physician diagnosis, the diagnosis was verified directly by a physician, or the participant was referred directly from a physician, while eligibility was based on age and area of residence in the year of diagnosis. Participants or their parent/guardian completed a survey that recorded age, date of diagnosis, sex, self-reported race and ethnicity, and place of residence at the time of diagnosis. Medical records served as the secondary source for these variables when survey data was unavailble. Diabetes type was the physician-assigned type six months after diagnosis. Date of diagnosis was from medical records or local clinical registries. Case presentation was based on the parent/guardian survey that included the question, “How did you find out you had diabetes?” Response categories were symptoms, checkup (i.e., routine health visit), community screening, or other.
Incident Cases and Population at Risk
The analyses included all cases with a diagnosis year of 2002–2018, the last complete year for which SEARCH ascertained incident diabetes. T1D cases included those aged birth-19 years of age at diagnosis. T2D cases included those aged 10–19 years. Although SEARCH conducted surveillance of all youth below age 20, few youth below the age of 10 with T2D were identified (225 total: 6 aged 0–4 years and 219 aged 5–9 years; approximately half [110] were aged 9 years). Youth with all other types of diabetes, including secondary forms (e.g., diabetes due to cystic fibrosis or glucocorticoid-induced diabetes) and those with missing/unknown/other types, were excluded from these analyses.
The annual population at risk (denominators) included youth younger than 20 years of age on December 31 of the incident year and civilian residents of the geographic study areas, members of KPSC residing in seven counties in southern California, or IHS beneficiaries at participating Native American reservations. For the geographically based centers, denominators used the bridged-race intercensal and vintage 2019 postcensal population estimates7. For KPSC, addresses were geocoded to the Census block level, and race and ethnic-group–specific proportions were applied to estimate the racial and ethnic-group composition of youths according to age and sex.
For Native American reservations, the IHS user population for the previous three years was used following IHS definitions. The last year of denominator data from the IHS was 2016; these same denominators were used for 2017 and 2018. Denominator estimates were then summed across all five centers.
Statistical Analysis
Unadjusted annual incidence rates were calculated as the number of registered cases divided by the number of persons in the respective group in the surveillance networks over the same period. Rates are presented as 2-year moving averages expressed per 100,000 youth, overall, and according to age group, sex, and race or ethnic group. The 95% confidence intervals (CIs) for the annual unadjusted rates were calculated using the skew-corrected inverted score test, assuming a binomial distribution. Adjustments for age, sex, race, or ethnic group, and estimation of the annual rate of change were performed in a modeling framework.
Trends in incidence were tested with a generalized autoregressive moving average (GARMA) to capture the serial correlation between estimates8. Likelihood-ratio tests were performed to compare three possible formulations: a first-order autoregressive and first-order moving-average model (GARMA [1, 1]), a first-order autoregressive model (GARMA [1, 0]), and a first-order moving-average model (GARMA [0, 1]). Model selection suggested that the first-order moving-average model (GARMA [0, 1]) provided the best fit for most models. Models for the overall incidence estimate adjusted for age, race and sex, are shown in the Appendix. Since the GARMA [0, 1] model also captures the serial correlation between incidence estimates obtained for two consecutive years, the overall trend contains both the linear effect and the moving average effect. Consequently, our change estimates must be interpreted with caution because the dependence on the estimate observed in the previous year is not captured in the linear effect.
Overall trends were adjusted for age, sex, and race or ethnic group, and unadjusted trends in incidence were estimated. The model treated the observed number of cases each year as the outcome and the corresponding denominator as an offset. Homogeneity of effects over time across age, sex, and race or ethnicity was tested by including a group-by-time interaction term in the model. The GARMA model was fitted assuming incident counts follow a negative binomial distribution with a logarithmic link. Likelihood ratio tests for quadratic and cubic trends were also considered.
We assessed the completeness of case ascertainment for the four geographically based centers using the capture-recapture method9. The number of times an individual case was found in a hospital and other clinical setting was used to estimate the number of “recaptured” (and missed) cases. Capture-recapture was not performed in the health plan surveillance area since there were not two independent sources of cases.
Case presentation patterns were examined in 3-year periods to assess change over time, and were examined by month of diagnosis aggregated across all 17 years to explore possible explanations for seasonal (monthly) trends10.
Peak age at diagnosis of diabetes was examined within subgroups of sex, race, and ethnicity for two periods (2002–2009 and 2010–2018). Using a bootstrapping approach, we identified the peak over the entire age range by single year of age and generated 95% CIs. No modeling was conducted.
Seasonality of diagnosis was explored visually using polar seasonal plots which present the distribution of cases by month of diagnosis, by study site, and by two periods (2002–2009 and 2010–2018). Seasonality was tested using a GARMA model, where the monthly count of incident cases served as the outcome. The model was adjusted for age, sex, and race/ethnicity and included a 12-month lag term which was used to test for the presence of a seasonal effect.11
RESULTS
From 2002 through 2018, SEARCH identified 18,169 youth with T1D among 85 million person-years of youth aged 0–19 years and 5,293 youth with T2D among 44 million person-years of youth aged 10–19 years. Based on capture/recapture analysis, few cases were missed. Completeness ranged from 97–99% across the 17-year period for T1D and 91–96% for T2D, and was stable across the age range but dropped by approximately 20% among those aged 18 and 19 for both T1D and T2D.
Overall, the GARMA model suggested an increasing linear trend combined with a positive correlation between two consecutive incidence estimates for both T1D and T2D (Table 1, Figure 1, Appendix Tables 1–6). For T1D, a significant upward trend in the age-, sex- and race/ethnicity-adjusted incidence was observed from 19·5 cases per 100,000 youths per year in 2002–2003 to 22·2 cases per 100,000 youths per year in 2017–2018, with an annual rate of increase of 2·02%, (95% CI 1·54, 2·49%). For the overall estimate, the moving average component revealed a positive correlation between two consecutive incidence estimates (r=0·12; Appendix), suggesting that although the overall tendency is increasing over time, errors around this trend are not independently distributed. Variation in the incidence estimate in a given year also depends on the incidence observed in the preceding year.
Table 1.
Incidence of type 1 and type 2 diabetes in youth and adjusteda annual percentage change
| Type 1 Diabetes (0–19 year-olds) | Type 2 Diabetes (10–19 year-olds) | |||||||||
|---|---|---|---|---|---|---|---|---|---|---|
| Number of new casesb | Incidence per 100,000 youthb | Adjusted annual percentage change (95% CI) | Number of new casesb | Incidence per 100,000 of periodb | Adjusted annual percentage change (95% CI) | |||||
| 2003 | 2018 | 2003 | 2018 | 2003 | 2018 | 2003 | 2018 | |||
| ALL | 939 | 1158 | 19.5 | 22.2 | 2.02 (1.54, 2.49) | 226 | 478 | 9.0 | 17.9 | 5.31 (4.46, 6.17) |
| Age (yr) | ||||||||||
| 0–4 | 188 | 179 | 16.5 | 14.4 | 0.56 (−0.48, 1.61) | ∙∙ | ∙∙ | ∙∙ | ∙∙ | ∙∙ |
| 5–9 | 279 | 341 | 24.0 | 26.2 | 1.98 (1.12, 2.84) | ∙∙ | ∙∙ | ∙∙ | ∙∙ | ∙∙ |
| 10–14 | 338 | 445 | 26.4 | 33.2 | 2.46 (1.64, 3.29) | 103 | 215 | 8.0 | 16.0 | 4.73 (3.50, 5.98) |
| 15–19 | 135 | 194 | 11.0 | 14.6 | 2.75 (1.69, 3.82) | 123 | 263 | 10.0 | 19.7 | 5.83 (4.65, 7.02) |
| Sex | ||||||||||
| Female | 451 | 526 | 19.2 | 20.6 | 1.70 (1.02, 2.39) | 136 | 283 | 11.1 | 21.6 | 5.35 (4.19, 6.52) |
| Male | 488 | 633 | 19.8 | 23.8 | 2.30 (1.64, 2.96) | 90 | 195 | 7.0 | 14.3 | 5.26 (3.95, 6.58) |
| Race and Ethnicity | ||||||||||
| American Indian | 9 | 8 | 6.6 | 7.8 | 1.79 (−2.31, 6.06) | 16 | 26 | 22.6 | 46.0 | 3.51 (0.86, 6.23) |
| Asian/Pacific Islander | 18 | 35 | 7.9 | 9.4 | 4.84 (2.57, 7.15) | 13 | 32 | 11.0 | 16.6 | 8.92 (5.80, 12.13) |
| Hispanic | 112 | 215 | 13.7 | 17.7 | 4.14 (3.19, 5.10) | 54 | 161 | 13.3 | 25.8 | 7.17 (5.67, 8.71) |
| Non-Hispanic Black | 105 | 161 | 14.7 | 22.1 | 2.93 (1.91, 3.96) | 76 | 184 | 20.0 | 50.1 | 5.99 (4.58, 7.41) |
| Non-Hispanic White | 694 | 739 | 23.9 | 26.4 | 0.60 (0.04, 1.16) | 67 | 75 | 4.4 | 5.2 | 1.83 (0.22, 3.47) |
Adjusted for age, sex, and race/ethnicity
2-year moving average of new cases for that year and the preceding year, i.e., ‘2003’ is the average of 2002 and 2003
Figure 1. Annual adjusted incidence rates for type 1 and type 2 diabetes.
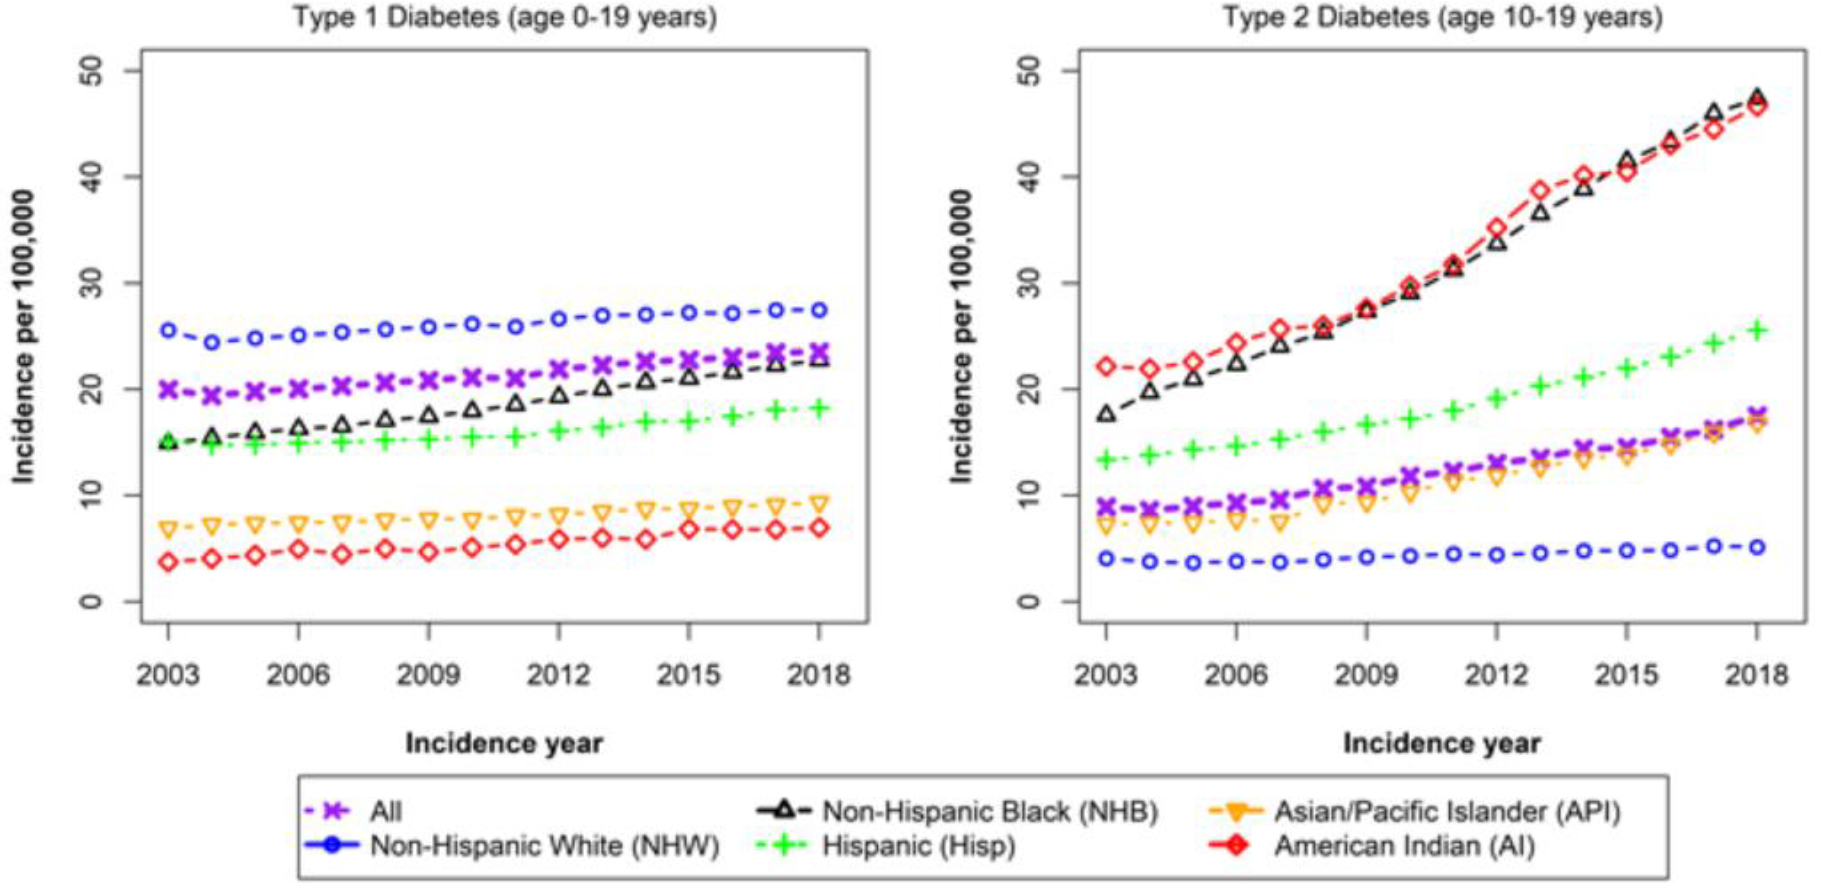
The upward trend in the adjusted incidence of T2D was greater, from 9·0 cases per 100,000 youths per year in 2002–2003 to 17·9 cases per 100,000 youths per year in 2017–2018, with an annual rate of increase of 5·31% (95% CI 4·46, 6·17%). The correlation between incidence estimates was 0·20.
Annual rates of increase for T1D was highest for Asian/Pacific Islander, Hispanic, and non-Hispanic Black youth, measuring 4·84%, 4·14%, and 2·93%, respectively. Annual rates of increase for T2D were also highest for Asian/Pacific Islander, Hispanic, and non-Hispanic Black youth, with increases of 8·92%, 7·17%, and 5·99%, respectively. By 2018 in 15–19 year old youth, the overall incidence of T2D had exceeded that of T1D (19·7/100,000 vs 14·6/100,000, respectively).
For T1D, 94–95% of all cases were identified through symptoms, with no significant change over time after adjustment for age, sex, and race (Appendix Table 7). However, a growing proportion of T2D cases were identified by routine health visits (26.4% in 2002 vs. 45.2% in 2018) with a corresponding decline in cases presenting with symptoms (68.9% vs 51.8%) (p<0.0001).
Peak incidence occurred at age 10 years for T1D among 0–19 year-olds and age 16 years for T2D among 10–19 year-olds (Table 2 and Figure 2). For T1D, males had a later peak (12 years) than females (10 years), and Hispanic and Asian Pacific Islander youth (9 years) had earlier peaks than other racial and ethnic groups (10–11 years). For T2D, males and females, and all racial and ethnic minority groups (except non-Hispanic Black youth) had the same peak age at 16 years. Non-Hispanic Black youth had an earlier peak at 13 years. Peak age did not differ between the two periods (2002–2009 and 2010–2018) for either T1D or T2D. Appendix Figure 1 shows the age distributions by race, ethnicity, and sex, and suggest that for T2D in non-Hispanic Black youth the peak occurs earlier in girls than in boys.
TABLE 2.
Age of peak diabetes incidence according to sex, race/ethnicity, and period
| Type 1 | Type 2 | |||
|---|---|---|---|---|
| N | Age (95% CI) | N | Age (95% CI) | |
| All | 18,169 | 10 (8, 11) | 5,293 | 16 (16, 17) |
| Sex | ||||
| Female | 8,474 | 10 (9, 11) | 3,171 | 16 (12, 17) |
| Male | 9,695 | 12 (9, 13) | 2,122 | 16 (13, 17) |
| Race and Ethnicity | ||||
| American Indian | 125 | 11 (8, 17) | 339 | 16 (14, 17) |
| Asian/Pacific Islander | 420 | 9 (9, 16) | 300 | 16 (14, 17) |
| Hispanic | 2,836 | 9 (9, 12) | 1,637 | 16 (14, 18) |
| Non-Hispanic Black | 2,251 | 10 (8, 12) | 1,935 | 13 (13, 16) |
| Non-Hispanic White | 12,537 | 10 (9, 12) | 1,082 | 16 (14, 17) |
| Period | ||||
| 2002–2009 | 8,097 | 10 (9, 12) | 1,891 | 16 (13, 16) |
| 2010–2018 | 10,072 | 10 (8, 11) | 3,402 | 16 (14, 17) |
Figure 2. Incidence of type 1 and type 2 diabetes in males and females by single year of age of diagnosis.
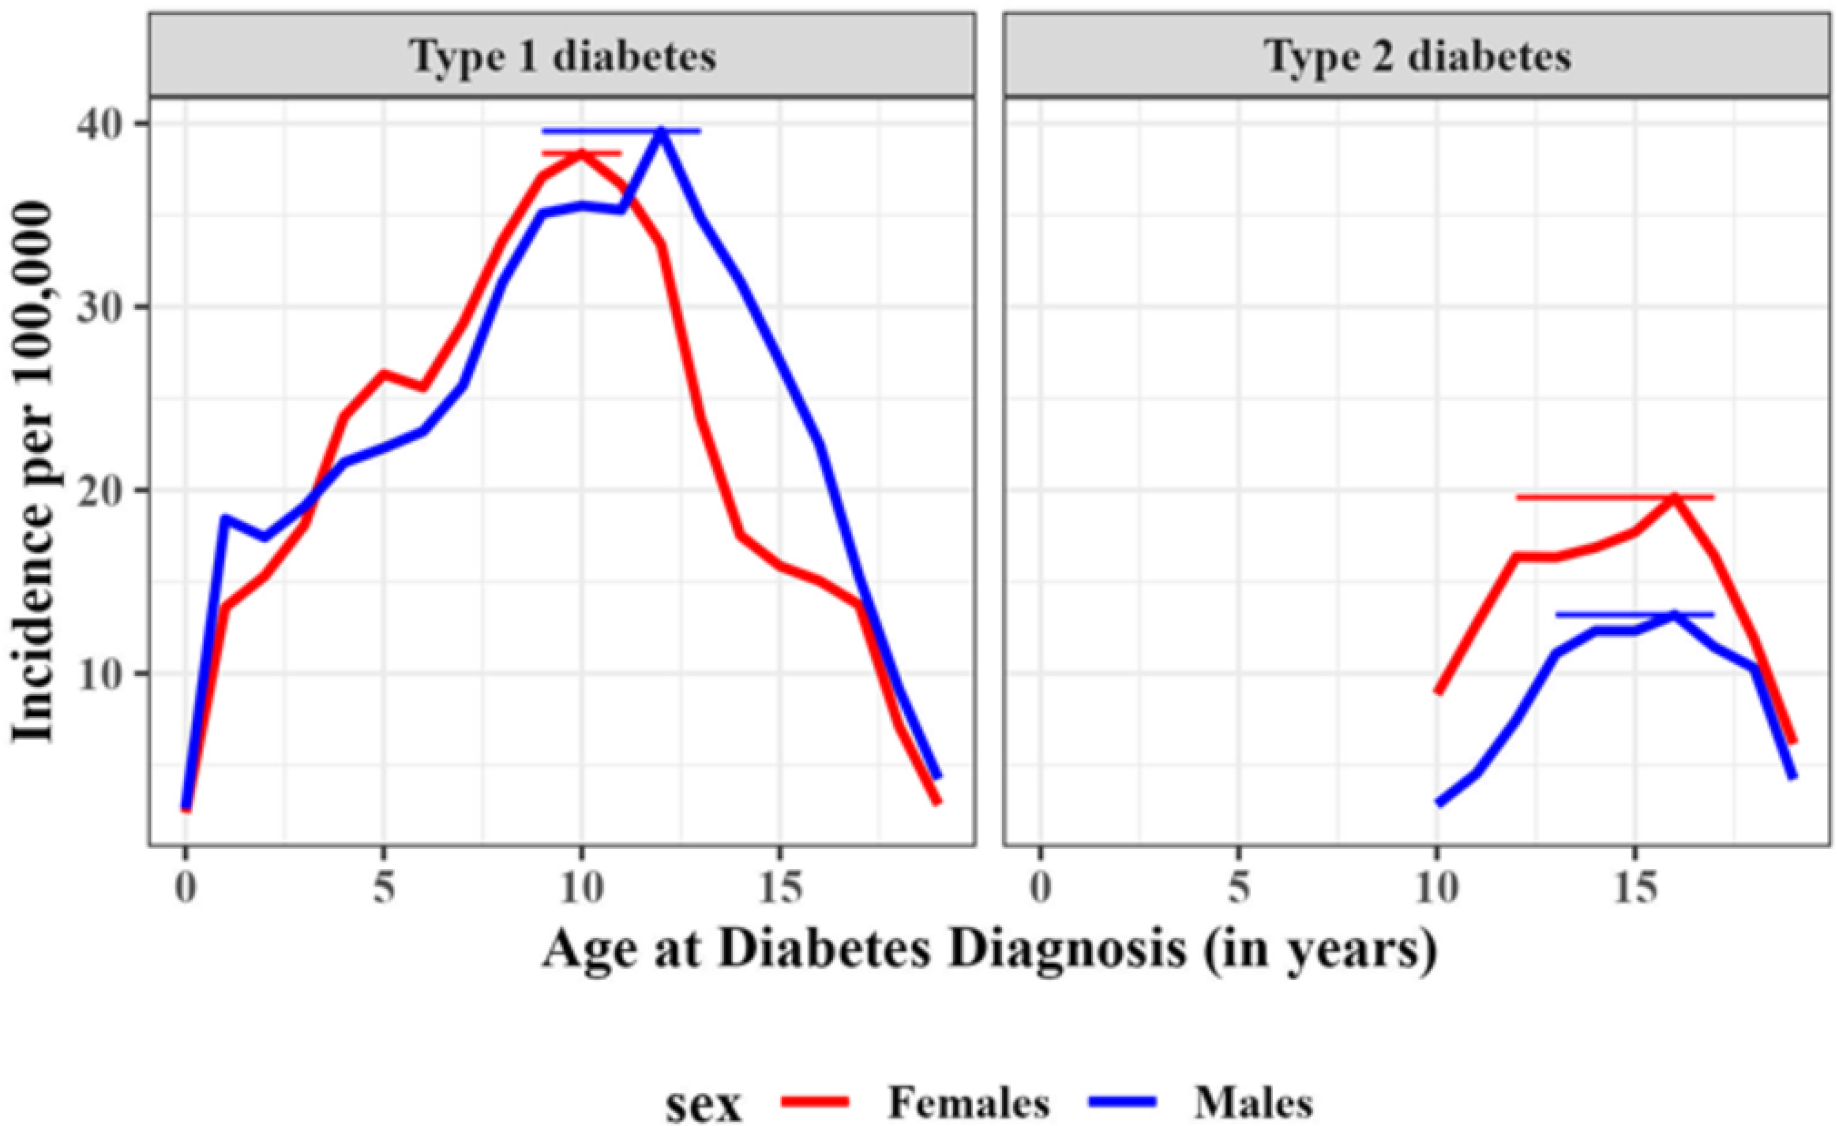
Vertical bars represent 95% confidence intervals of the peak age of diagnosis.
The statistical test for seasonality was significant for both T1D (p=0.006) and T2D (p=0.0005) indicating that there was a repeating yearly pattern of diagnoses over the 17 year period. For T1D, the visual inspection of the polar seasonal plots shows a peak of diagnosis in January and a dearth of diagnoses in June (Figure 3). (Two periods are shown to demonstrate the consistency). Smaller sample sizes by study site led to more variability in these patterns (Appendix Figure 2), although the January and June inflections were still apparent. For T2D, the visual inspection of the polar seasonal plots shows a peak of diagnosis in August which was consistent in both periods (Figure 3). Site-specific data show considerable variability owing to smaller sample sizes of T2D and further stratification by site (Appendix Figure 2).
Figure 3. Distribution of type 1 (left) and type 2 (right) diabetes by month of diagnosis and time period.
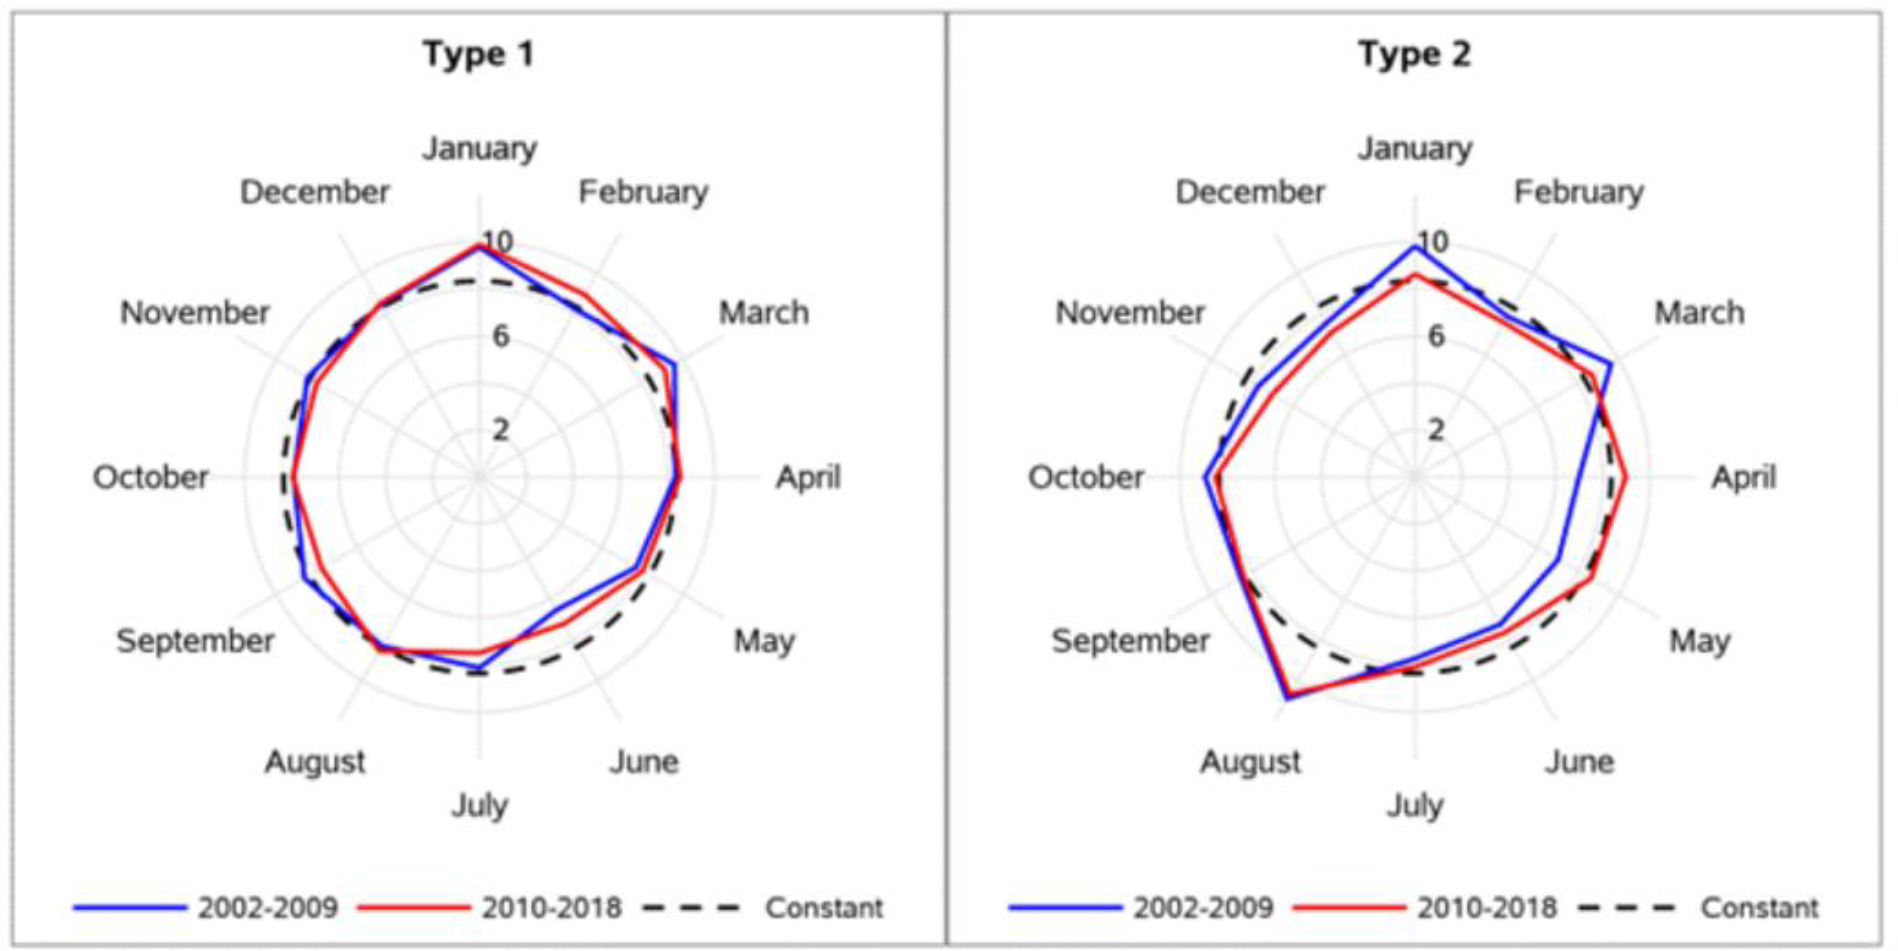
Numbers represent the percentage of cases diagnosed in that month. The values 2%, 6% and 10% are shown as the axis labels. The constant line is drawn with a dashed line at 8.3% (or 1/12th of annual cases).
Examination of case presentation by month indicates a common pattern in August that favors routine health visits or community screening with a concomitant modest reduction in cases presenting with symptoms. For T1D, this pattern of increased routine health visits or community screening was most common in August (7%), and for T2D, this presentation pattern was most common in December (42%) and August (41%) (Appendix Table 8).
DISCUSSION
The incidence of T1D and T2D in youth continues to rise in the US. Over the 17 years of the SEARCH study, the incidence of T1D increased annually by 2·02% among 0–19 year-olds, and T2D increased annually by 5·31% among 10–19 year-olds. For both T1D and T2D, the rates of increase were generally higher among racial and ethnic minority youth than those among the non-Hispanic White youth. Specifically, annual percent increases for T1D and T2D were highest for Asian/Pacific Islander, Hispanic, and non-Hispanic Black youth. These findings extend our previous reports, confirming a continuing rise in the incidence4,5 of both T1D and T2D in youth, and giving evidence for a rise in prevalence.12
These findings are consistent with those from Europe and other regions of the world that show a rise in incidence in youth with T1D over the past two to three decades.13,14 Data from other countries (and the US) on the change in the incidence of T2D are limited to a few small studies15–17 yet show a rise in the incidence of T2D, with China, India, and the US showing the highest absolute incidence rates of T2D.18 An analysis of EURODIAB registry data from over 84,000 children with T1D in 22 countries conducted for the period 1989–2013 concluded that T1D has increased by 3% per year, with a possible slowing of this increase between 2004–2008.14 Importantly, the present SEARCH results of increasing incidence over the past several decades for both T1D and T2D agree with the findings of other studies around the globe.
However, the rise in incidence of youth-onset diabetes is in sharp contrast to a declining (or stable) incidence of diabetes in adults. In the US, the National Health Interview Survey documented a decrease in incidence of diagnosed diabetes in adults of 3·1% (annual percent change) between 2007 and 2017.19 This report, using cross-sectional survey data, followed a period of nearly two decades of increasing incidence. The decline was driven predominantly by a decrease in incidence among non-Hispanic White individuals. Incidence rates in racial and ethnic minority groups were stable during this period. Additionally, a recent report from a multicountry analysis with 5 billion person-years of follow-up of adults over the previous decade shows stabilizing or declining incidence of diabetes.20 Further exploration of the deviating trends in incidence in youth (rising) and adults (declining or stable) is needed.
There are several possible explanations for the rise in T2D incidence. First, the incidence is rising in parallel with increasing rates of obesity in youth, a known risk factor for T2D. Between 1999 and 2016, in youth aged 2–19 years, the prevalence of obesity increased from 13.9% to 18.5% in the US, with the highest rates among non-Hispanic black and Hispanic youth.21 Alternatively, some of the rise may be artifactual, reflecting either increases in screening for T2D in at-risk youth or a more accurate diagnosis of T2D. Our data suggest that the mode of presentation for T2D has changed over time, with a growing proportion of cases identified by routine health visits with a corresponding decline in presentation with symptoms. This may lead to an earlier diagnosis of T2D, which may have a (short-term) impact on incidence rates. Additionally, previous analyses from SEARCH5 shows that there has been an improvement over time in the accuracy of diagnosis of T2D. The proportion of T2D cases that meet a gold standard criterion (insulin resistance in the absence of diabetes autoantibodies) rose from 73% in 2002 to 84% in 2016 (p=0.05). Together, these observations are unlikely to fully explain the increasing incidence of T2D.
We make several observations about the age at which diagnosis peaks among youth. Regarding T1D, our work is consistent with the known peak occurring between ages 10 and 14. However, to our knowledge, no reports have narrowed the peak age to a single year. We found that the peak occurred at age 10 overall, with the peak occurring earlier in girls (10 years) than in boys (12 years) and somewhat earlier in Hispanic and Asian Pacific Islander youth (9 years) than in other race/ethnic groups (10–11 years). And, despite an increasing incidence, peak age had not shifted over time.
Regarding T2D, our data are among the first to identify a peak age at diagnosis of youth-onset T2D. First, across sex, race, and ethnicity, peak age was 16 years, except for non-Hispanic Black youth for which peak age occurred at 13 years, and possibly earlier among non-Hispanic Black girls than boys. This pattern coincides with the timing of menarche, which occurs earlier in non-Hispanic Black girls and Hispanic girls than in non-Hispanic White girls, an observation that is partially attributable to disparities in socioeconomic status.22 A second observation is a steep rise between ages 10 to 13 with a peak at age 16 years, followed by a steep decline through age 19 years. The rise appears to initiate at age 9; we observed a large number of cases at that age from among the few youth diagnosed before age 10, but not included in this study. Our capture-recapture analysis shows modest under-ascertainment among those aged 18 and 19, although not enough to fully explain the drop in incidence after its peak. Another possible explanation for the steep decline after age 16 is reduced contact with the health system and reduced screening opportunities. If real, the shape of the distribution may suggest a relatively narrow period of susceptibility in youth, which returns to a lower-risk period until rising again in middle age, between ages 45 and 64 years.23 These observations have important implications for identifying a period ripe for intervention to reduce the risk of T2D in youth. Finally, peak age has not shifted over time, despite an increasing incidence of diabetes.
Seasonal variation in the onset of T1D is well established, with most studies observing a peak in the winter.24 This pattern is observed in the SEARCH data, with a peak in January. Possible explanations for seasonality include fluctuation in hours of sunlight and thus vitamin D levels25 and viral infections.26 We were unable to examine these potential etiologies in SEARCH. Seasonal variation in the onset of T2D in youth has not been previously examined due to the limited youth-onset T2D incidence data. A significant seasonal pattern was observed (p=0.0005). Visually, this pattern is most apparent with an increase in diagnoses occurring in August. A possible explanation for an August peak is an increase in physical exams for school athletic programs, at which time asymptomatic hyperglycemia may be detected. Our data show that the month of August had the highest (T1D) or second highest (T2D) proportion of cases presenting at routine health visits rather than with symptoms, providing some evidence in support of this hypothesis. In conclusion, seasonal patterns were observed for both types of diabetes although seasonality in diagnosis of T2D may indicate a pattern of increased health care contact rather than periods of exposure to viral or environmental triggers as for T1D.
Strengths of the SEARCH study include a rigorous approach to identifying all incident cases of diabetes in youth with a high completeness rate over a 17-year period. This is particularly unique for T2D in youth, for which no other surveillance studies have been conducted in the US. SEARCH is also the only US-based registry of both T1D and T2D in youth with representation of all major racial and ethnic groups. Peak age at diagnosis and seasonality of diagnosis are both relatively well-known for T1D in youth, but, to our knowledge, SEARCH is the only incidence study that can examine peak age and season at diagnosis for T2D. Limitations include a modestly lower ascertainment rate for ages 18 and 19, which only partially explains the drop in incidence rate following peak incidence; and, the use of a descriptive statistical approach to identify the age at which the maximum incidence rate is observed. A more formal analytic approach would be to derive the probability distribution of the maximum incidence as a function of age.27,28 However, this is a more methodologic approach and out of scope for this paper.
The SEARCH study29 has been a national resource to explore the epidemiology of youth-onset diabetes in the US and the consequences of these chronic conditions. Our data show a rising incidence of diabetes in youth in the US. Peak age of diagnosis occurs at 10 years for T1D and 16 years for T2D. Seasonal patterns were observed for both types of diabetes. These data document an expanding population of young adults at risk for developing early complications of diabetes2, which appear to be more devastating when diabetes develops at a young age.30
Supplementary Material
Research in context.
Evidence before this study
SEARCH for Diabetes in Youth is one of many studies from around the world reporting trends in incidence of type 1 diabetes (T1D) in youth; there are fewer reports on trends in incidence of type 2 diabetes (T2D) in youth. We reviewed the summary of studies of incidence and trends in youth-onset T1D and T2D in the IDF Diabetes Atlas 10th Edition (2022) which confirmed that there are many well-established studies of T1D incidence while there is only a modest number of incidence studies of youth-onset T2D with very limited data on trends for T2D. Similarly, the peak age and season of diagnosis are well known for youth-onset T1D but data are very limited for youth-onset T2D and age at diagnosis appears limited to age categories (e.g., 0–4, 5–9, 10–14, 15–19 years) rather than single year of age. We searched PubMed on August 1, 2022 using the search terms “diabetes”, “child” or “youth”, and “season”, without any language or publication date restrictions, and found many reports of season of diagnosis in youth with T1D but no reports for youth-onset T2D.
Added value of this study
This study extends SEARCH population-based surveillance data on T1D and T2D incidence in US youth to cover the 17-year period from 2002 – 2018. This study also presents data on peak age (single year) and season (month) of diagnosis of diabetes, neither of which have been reported for youth with T2D.
Implications of all the available evidence
The increasing incidence of T1D and T2D in US youth will result in a growing population of young adults at risk for early complications of diabetes with implications for their own future health and that of future offspring. Persons from racial and ethnic minority groups and select age groups are at increased risk for the development of diabetes and there are specific seasons (months) when the development (or diagnosis) of T1D and T2D is more likely. All of these findings have implications for focused prevention efforts.
Acknowledgements
The SEARCH for Diabetes in Youth Study is indebted to the many youth and their families, and their health care providers, whose participation made this study possible. We also acknowledge the contributions of Dr. David Pettitt and Ms. Leora Henkin. The findings and conclusions in this report are those of the authors and do not necessarily represent the official position of the Centers for Disease Control and Prevention and the National Institute of Diabetes and Digestive and Kidney Diseases. The authors were not precluded from accessing data in the study, and they accept responsibility to submit for publication.
Funding source and role
The Population Based Registry of Diabetes in Youth Study (1U18DP006131, U18DP006133, U18DP006134, U18DP006136, U18DP006138, and U18DP006139) is funded by the Centers for Disease Control and Prevention and supported by the National Institute of Diabetes and Digestive and Kidney Diseases, National Institutes of Health.
The project scientist from the Centers for Disease Control and Prevention (GI) was involved in the design and conduct of the study, the interpretation of the data, the review and approval of the manuscript, and the decision to submit and where to submit the manuscript for publication. The project scientist from the National Institute of Diabetes and Digestive and Kidney Diseases was not involved with this manuscript. JML was a principal investigator for the SEARCH study site in California through the end of the funding period before joining the National Institute of Diabetes and Digestive and Kidney Diseases. The manuscript was submitted for clearance by the Centers for Disease Control and Prevention and the National Institute of Diabetes and Digestive and Kidney Diseases prior to submission to Lancet Diabetes & Endocrinology, which is required for all manuscripts with authors from these agencies.
SEARCH STUDY GROUP LIST
(Listed within each site/center: PI(s) & then alphabetically within each institution/facility.)
The writing group for this manuscript wishes to acknowledge the contributions of the following individuals to the SEARCH for Diabetes in Youth Study:
SEARCH STUDY SITES
California: (PI) Jean M. Lawrence, ScD, MPH, MSSA*
Peggy Hung, MPH; Corinna Koebnick, PhD, MSc; Xia Li, MS; Eva Lustigova, MPH; Kristi Reynolds, PhD, MPH for the Department of Research & Evaluation, Kaiser Permanente Southern California, Pasadena California, and David J. Pettitt, MD, Santa Barbara, California.
*Dr. Lawrence is now with the National Institute of Diabetes and Digestive and Kidney Diseases.
Carolinas: (PI) Elizabeth J. Mayer-Davis, PhD
Amy Mottl, MD, MPH; Joan Thomas MS, RD for the University of North Carolina, Chapel Hill.
Malaka Jackson, MD; Lisa Knight, MD; Angela D. Liese, PhD, MPH; Christine Turley, MD for the University of South Carolina.
Deborah Bowlby, MD for the Medical University of South Carolina.
James Amrhein, MD; Elaine Apperson, MD; Bryce Nelson, MD for Greenville Health System and Eau Claire Cooperative Health Center.
Colorado: (PI) Dana Dabelea, MD, PhD
Anna Bellatorre, PhD; Tessa Crume, PhD, MSPH; Richard F. Hamman, MD, DrPH; Katherine A. Sauder, PhD; Allison Shapiro, PhD, MPH; Lisa Testaverde, MS for the LEAD Center in the Department of Epidemiology, Colorado School of Public Health, University of Colorado Denver.
Georgeanna J. Klingensmith, MD; David Maahs, MD; Marian J. Rewers, MD, PhD; Paul Wadwa, MD for the Barbara Davis Center for Childhood Diabetes.
Stephen Daniels, MD, PhD; Michael G. Kahn, MD, PhD; Greta Wilkening, PsyD for the Department of Pediatrics and Children’s Hospital.
Clifford A. Bloch, MD for the Pediatric Endocrine Associates.
Jeffrey Powell, MD, MPH for the Shiprock Service Unit, Navajo Area Indian Health Service.
Kathy Love-Osborne, MD for the Denver Health and Hospital Authority.
Diana C. Hu, MD for the Pediatrics Department, Tuba City Regional Health Care Center, Tuba City, AZ.
Ohio: (PI) Lawrence M. Dolan, MD
Amy S. Shah, MD, MS; Debra A. Standiford, MSN, CNP; Elaine M. Urbina, MD, MS for the Cincinnati Children’s Hospital Medical Center, Department of Pediatrics, University of Cincinnati.
Washington: (PI) Catherine Pihoker, MD
Irl Hirsch, MD; Grace Kim, MD; Faisal Malik, MD, MSHS; Lina Merjaneh, MD; Alissa Roberts, MD; Craig Taplin, MD; Joyce Yi-Frazier, PhD for the University of Washington.
Natalie Beauregard, BA; Cordelia Franklin, BS; Carlo Gangan, BA; Sue Kearns, RN; Mary Klingsheim, RN; Beth Loots, MPH, MSW; Michael Pascual, BA for Seattle Children’s Hospital.
Carla Greenbaum, MD for Benaroya Research Institute.
FUNDING AGENCIES, COORDINATING CENTER and LABORATORY
Centers for Disease Control and Prevention: Giuseppina Imperatore, MD, PhD, Sharon H. Saydah, PhD
National Institute of Diabetes and Digestive and Kidney Diseases, NIH: Barbara Linder, MD, PhD
Central Laboratory: (PI) Santica M. Marcovina, PhD, ScD (PI)
Alan Chait, MD; Noemie Clouet-Foraison, PhD; Jessica Harting; Greg Strylewicz, PhD for the University of Washington Northwest Lipid Metabolism and Diabetes Research Laboratories.
Coordinating Center: (Co-PIs) Ralph D’Agostino, Jr., PhD, Elizabeth T. Jensen, MPH, PhD; Lynne E. Wagenknecht, DrPH;
Ronny A. Bell, PhD; Ramon Casanova, PhD; Jasmin Divers, PhD; Maureen T. Goldstein, BA; Leora Henkin, MPH, M.Ed; Scott Isom, MS; Kristin Lenoir, MPH; June Pierce, AB; Beth Reboussin, PhD; Joseph Rigdon, PhD; Andrew Michael South, MD, MS; Jeanette Stafford, MS; Cynthia Suerken, MS; Brian Wells, MD, PhD; Carrie Williams, MA, CCRP for Wake Forest University School of Medicine.
Footnotes
Declaration of Interest
We declare no competing interests.
Meeting Presentation
A subset of these data were presented at the American Diabetes Association’s 82th Scientific Sessions, June 3–7, 2022.
Publisher's Disclaimer: This is a PDF file of an unedited manuscript that has been accepted for publication. As a service to our customers we are providing this early version of the manuscript. The manuscript will undergo copyediting, typesetting, and review of the resulting proof before it is published in its final form. Please note that during the production process errors may be discovered which could affect the content, and all legal disclaimers that apply to the journal pertain.
Data Sharing Statement
Will individual participant data be available (including data dictionaries)? Yes. What data in particular will be shared? Case counts, number at risk, geographic region, age, race, ethnicity, sex, diabetes type, month and year of diagnosis. What other documents will be available? Study protocol. When will data be available (start and end dates)? Immediately following publication and ending 3 years following publication date. With whom? Investigators whose proposed use of the data has been approved by an independent review committee. For what types of analyses? To achieve the aims approved by the review committee and consistent with the purpose of the SEARCH aims. By what mechanism will data be made available? Proposals should be directed to any of the SEARCH site investigators (D. Dabelea, A. Liese, C. Pihoker, K. Reynolds, A. Shah); to gain access, data requesters will need to sign a data use agreement.
References
- 1.Zylke JW, DeAngelis CD. Pediatric chronic diseases—stealing childhood. JAMA 2007;297:2765–6. [DOI] [PubMed] [Google Scholar]
- 2.Dabelea D, Stafford JM, Mayer-Davis EJ, et al. ; SEARCH for Diabetes in Youth Research Group. Association of type 1 diabetes vs type 2 diabetes diagnosed during childhood and adolescence with complications during teenage years and young adulthood. JAMA 2017;317:825–35. [DOI] [PMC free article] [PubMed] [Google Scholar]
- 3.Lawrence JM, Reynolds K, Saydah SH, et al. Demographic Correlates of Short-Term Mortality Among Youth and Young Adults With Youth-Onset Diabetes Diagnosed From 2002 to 2015: The SEARCH for Diabetes in Youth Study. Diab Care 2021;44:2691–8. [DOI] [PMC free article] [PubMed] [Google Scholar]
- 4.Mayer-Davis EJ, Lawrence JM, Dabelea D, et al. , for the SEARCH for Diabetes in Youth Study. Incidence Trends of Type 1 and Type 2 Diabetes among Youths, 2002–2012. N Engl J Med 2017;376:1419–29. [DOI] [PMC free article] [PubMed] [Google Scholar]
- 5.Divers J, Mayer-Davis EJ, Lawrence JM, et al. Trends in Incidence of Type 1 and Type 2 Diabetes Among Youths - Selected Counties and Indian Reservations, United States, 2002–2015. MMWR Morb Mortal Wkly Rep 2020;69:161–5. [DOI] [PMC free article] [PubMed] [Google Scholar]
- 6.Dabelea D, Mayer-Davis EJ, Saydah S, et al. ; SEARCH for Diabetes in Youth Study. Prevalence of type 1 and type 2 diabetes among children and adolescents from 2001 to 2009. JAMA 2014;311:1778–86. [DOI] [PMC free article] [PubMed] [Google Scholar]
- 7.National Center for Health Statistics. Bridged-Race Population Estimates – Data Files and Documentation. Vintage 2020 Bridged-Race Postcensal Population Estimates. https://www.cdc.gov/nchs/nvss/bridged_race/data_documentation.htm. Accessed 6/3/2022.
- 8.Benjamin MA, Rigby RA, Stasinopoulos DM. Generalized autoregressive moving average models. JASA 2003;98, 214–223. [Google Scholar]
- 9.Verlato G, Muggeo M. Capture-recapture method in the epidemiology of type 2 diabetes: a contribution from the Verona Diabetes Study. Diab Care 2000;23:759–64. [DOI] [PubMed] [Google Scholar]
- 10.Saydah SH, Imperatore G, Henkin L, et al. Trends and characteristics of self-reported case presentation of diabetes diagnosis among youth from 2002 to 2010: findings from the SEARCH for diabetes in youth study. Diab Care 2015;38:e84–5. [DOI] [PMC free article] [PubMed] [Google Scholar]
- 11.Liboschik T, Fokianos K, Fried R. tscount: An R package for analysis of count time series following generalized linear models. J Stat Softw 2017;82, 1–51, doi: 10.18637/jss.v082.i05. [DOI] [Google Scholar]
- 12.Lawrence JM, Divers J, Isom S, et al. SEARCH for Diabetes in Youth Study Group. Trends in Prevalence of Type 1 and Type 2 Diabetes in Children and Adolescents in the US, 2001–2017. JAMA 2021;326:717–27. [DOI] [PMC free article] [PubMed] [Google Scholar]
- 13.Tuomilehto J, Ogle GD, Lund-Blix N, Stene LC. Epidemiology of childhood type 1 diabetes. Pediatr Endocrinol Rev 2020;17(Suppl 1):198–209. [DOI] [PubMed] [Google Scholar]
- 14.Patterson CC, Harjutsalo V, Rosenbauer J, et al. Trends and cyclical variation in the incidence of childhood type 1 diabetes in 26 European centres in the 25 year period 1989–2013: a multicentre prospective registration study. Diabetologia 2019;62:408–17. [DOI] [PubMed] [Google Scholar]
- 15.Haynes A, Kalic R, Cooper M, Hewitt JK, Davis EA. Increasing incidence of type 2 diabetes in indigenous and non-indigenous children in Western Australia, 1990–2012. Med J Aust 2016;204:303. 10.5694/mja15.00958 [DOI] [PubMed] [Google Scholar]
- 16.Candler TP, Mahmoud O, Lynn RM, Majbar AA, Barrett TG, Shield JPH. Continuing rise of Type 2 diabetes incidence in children and young people in the UK. Diabet Med 2018; 35:737–44. [DOI] [PMC free article] [PubMed] [Google Scholar]
- 17.Pavkov ME, Hanson RL, Knowler WC, Bennett PH, Krakoff J, Nelson RG. Changing patterns of type 2 diabetes incidence among Pima Indians. Diab Care 2007;30:1758–63. [DOI] [PubMed] [Google Scholar]
- 18.Wu H, Patterson CC, Zhang X, et al. Worldwide estimates of incidence of type 2 diabetes in children and adolescents in 2021. Diabetes Res Clin Pract 2022;185:109785. doi: 10.1016/j.diabres.2022.109785 [DOI] [PubMed] [Google Scholar]
- 19.Benoit SR, Hora I, Albright AL, Gregg EW. New directions in incidence and prevalence of diagnosed diabetes in the USA. BMJ Open Diabetes Research and Care 2019;7:e000657. doi: 10.1136/bmjdrc-2019-000657 [DOI] [PMC free article] [PubMed] [Google Scholar]
- 20.Magliano DJ, Chen L, Islam RM, et al. Trends in the incidence of diagnosed diabetes: a multicountry analysis of aggregate data from 22 million diagnoses in high-income and middle-income settings. Lancet Diabetes Endocrinol 2021;9:203–11. [DOI] [PMC free article] [PubMed] [Google Scholar]
- 21.Hales CM, Carroll MD, Fryar CD, et al. Prevalence of obesity among adults and youth: United States, 2015–2016. NCHS Data Brief 2017;288:1–8 [PubMed] [Google Scholar]
- 22.Deardorff J, Abrams B, Ekwaru JP, Rehkopf DH. Socioeconomic status and age at menarche: an examination of multiple indicators in an ethnically diverse cohort. Ann Epidemiol 2014;24:727–33. [DOI] [PMC free article] [PubMed] [Google Scholar]
- 23.Nichols GA, Schroeder EB, Karter AJ, et al. Trends in diabetes incidence among 7 million insured adults, 2006–2011: the SUPREME-DM project. Am J Epidemiol 2015;181:32–9. [DOI] [PMC free article] [PubMed] [Google Scholar]
- 24.Patterson CC, Gyürüs E, Rosenbauer J, et al. Seasonal variation in month of diagnosis in children with type 1 diabetes registered in 23 European centers during 1989–2008: little short-term influence of sunshine hours or average temperature. Pediatr Diabetes 2015;16:573–80. [DOI] [PubMed] [Google Scholar]
- 25.Harvey JN, Hibbs R, Maguire MJ, O’Connell H, Gregory JW; Brecon Group (The Wales Paediatric Diabetes Interest Group). The changing incidence of childhood-onset type 1 diabetes in Wales: Effect of gender and season at diagnosis and birth. Diabetes Res Clin Pract 2021;175:108739. doi: 10.1016/j.diabres.2021.108739. [DOI] [PubMed] [Google Scholar]
- 26.Tauriainen S, Salminen K, Hyöty H. Can enteroviruses cause type 1 diabetes? Ann NY Acad Sci 2003;1005:13–22. [DOI] [PubMed] [Google Scholar]
- 27.Anderson CW. Local limit theorems for the maxima of discrete random variables. Math Proc Camb Philos Soc 1980;88:161–5. [Google Scholar]
- 28.McCormick W, Park Y. Asymptotic analysis of extremes from autoregressive negative binomial processes. J Appl Probab 1992;29:904–20. [Google Scholar]
- 29.Hamman RF, Bell RA, Dabelea D, et al. The SEARCH for Diabetes in Youth study: rationale, findings, and future directions. Diab Care 2014;37:3336–44. [DOI] [PMC free article] [PubMed] [Google Scholar]
- 30.Al-Saeed AH, Constantino MI, Molyneaux L, et al. An inverse relationship between age of type 2 diabetes onset and complication risk and mortality: the impact of youth-onset type 2 diabetes. Diab Care 2016;39:823–9. [DOI] [PubMed] [Google Scholar]
Associated Data
This section collects any data citations, data availability statements, or supplementary materials included in this article.
Supplementary Materials
Data Availability Statement
Will individual participant data be available (including data dictionaries)? Yes. What data in particular will be shared? Case counts, number at risk, geographic region, age, race, ethnicity, sex, diabetes type, month and year of diagnosis. What other documents will be available? Study protocol. When will data be available (start and end dates)? Immediately following publication and ending 3 years following publication date. With whom? Investigators whose proposed use of the data has been approved by an independent review committee. For what types of analyses? To achieve the aims approved by the review committee and consistent with the purpose of the SEARCH aims. By what mechanism will data be made available? Proposals should be directed to any of the SEARCH site investigators (D. Dabelea, A. Liese, C. Pihoker, K. Reynolds, A. Shah); to gain access, data requesters will need to sign a data use agreement.