

Abstract
Extreme climatic events, such as heat waves, cold snaps and drought spells, related to global climate change, have become more frequent and intense in recent years. Acclimation of plant physiological processes to changes in environmental conditions is a key component of plant adaptation to climate change. We assessed the temperature response of leaf photosynthetic parameters in wheat grown under contrasting water regimes and growth temperatures (T growth). Two independent experiments were conducted under controlled conditions. In Experiment 1, two wheat genotypes were subjected to well‐watered or drought‐stressed treatments; in Experiment 2, the two water regimes combined with high, medium and low T growth were imposed on one genotype. Parameters of a biochemical C3‐photosynthesis model were estimated at six leaf temperatures for each factor combination. Photosynthesis acclimated more to drought than to T growth. Drought affected photosynthesis by lowering its optimum temperature (T opt) and the values at T opt of light‐saturated net photosynthesis, stomatal conductance, mesophyll conductance, the maximum rate of electron transport (J max) and the maximum rate of carboxylation by Rubisco (V cmax). T opt for V cmax was up to 40°C under well‐watered conditions but 24–34°C under drought. The decrease in photosynthesis under drought varied among T growth but was similar between genotypes. The temperature response of photosynthetic quantum yield under drought was partly attributed to photorespiration but more to alternative electron transport. All these changes in biochemical parameters could not be fully explained by the changed leaf nitrogen content. Further model analysis showed that both diffusional and biochemical parameters of photosynthesis and their thermal sensitivity acclimate little to T growth, but acclimate considerably to drought and the combination of drought and T growth. The commonly used modelling approaches, which typically consider the response of diffusional parameters, but ignore acclimation responses of biochemical parameters to drought and T growth, strongly overestimate leaf photosynthesis under variable temperature and drought.
Keywords: acclimation, climate change, drought stress, growth temperature, photosynthesis modelling, temperature response, winter wheat
Our study investigated how photosynthesis and its components acclimate to drought stress (DS) and growth temperature (T growth) in wheat, and examined to what extent ignoring these acclimations would lead to errors in predicting photosynthesis. We found that both diffusional and biochemical parameters of photosynthesis and their thermal sensitivity acclimate little to T growth, but considerably to DS and the combination of DS and T growth. The common modelling approaches, which typically consider the response of diffusional parameters, but ignore acclimation responses of biochemical parameters to drought and T growth, strongly overestimate leaf photosynthesis under variable temperature and drought.
1. INTRODUCTION
Extreme climatic events, such as heat waves and drought spells, related to global climate change have become more frequent and intense in recent years (IPCC, 2021; Lloret et al., 2012; Perkins‐Kirkpatrick & Lewis, 2020; Solomon et al., 2009). Numerous studies have documented that the impacts of these extreme events are hard to quantify, leading to uncertainties in predicting future gross primary productivity (GPP) and carbon budgets of (agro)ecosystems as well as in assessment of future global food security (Asseng et al., 2015; Lobell & Gourdji, 2012; Peng et al., 2020; Piao et al., 2013; Yin & Struik, 2017). Photosynthesis is the major physiological process that determines GPP of ecosystems and productivity of crops. Scaling up photosynthesis from leaf to canopy and eventually to the GPP of (agro)ecosystems over the whole season requires the quantitative information on how photosynthesis responds to short‐term fluctuations, and acclimates to prolonged changes, in environmental variables including extreme events.
The biochemical photosynthesis model of Farquhar, von Caemmerer, and Berry (1980; ‘the FvCB model’ hereafter) is widely used in quantifying leaf net photosynthesis (A) in response to short‐term environmental cues. This model has parameters characterizing various photosynthetic biochemical components, that is, the maximum rate of electron transport (J max) or the maximum rate of carboxylation by Rubisco (V cmax). An extension by Sharkey (1985) adds a third biochemical limitation, the rate of triose phosphate utilization (T p). This model requires the CO2 partial pressure at the carboxylation sites (C c) as input. Thus, conductance for the CO2 diffusion towards the substomatal cavity (stomatal conductance, g s) and from the intercellular airspace in leaves to the sites of carboxylation in chloroplasts (mesophyll conductance, g m) can be coupled with the FvCB model, allowing A to be predicted as a function of the CO2 level in the intercellular airspaces (C i) or in the atmospheric air (C a). Leaf photosynthesis is sensitive to short‐term fluctuations in leaf temperature (T leaf): typically, A increases with increasing T leaf up to an optimum temperature (T opt), beyond which A declines with further increases in T leaf (Way & Yamori, 2014; Yamori et al., 2014). This response can be well modelled via temperature responses of photosynthesis parameters (J max, V cmax, T p, g s and g m), typically described using activation energy in the Arrhenius equation (Bernacchi et al., 2009; Rogers et al., 2020).
When plants are exposed to prolonged changes in growth environment [e.g. changes in growth temperatures (T growth) and water regimes], the photosynthetic parameters and their underlying structural, physiological and biochemical processes adjust to these conditions, thereby leading to photosynthetic acclimation (Smith & Dukes, 2013). How leaf photosynthesis adjusts to prolonged changes in T growth and how such adjustments are manifested as alterations in the response function of a photosynthetic parameter have long been investigated across species (Dusenge et al., 2021; Yamasaki et al., 2002; Yamori et al., 2005). Previous studies reported that while little effect of T growth on V cmax and J max at standard T leaf (25°C; J max25 and V cmax25) was observed, photosynthetic acclimation to lower T growth typically results in general downward shifts in T opt of light‐saturated net photosynthesis (A sat), J max and V cmax (Kattge & Knorr, 2007; Kumarathunge et al., 2019), as well as in the activation energies of J max (E Jmax) and of V cmax (E Vcmax) (Dusenge et al., 2020; Yin et al., 2019). Likewise, acclimation to higher T growth typically leads to upward shifts in T opt of these parameters. Similar to those for photosynthetic acclimation to elevated CO2 (Harley et al., 1992; Yin, 2013), mechanisms underlying the acclimation to T growth are possibly linked to leaf N status, as evidence showed that high T growth decreased leaf N, thereby declining photosynthesis capacity (Cai et al., 2020; Crous et al., 2018; Yin et al., 2019). Besides, changes in pigment content and thylakoid membrane may play roles in the acclimation to T growth (Dusenge et al., 2020; von Caemmerer et al., 2009).
Soil water availability also influences leaf photosynthesis. Under drought stress, the decreased photosynthesis could be attributed to lower CO2 availability induced by stomatal closure (Wei et al., 2020). Kumarathunge et al. (2020) reported that although g s was significantly lower under water shortage conditions, V cmax25 was unaffected, in line with the report of Galmés et al. (2013) of little changes in any of the Rubisco‐related parameters under mild to moderate drought. However, photosynthesis under severe water stress can be inhibited by nonstomatal limitations. For instance, drought may induce the occurrence of alternative electron transport (Zivcak et al., 2013), which decreases the proportion of linear electron transport and thus photosynthesis (Yin et al., 2016). Drought stress also impaired ATP synthesis and thus ATP‐limited regeneration of RuBP, which in turn decreased Rubisco activity leading to photoinhibition (Flexas & Medrano, 2002). A recent study for wheat showed that drought stress alone did not lead to a decline in Rubisco activation state, whereas the combination of drought and high temperature stress did (Perdomo et al., 2017). Salvucci and Crafts‐Brandner (2004) suggested a predominant Rubisco limitation with increasing temperature since high temperature decreases Rubisco's affinity to CO2 relative to O2, leading to high photorespiration.
Only accounting for short‐term temperature response may not suffice as omitting photosynthetic acclimation to growth environments may overestimate carbon exchange and thus productivity (Smith et al., 2016). There have been many studies on the acclimation responses of photosynthetic parameters to T growth (e.g. Dusenge et al., 2021; Yamasaki et al., 2002), and thermal acclimation parameterizations were developed and have been incorporated in Earth system models (Huang et al., 2019; Kattge & Knorr, 2007; Kumarathunge et al., 2019; Mercado et al., 2018; Smith et al., 2016); however, this was rarely done for photosynthetic acclimation to other factors and their combination with T growth, probably due to the lack of experimental data. Indeed, recent studies have explored photosynthetic acclimation to more complex environmental combinations, for example, the combination of atmospheric CO2 and T growth (Cai et al., 2018, 2020; Dusenge et al., 2020) and the combination of ozone and T growth (Dai et al., 2021). Nevertheless, little is known for how photosynthetic components acclimate to water stress and its combination with T growth, which is reflected in the assumptions made in many models that water stress only affects photosynthesis by suppressing g s but not biochemical parameters (e.g. Yin & Struik, 2017). Kumarathunge et al. (2020) reported that the temperature optima for photosynthesis became lower under water limiting conditions in seedlings of a tree species (E. tereticornis sp. Tereticornis); however, as the temperature response of biochemical parameters was not reported in their study, they concluded that the photosynthetic acclimation to water stress is mainly attributed to stomatal limitation.
To our knowledge, to date, no single study provides data for full set of leaf photosynthetic parameters and their sensitivity to T leaf in response to a combination of contrasting water regimes and T growth, for a C3 herbaceous species like wheat. In addition, the consequence of omitting photosynthetic biochemical acclimation to water deficit and T growth in modelling studies remains to be investigated. The objectives of this study are (i) to quantify the response of leaf photosynthetic parameters to T growth and drought; and (ii) to examine to what extent photosynthetic acclimation can affect the results of the FvCB leaf photosynthesis model under severe water deficit at different T growth. We hypothesize that (i) wheat has the ability to adjust its leaf photosynthetic traits to its growing environment, resulting in photosynthetic acclimation in response to drought and that the acclimation to drought depends on T growth; (ii) omitting photosynthetic acclimation to drought and its interactions with T growth in crop growth and plant vegetation models may cause significant errors in predicting leaf photosynthesis and crop yield under climate change scenarios. We conducted experiments in controlled conditions to test the above hypotheses within the context of future warmer and drier climates.
2. MATERIALS AND METHODS
To test the hypotheses above, we conducted two experiments at Unifarm of Wageningen University, the Netherlands, in 2019 and 2020. In Experiment 1 (EXP2019), two winter wheat (Triticum aestivum L.) genotypes, Thésée and Récital, were subjected to well‐watered (WW) and drought‐stressed (DS) treatments, to determine whether the effect of drought on leaf photosynthesis is genotype dependent; in Experiment 2 (EXP2020), the two water regimes combined with high, medium and low T growth were imposed on Thésée, to examine whether leaf photosynthesis and its components can be altered by contrasting water and T growth regimes. The temperature responses of leaf photosynthesis and its components for each factor combination were examined by estimating parameters of the FvCB model at six T leaf, basically following the procedure of Yin et al. (2009). Temperature response curves were described either by a modified Arrhenius equation (Medlyn et al., 2002) or by a normal distribution alike equation (June et al., 2004). We further quantified the errors created by neglecting the acclimation of both biochemical and CO2‐diffusion parameters. All symbols of model parameters are listed in the Table S1.
2.1. Experimental set‐up and treatments
Plant management practices, experimental set‐up and treatments have been detailed in our earlier study (Fang et al., 2022), therefore, only a brief description is given here.
EXP2019 was implemented in a climate‐controlled glasshouse. The two genotypes were chosen because of their clear differences in drought tolerance, and precocity, and yield components. Récital was obtained from a cross between a CIMMYT spring wheat cultivar and a French winter wheat breeding line and has higher drought tolerance than Thésée, which was obtained from a cross between a UK feed wheat cultivar and a French bread wheat cultivar. Compared with Récital, Thésée has a stronger cold requirement, a lower tillering capacity and larger grains. Plants were well‐irrigated before anthesis. At anthesis half of the plants of each genotype were subjected to a DS treatment by withholding water until the fraction of plant available water declined to ~0.2 (Figure S1c,d; measured by weighing pots daily). At this moment leaf transpiration rate of DS plants was on average ~20% of that of WW plants (Figure S2b); this drought level was maintained by adding to each pot the amount of water lost every day until the end of the measurements (Figure S1). The remaining half of the plants were maintained at 90% soil water holding capacity until the end of the experiment (treatment named WW) as control.
EXP2020 was conducted in climate chambers. When the flag leaf ligule was just visible, which corresponds to the stage of male meiosis (Barber et al., 2015), T growth treatment was applied by allocating plants to three climate chambers with three different day/night air temperature settings: high (28/24°C, daily average temperature 26.7°C; treatment HT), medium (21/17°C, daily average temperature 19.7°C; treatment MT) and low (16/12°C, daily average temperature 14.7°C; treatment LT) temperatures. The T growth settings were similar to the temperature regimes under semi‐controlled field conditions as described in Martre et al. (2003). MT is considered as the control growth temperature treatment since the T growth was similar to the outside field temperature (mean temperature 19.5°C) in Martre et al. (2003) and was the same as the T growth before the temperature treatment started. To minimize any confounding impact of varying vapor pressure deficit (VPD), VPD was set identically across chambers (0.87/0.68 kPa for day/night); as a result, 77%, 65% and 52% relative humidity were applied for HT, MT and LT treatments respectively. After anthesis, plants from each chamber were subjected to the two water treatments as in EXP2019.
In both experiments, measurements were labour‐intensive and to spread the workload over longer periods of time, four batches of seeds were sown with 10‐ to 20‐day intervals (since crop duration decreases as T growth is increased, and the length of intervals depended on T growth in EXP2020). Within each batch, we established three to five pots of plants for each treatment and the position of pots was rotated daily to avoid any confounding effect of microclimate in the glasshouse or climate chambers.
2.2. Gas exchange and chlorophyll fluorescence measurements
Gas exchange (GE) and chlorophyll fluorescence (CF) were measured simultaneously on flag leaves by using a portable photosynthetic system (Li‐Cor 6800; Li‐Cor, Inc.) equipped with an integrated fluorescence chamber head of 6 cm2. In both experiments, measurements were taken between 10 and 17 days after the onset of the drought treatment, that is, between 147 and 250°C days for LT and between 267 and 454°C days for HT (base temperature 0°C) after anthesis, which broadly corresponds to the start of effective grain filling period (Girousse et al., 2021). Measurements were taken at six T leaf ranging from 15 to 40°C with 5°C intervals, except for the LT treatments in EXP2020 for which T leaf ranged from 12 to 35°C. Leaf‐to‐air vapor pressure deficit (VPDL) in the cuvette increased when T leaf increased and was controlled at each T leaf step, ranging from 0.9 kPa at 12°C to 3.0 kPa at 40°C (Figure S2a). To achieve the desired T leaf, plants were moved to a climate cabinet with similar air temperatures during measurements.
At each T leaf, light and CO2 response curves (A–I inc and A–C i curves respectively) were assessed under photorespiratory conditions (PR, 21% O2). For each A–I inc curve, I inc (incident irradiance) was sequentially set at 2000, 1500, 1000, 500, 200, 150, 120, 90, 60 and 40 μmol photons m−2 s−1 (300–360 s per step), while keeping CO2 concentration in the measurement cuvette (C a) at 400 ppm. For each A–C i curve, C a steps were 400, 200, 100, 50, 400, 400, 400, 650, 1000 and 1500 ppm (150–180 s per step), while keeping I inc at 1000 μmol photons m−2 s−1. Prior to each measurement, leaves were first placed in the cuvette with the setting conditions until GE was stable, which took about 30 min. To properly estimate photosynthetic parameters, we also assessed A–I inc curves under non‐photorespiratory conditions (NPR, 2% O2 combined with 1000 ppm C a). To guarantee that data used for calibration were collected within the electron transport‐limited range, only the first half of A–I inc curves was measured: I inc was sequentially set at 200, 150, 120, 90, 60 and 40 μmol photons m−2 s−1 (300–360 s per step), while keeping C a at 1000 ppm. For the measurements under NPR conditions, a gas cylinder containing a mixture of 2% O2 and 98% N2 was used. Gas from the cylinder was supplied to the Li‐Cor 6800 where CO2 was blended with the gas. For each light or CO2 step during GE measurements, the operating photochemical efficiency of photosystem II (Φ 2) was determined at each I inc or C a step as (Genty et al., 1989), where F s is the steady‐state fluorescence, and is the maximum fluorescence during the saturating light pulse determined by the multi‐phase flash method (Loriaux et al., 2013). The three types of curves described above (i.e. the full set of measurements) were assessed on the same flag leaf, and the full set of measurements at each T leaf was conducted randomly during measurement period to minimize any confounding effect of leaf senescence. However, we found it difficult to conduct the full set of measurements on the same flag leaf across all T leaf, as the leaves would be damaged after frequent measurements, especially for drought treatment. Therefore, we used a new leaf when we observed visible damage.
After measurement, the portion of the flag leaves used for GE and CF measurements was cut to determine its N concentration. Rectangle area of the leaf portion was calculated as length multiplied by width which were measured by using a vernier calliper. Then the leaf material was weighed after drying in an oven at 70°C to a constant weight. The concentration of total N in leaf material on a mass basis (N mass, mg g−1) was analysed using an EA1108 CHN‐O Element Analyzer (Fisons Instruments) based on the micro‐Dumas combustion method. From these data, leaf N content on area basis (N area, g m−2) and leaf mass per area (LMA, g m−2) were calculated.
The GE and CF data of A–I inc curves with I inc ranged from 200 to 40 μmol m−2 s−1 under PR and NPR conditions of both experiments have previously been used to estimate leaf day respiration (Fang et al., 2022).
2.3. Estimation of photosynthetic parameters
Values of day respiration (R d) were taken from our previous estimates for the same experiments (Fang et al., 2022). Photosynthetic parameters of the FvCB model were estimated by using the data of A–I inc and A–C i curves at each T leaf, following the procedure described by Yin et al. (2009). The full procedure and relevant equations have been detailed in Supplementary Methods of Supporting Information. The estimated parameters included: (i) PSII electron transport efficiency under limiting light (Ф 2LL), and the related parameter for the efficiency of converting incident light into linear electron transport under limiting light (κ 2LL); (ii) J max; (iii) V cmax; (iv) T p; (v) g m. As with previous studies (e.g. Flexas et al., 2007; Ma et al., 2021; Yin et al., 2009), g m was found to be variable with light and C i levels, resembling g s. Here we only report its values for I inc = 2000 μmol m−2 s−1 and C a = 400 ppm (g mmax), together with values of g s at the same condition for showing A sat. Given that g mmax is a single‐point value, we also estimated g m by the so‐called NRH‐A method (g m(NRH‐A)), where g m is assumed to be constant (Yin & Struik, 2009), by fitting the non‐rectangular hyperbolic equation for A to a set of data points of light and CO2 response curves that are expected to be within the electron transport‐limited range. Additionally, we calculated the quantum yield of photosynthetic CO2 uptake on an absorbed light basis (Ф CO2LL) under both PR and NPR conditions, according to the procedure of Yin et al. (2014).
2.4. Temperature responses of photosynthetic parameters
The temperature responses of A sat, g m, J max and V cmax, wherever possible, were described by a modified Arrhenius equation (Medlyn et al., 2002):
| (1) |
where R is the universal gas constant (0.008314 kJ K−1 mol−1), X 25 is the value of parameters estimated at T leaf = 25°C, E X , D X and S X are the activation energy, deactivation energy and the entropy factor of relevant parameters respectively. To estimate T opt and the value of relevant parameter at T opt (X opt), the same data were fitted to the modified Arrhenius equation written in the form containing T opt (Medlyn et al., 2002; Yin, 2021):
| (2) |
Note that (i) E X and D X are common to Equations (1) and (2), and the estimates of E X or D X from the two equations are identical (Yin, 2021), and (ii) T leaf in both equations should be in K.
We described the temperature response of Ф 2LL and κ 2LL by using a normal distribution alike equation (June et al., 2004):
| (3) |
where Ω is the value of T leaf − T opt at which Ф 2LL or κ 2LL falls to 1/e (where e is Euler's number) of its value at T opt.
2.5. Prediction of leaf photosynthetic rate with and without parameter acclimation
We combined the FvCB model [Equations (S1), (S4), (S5), and (S15)] with Equations (1) and (3) to predict A for the different temperature and water regime treatments of both experiments with the estimated photosynthetic parameters and their temperature response curve parameters. To test to what extent omitting photosynthetic acclimation to drought and T growth can affect model predictability, we compared two sets of predictions of A. One was predictions only considering the effect of drought stress or T growth on CO2 diffusional conductance [g s and δ m ‐ a unitless parameter allowing for the variable g m; see Equation (S14)]. Here the biochemical parameters (κ 2LL, J max, V cmax, T p and R d) were estimated from plants grown under optimal growth conditions (i.e. treatments WW and MT). This parametrization of the FvCB model is in line with the common practice where only the diffusional limitation is accounted for in modelling the effect of environment variables on A, namely assuming no biochemical acclimation (‘no acclimation’) as in an existing crop model (Yin & Struik, 2017). In the second set of predictions, we assumed a ‘full acclimation’ to growth environmental variables of all photosynthesis biochemical parameters. Thus, in this second set of prediction, we used treatment‐specific values of both CO2 diffusional conductance and biochemical parameters.
We then assessed to what extent each photosynthetic component can independently cause errors in predicting A under variable water supply and T growth. The set of ‘full acclimation’ was used as a reference to compare errors in A prediction by changing one parameter at a time from their values estimated under treatment‐specific conditions (i.e. values of the set of ‘full acclimation’) to their values estimated under the control growth conditions. Because the shape of temperature response curves is determined together by the shape parameters [e.g. E X , D X and S X in Equation (1)], these parameters were changed together, otherwise the curve would have become biologically meaningless. Therefore, for each photosynthetic parameter, the temperature response curve parameters (if they have) were divided into two parts: one is the value of relevant photosynthetic parameters estimated at a reference T leaf [i.e. X 25 in Equation (1) and X opt in Equation (3)], and the other is the shape parameters of the curve [i.e. E X , D X and S X in Equation (1), Ω and T opt in Equation (3)]. Here, values of the temperature response curve parameters of R d were taken from Fang et al. (2022), and the temperature response of R d was described by the simple Arrhenius equation [E x is the only shape parameter; see equation (6) in Fang et al., 2022].
2.6. Curve fitting and model analyses
Non‐linear curve fitting procedures in the FvCB model, Equations ((1), (2), (3)) were implemented using the GAUSS method in PROC NLIN of SAS (SAS Institute, Inc.). The SAS codes can be obtained upon request to the corresponding author. We fitted the GE and CF data by using pooled data of individual replicates to obtained estimates of photosynthetic parameters, which are most reliable for representing treatment‐specific parameters (which in fact are close to the mean of replicated estimates but have better statistical predictions of all data points than the mean). Therefore, the parameters of the modified Arrhenius equation [Equations (1) and (2)] and the normal distribution alike equation [Equation (3)] and their standard error of the estimates were estimated by using the parameter estimates estimated from the pooled data.
We assessed the goodness of the predictions of A with and without acclimation of the photosynthesis biochemical parameters using the relative root mean squared error (rRMSE) given by:
| (4) |
where n is the number of data points, and x̄ is the mean of the measured values, y i and x are the ith predicted and measured values respectively. Model analyses for prediction of A with and without parameter acclimation were conducted using R version 4.1.2 (R Foundation).
3. RESULTS
The above‐mentioned photosynthetic parameters were estimated for each T leaf, based on the GE and CF measurements on the well‐watered and severe water‐stressed plants grown under various T growth, thereby, their temperature responses were obtained, as described below.
3.1. Temperature response of light‐saturated net photosynthesis
In EXP2019, drought decreased A sat at the optimum temperature (A sat,opt) and at 25°C (A sat,25), as well as the optimum temperature for A sat (T opt,Asat) for both genotypes (Figure 1a; Table S5). In EXP2020, the response of A sat to T leaf was altered by both the water and T growth treatments (Figure 1b; Table S6). For WW plants, T opt,Asat increased with increasing T growth, while A sat,opt was not significantly affected by T growth treatments (Table S6). The drought treatment suppressed A sat at all T leaf, and this drought effect differed among the T growth treatments. For the three T growth treatments, T opt,Asat was 3.5–7°C lower for DS than for WW. Moreover, unlike for WW, for DS A sat,opt differed between T growth, with its value being lowest for HT and highest for MT (Figure 1b; Table S6).
FIGURE 1.
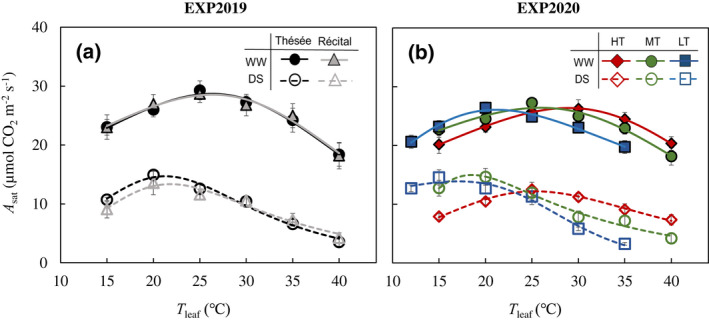
Temperature response of light‐saturated net CO2 assimilation rate (A sat). Response of measured A sat to leaf temperatures (T leaf) for the winter wheat genotypes Thésée (circles) and Récital (triangles) grown in a glasshouse under well‐watered (WW; filled symbols and solid lines) or drought‐stressed (DS; open symbols and dashed lines) conditions in EXP2019 (a), and for Thésée grown in climate chambers at high (HT, day/night temperature 28/24°C; rhombuses), medium (MT, day/night temperature 21/17°C; circles) or low (LT, day/night temperature 16/12°C; rectangles) growth temperature under WW (filled symbols and solid lines) or DS (open symbols and dashed lines) conditions in EXP2020 (b). A sat was measured at an incident irradiance of 2000 μmol m−2 s−1 and a C a of 400 ppm. Curves were drawn according to the modified‐Arrhenius equation, Equation (1), fitted to the data. Data are means ± 1 SE for n = 4–7 independent replicates.
3.2. Temperature response of CO2 diffusional conductance
Generally, for WW plants of EXP2019 and those grown at MT in EXP2020, g s increased with T leaf up to a maximum value at ~25°C and decreased at higher T leaf, but increased again at 40°C (also high VPDL, Figure 2a,b; Figure S2f), agreeing with results from previous report (Slot et al., 2016). For both genotypes, the optimum temperature for g s (T opt,gs) was 5°C lower for DS than for WW (Figure 2a). For EXP2020, T opt,gs increased with increasing T growth for both water treatments (Figure 2b). Drought stress suppressed g s at all T leaf (Figure 2a,b).
FIGURE 2.
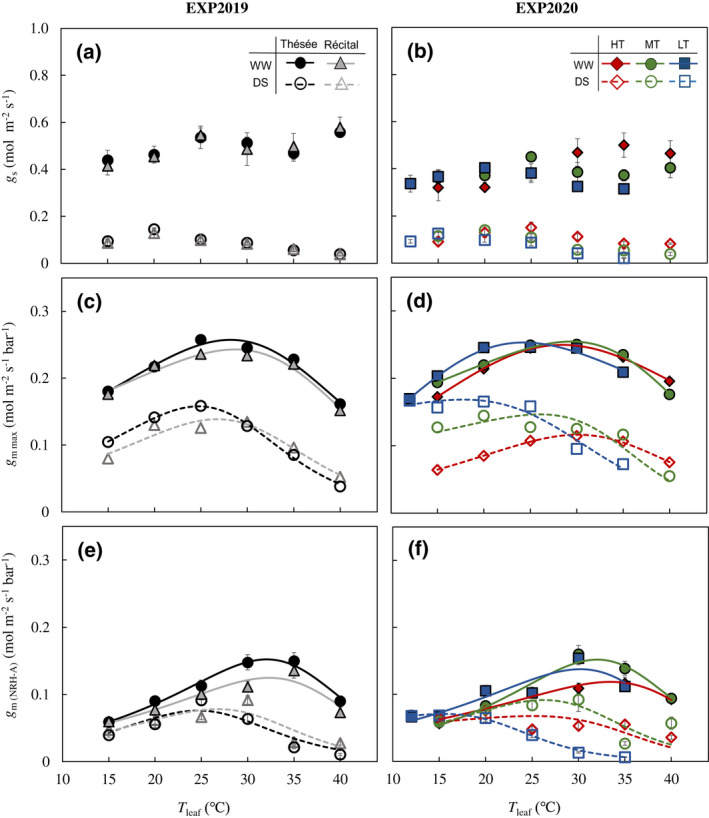
Temperature response of CO2 diffusional conductance. Responses of stomatal conductance measured at an incident irradiance of 2000 μmol m−2 s−1 and a C a of 400 ppm [g s; (a, b)], and mesophyll conductance estimated for the same conditions [g mmax; (c, d)] and by the NRH‐A method [g m(NRH‐A); (e, f)] to leaf temperature (T leaf) for the winter wheat genotypes Thésée and Récital grown in a glasshouse under well‐watered (WW; filled symbols and solid lines) or drought‐stressed (DS; open symbols and dashed lines) conditions in EXP2019 (a, c, e), and for Thésée grown in climate chambers at high (HT, day/night temperature 28/24°C; circles), medium (MT, day/night temperature 21/17°C; triangles) or low (LT, day/night temperature 16/12°C; rectangles) growth temperature under WW (filled symbols and solid lines) or DS (open symbols and dashed lines) conditions in EXP2020 (b, d, f). In (c–f) curves were drawn according to the modified‐Arrhenius equation, Equation (1), fitted to the data. In (a) and (b) data are means ± 1 SE for n = 4–7 independent replicates, and in (e) and (f) data are estimates ± 1 SE for n = 4–7 independent replicates.
Drought stress declined g mmax at its optimum temperature (g mmax,opt) and at 25°C (g mmax,25) for both genotypes and for all T growth (Tables S5 and S6). In EXP2019, under DS conditions the optimum temperature for g mmax (T opt,gmmax) slightly decreased for both genotypes; while in EXP2020, the shift of T opt,gmmax was obvious for LT but not for HT and MT (Figure 2c,d). Similarly, drought stress decreased g m(NRH‐A) at all T growth for T leaf > 20°C (Figure 2e,f). The drought treatment decreased the optimum temperature for g m(NRH‐A) (T opt,gm(NRH)), regardless of genotypes and T growth, and this decrease differed among T growth (Figure 2e,f).
3.3. Temperature response of electron transport parameters and quantum yield
Ф 2LL showed a limited response to T leaf, which is in line with previous results (Bernacchi et al., 2003; Yin et al., 2014). In EXP2019, Ф 2LL was roughly consistent between genotypes but slightly lower for DS compared with WW at all T leaf (Figure 3a,c; Table S7). For WW in EXP2020, Ф 2LL was not significantly affected by T growth, while drought stress increased the optimum temperature for Ф 2LL (T opt,Ф2LL) for all T growth under PR conditions (Figure 3b,d; Table S8).
FIGURE 3.
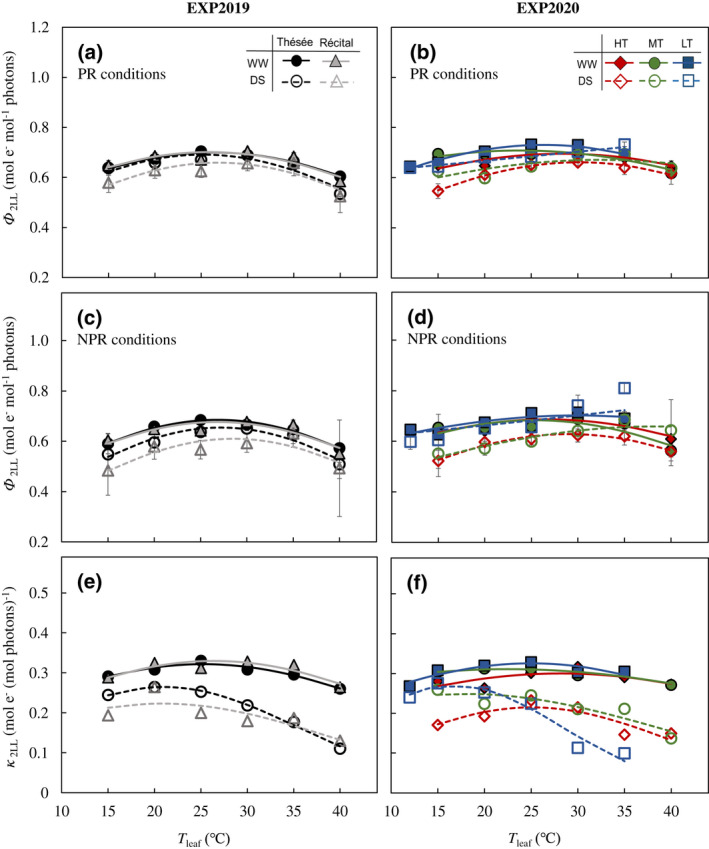
Temperature response of electron transport parameters. Responses of quantum efficiency of photosystem II electron transport at limiting light (Ф 2LL) for photorespiratory [PR; (a, b)] and non‐photorespiratory [NPR; (c, d)] conditions, and calculated conversion efficiency of limiting incident light into linear electron transport of photosystem II [κ 2LL; (e, f)] to leaf temperature (T leaf) for the winter wheat genotypes Thésée and Récital grown in a glasshouse under well‐watered (WW; filled symbols and solid lines) or drought‐stressed (DS; open symbols and dashed lines) conditions in EXP2019 (a, c, e), and for Thésée grown in climate chambers at high (HT, day/night temperature 28/24°C; circles), medium (MT, day/night temperature 21/17°C; triangles) or low (LT, day/night temperature 16/12°C; rectangles) growth temperature under WW (filled symbols and solid lines) or DS (open symbols and dashed lines) conditions in EXP2020 (b, d, f). Curves were drawn according to the modified‐Arrhenius equation, Equation (1), fitted to the data. In (a–d) data are estimates ± 1 SE for n = 4–7 independent replicates.
The calculated κ 2LL also showed a bell‐shape response to T leaf (Figure 3e,f). In EXP2019, for both genotypes, κ 2LL appeared to respond more to T leaf under DS than under WW (Figure 3e). Drought stress decreased κ 2LL at all T leaf, accompanied with decreases in the optimum temperature for κ 2LL (T opt,κ2LL) and its value at T opt,κ2LL (κ 2LL,opt; Tables S7 and S8). In EXP2020, κ 2LL,opt decreased with increasing T growth under both water regimes and T opt,κ2LL was higher for HT than for MT and LT (Figure 3f; Table S8).
The quantum yield of photosynthetic CO2 uptake (Ф CO2LL) depended significantly on T leaf, water regime, and photorespiratory condition, but not on genotype or T growth (Figure 4). Under PR conditions, drought stress increased the sensitivity of Ф CO2LL to T leaf. Under NPR conditions, Ф CO2LL of WW plants was essentially independent of T leaf (Figure 4c,d); however, for DS treatment, even under NPR conditions, Ф CO2LL decreased with increasing T leaf, although the temperature sensitivity of Ф CO2LL was weaker than for PR (Figure 4).
FIGURE 4.
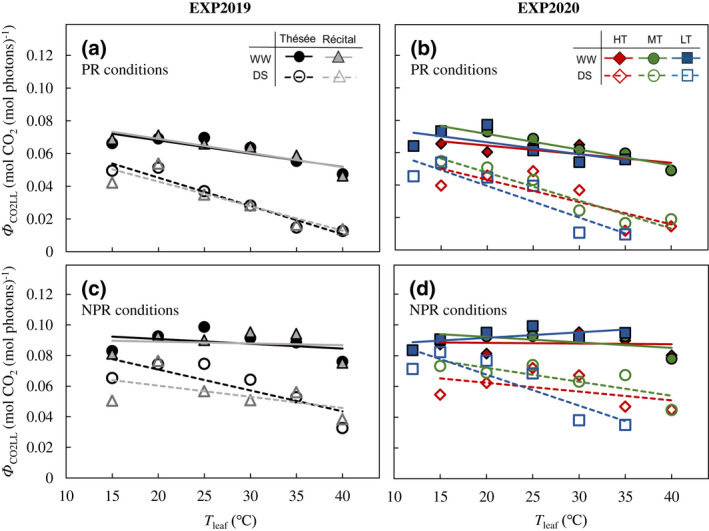
Temperature response of quantum yield. Responses of quantum yield of photosynthetic CO2 uptake (Ф CO2LL) for photorespiratory [PR, (a, b)] and non‐photorespiratory [NPR, (c, d)] conditions to leaf temperature (T leaf) for the winter wheat genotypes Thésée and Récital grown in a glasshouse under well‐watered (WW; filled symbols and solid lines) or drought‐stressed (DS; open symbols and dashed lines) conditions in EXP2019 (a, c), and for Thésée grown in climate chambers at high (HT, day/night temperature 28/24°C; circles), medium (MT, day/night temperature 21/17°C; triangles) or low (LT, day/night temperature 16/12°C; rectangles) growth temperature under WW (filled symbols and solid lines) or DS (open symbols and dashed lines) conditions in EXP2020 (b, d). Lines are linear regressions fitted to the data of each genotype and treatment.
3.4. Temperature response of photosynthetic capacity parameters
For both genotypes, under WW conditions J max increased with increasing T leaf but declined for T leaf > ~33°C (Figure 5a). J max decreased under DS conditions at all T leaf and its optimum temperature (T op,Jmax) was 8°C lower for DS compared with WW (Figure 5a; Table S5). T opt,Jmax increased with increasing T growth for both WW and DS, and it was ~10°C lower for DS than for WW at each T growth (Figure 5b; Table S6).
FIGURE 5.
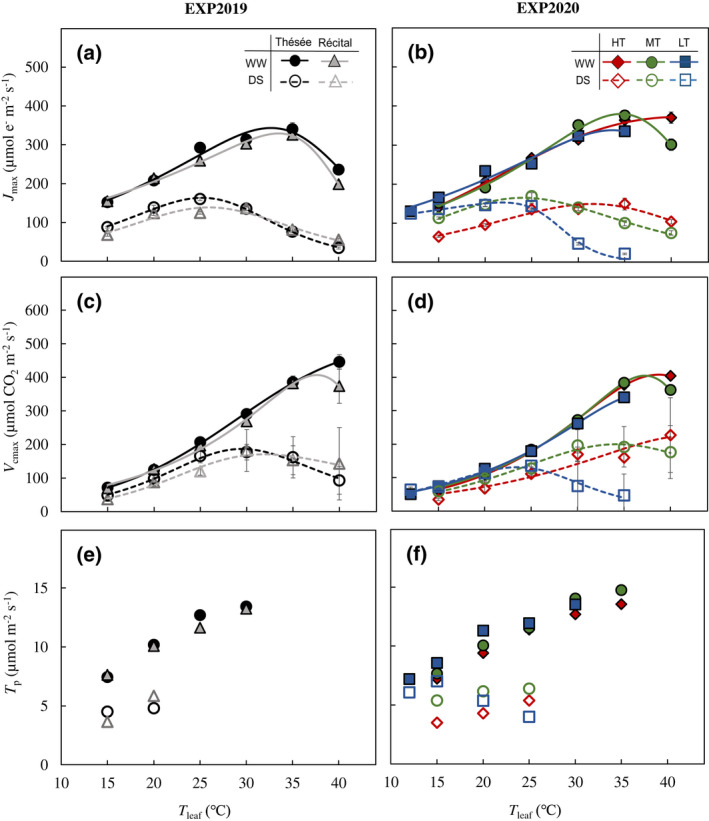
Temperature response of photosynthetic capacity parameters. Responses of the maximum rate of electron transport [J max; (a, b)], the maximum rate of carboxylation by rubisco [V cmax; (c, d)], and triose phosphate utilization [T p; (e, f)] to leaf temperature (T leaf) for the winter wheat genotypes Thésée and Récital grown in a glasshouse under well‐watered (WW; filled symbols and solid lines) or drought‐stressed (DS; open symbols and dashed lines) conditions in EXP2019 (a, c, e), and for Thésée grown in climate chambers at high (HT, day/night temperature 28/24°C; circles), medium (MT, day/night temperature 21/17°C; triangles) or low (LT, day/night temperature 16/12°C; rectangles) growth temperature under WW (filled symbols and solid lines) or DS (open symbols and dashed lines) conditions in EXP2020 (b, d, f). J max and V cmax at T leaf of 35 and 40°C for DS plants grown at HT and MT were estimated by fitting across‐replication average values due to the large variation of data under combined drought and high T leaf conditions. In (a–d), data are estimates ± 1 SE for n = 4–7 independent replicates, and curves were drawn according to the modified‐Arrhenius equation, Equation (1), fitted to the data.
In general, V cmax for WW plants increased exponentially with T leaf; drought stress slightly decreased V cmax while this decrease was significant for T leaf > 25°C (Figure 5c,d). The optimum temperature for V cmax (T opt,Vcmax) was lower for DS than for WW, but except for the case of HT in EXP2020 (Figure 5c,d). The ratio of J max to V cmax decreased with increasing T leaf irrespective of the water and T growth treatment (Figure S3).
As in previous studies (Harley & Sharkey, 1991; Yang et al., 2016), here the rate of triose phosphate utilization (T p) increased as T leaf increased from 15 to 30°C. However, T p was not estimated for T leaf > 30°C (in EXP2019) or 35°C (in EXP2020) for WW and for T leaf > 20°C (in EXP2019) or 25°C (in EXP2020) for DS (Figure 5e,f), indicating little limitation set by triose phosphate utilization. Therefore, no temperature response curve was drawn for T p in Figure 5e,f.
3.5. Effects of neglecting acclimation to growth environments on the prediction of photosynthetic rate
Since we found considerable acclimation of photosynthesis to drought and T growth, we assessed to what extent the results of the FvCB model may be affected by different growth and measurement conditions. A was simulated using the model with and without drought and T growth acclimation of photosynthetic biochemical parameters (κ 2LL, J max, V cmax, T p and R d). The simulated results were compared with measured A under specific growth conditions. As stated earlier, for both sets of simulations, the acclimation of CO2 diffusional conductance was considered.
When no acclimation of biochemical parameters was considered, the FvCB model overestimated A under drought stress by 37%–87%, with rRMSE >1 (Figure 6a,c,e,i). The difference between measured and simulated A increased as T leaf increased, especially for plants grown at MT and LT (Figure 6e,i). In contrast, when the acclimation of photosynthetic biochemical parameters was considered, the FvCB model gave good results for all treatments (Figure 6b,d,f,j). For comparison, omitting CO2 diffusional conductance acclimation under drought increased error values across genotypes and T growth. In addition to CO2 diffusional conductance, omitting drought acclimation of electron transport parameters (J max and κ 2LL) also led to considerable errors under all T growth, but the error values varied among T growth (Figure 7a). However, when neglecting the drought acclimation of other biochemical parameters (V cmax, R d and T p), the errors were insubstantial as compared with neglecting the acclimation of CO2 diffusional and electron transport parameters (Figure 7a). On the other hand, when neglecting T growth acclimation, the model did not overestimate A, while the difference between measured and simulated A was larger in ‘no acclimation’ set than in ‘full acclimation’ set (Figure 6g,k). The larger variability was attributed to V cmax and R d under HT and to J max and CO2 diffusional conductance under LT (Figure 7b).
FIGURE 6.
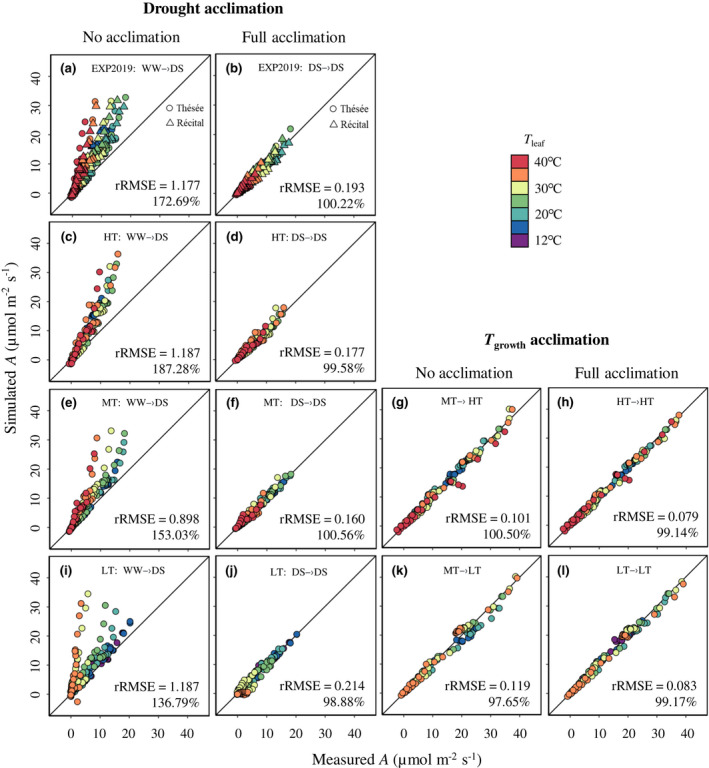
Comparisons between measured and simulated net CO2 assimilation rate (A). Comparisons between measured A and simulated A either considering only the acclimation of CO2 diffusional parameters but omitting the acclimation of photosynthetic biochemical parameters (a, c, e, i, g, k, no acclimation) or considering the acclimation of both CO2 diffusional and photosynthetic biochemical parameters (b, d, f, j, h, l, full acclimation), across treatments and measurement conditions. The text in each panel with an arrow, for example, WW → DS, means using the parameters estimated under the well‐watered (WW) treatment as inputs to predict A under the drought‐stressed (DS) treatment (other treatment abbreviations: LT, low growth temperature; MT, medium growth temperature; HT, high growth temperature). The solid diagonal represents the 1:1 relationship. The percentage in each panel is the average of simulated relative to observed A. rRMSE is the relative root mean squared error, as defined by Equation (4).
FIGURE 7.
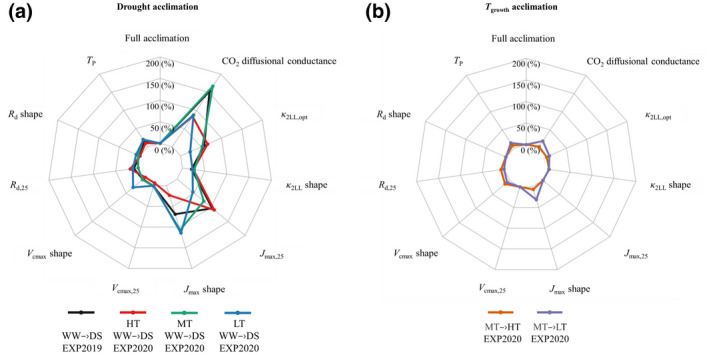
Relative changes (%) in relative root mean squared error (rRMSE) of model prediction. Relative changes in rRMSE of model prediction using different sets of parameter values relative to that of prediction assuming the ‘full acclimation’, for data involving responses to drought (a) or involving responses to growth temperature (b). To what extent photosynthetic parameters can independently cause errors in predicting net CO2 assimilation was assessed by fixing these parameters, one at a time, from their values estimated under treatment‐specific conditions (i.e. values of the set of ‘full acclimation’) to their values estimated under optimal growth conditions (i.e. parameter values assuming no acclimation to growth conditions). The higher relative change in percentage means a greater error in predictions when their acclimations were neglected. Text in the figure legend with an arrow, for example, WW → DS, means using the parameters estimated under the well‐watered (WW) treatment as inputs to predict A under the drought‐stressed (DS) treatment (other treatment abbreviations: LT, low growth temperature; MT, medium growth temperature; HT, high growth temperature). Note that parameters of temperature response curve were divided into two parts: One is the parameter value at a reference T leaf [i.e. X 25 for Equation (1) and X opt for Equation (3)]; the other is the shape parameters of the temperature response curve [i.e. E X , D X and S X for Equation (1), Ω and T opt for Equation (3)].
4. DISCUSSION
Plants have a strong ability to adjust their photosynthetic capacity in response to both short‐ (seconds to minutes) and long‐term (days to weeks) changes in environmental conditions (Moore et al., 2021; Posch et al., 2019). In the present study, we investigated if temperature responses of photosynthesis components acclimate to seasonal T growth and long‐term severe water deficit and to what extent the acclimation of photosynthetic parameters to environmental variables can affect the predictability of the FvCB model. Main results about the acclimation responses of various photosynthetic parameters are discussed as follows.
4.1. General photosynthetic acclimation responses to growth temperature and drought
In general, A sat,opt was not affected by T growth under WW conditions, but its temperature response acclimated strongly to both drought and T growth. We found drought stress lowered T opt,Asat across T growth, which was consistent with findings of a recent study in Eucalyptus trees (Kumarathunge et al., 2020), implying that C3 grasses and C3 trees may respond similarly to water stress. Moreover, T opt,Asat and T opt of other photosynthetic components (e.g. g m, κ 2LL, J max and V cmax) were more sensitive to T growth under DS conditions (Figure S4), and were closer to daytime T growth under DS than under WW conditions, implying that the adverse conditions forced plants to acclimate more in order to maximize CO2 uptake for survival. Our previous study showed that there is an interactive effect of drought and T growth on the sensitivity of R d to T leaf (Fang et al., 2022), and consequently the R d/(A sat + R d) ratio was altered by drought and T growth, suggesting that leaf carbon use efficiency, that is, [1 − R d/(A sat + R d)], was altered by environmental changes (Figure S5).
Previous studies suggested that photosynthetic acclimation to long‐term changes in environmental variables (e.g. CO2 elevation and/or T growth elevation) is mainly due to the changes in leaf nitrogen status, as they found linear relationships between photosynthetic parameters and leaf nitrogen content across various environmental factors (Cai et al., 2020; Harley et al., 1992; Yin, 2013). However, we found that photosynthetic parameters generally showed poor correlations with N area across T growth and water regimes despite weak correlations within the drought treatment (Figure S6a–d). Part of the reasons for the poor correlation is that our values of N area was only in the narrow, high range of leaf N (i.e. from 1.5 to 2.5 g N m−2, agreeing with previously recorded ~2 g N m−2 for wheat with sufficient N supply; Cai et al., 2020; Wang et al., 2022; Yin et al., 2019). Along with the acclimation of the above physiological and biochemical processes, we found that the leaf morphological trait LMA also acclimated to environmental variables. Again, little correlation was observed between photosynthetic parameters and LMA (Figure S6e–h).
4.2. Acclimation responses in CO2 diffusional conductance to growth temperature and drought
A previous study observed that the shape of the response of g s to T leaf is not modified by T growth, although g s is higher under high T growth than under low T growth (Yamori et al., 2006). However, our results showed that T growth altered not only the magnitude of g s values but also the shape of the response of g s to T leaf. For WW plants in EXP2019 and those grown at MT in EXP2020, g s increased again when T leaf was >35°C, whereby leaf cooling increased. This is consistent with recent studies suggesting that there could be a decoupling between A and g s resulting in a trade‐off between carbon gain and evaporative cooling at extremely high temperature when water availability is unlimited (Moore et al., 2021; Slot et al., 2016).
The shape of the response of either g mmax or g m(NRH‐A) to T leaf under WW conditions was similar to that previously reported (Warren, 2008 and references therein). Drought stress altered the shape of the response of g mmax to T leaf for both genotypes for all T growth by decreasing T opt,gmmax and/or g mmax,opt. Moreover, T growth altered T opt,gm(NRH‐A) and g m(NRH‐A),opt under both WW and DS conditions, while this alteration was only obvious under DS conditions for g mmax. These alterations by water stress and T growth suggest that g m could acclimate to environmental variables and this acclimation could be associated with changes in physical and anatomical properties (e.g. cell wall thickness, surface area of chloroplasts) and in proteins and enzymes, for example, aquaporins and carbonic anhydrase (Flexas & Diaz‐Espejo, 2015; Ouyang et al., 2017; von Caemmerer & Evans, 2015).
4.3. Acclimation responses of electron transport and quantum yield to growth temperature and drought
Previous studies indicated that the thermal response curve of Ф 2LL is parabolic (Yin et al., 2014) and its shape is unaffected by T growth (Bernacchi et al., 2003). Here, our data showed that neither T growth nor the genotype affected T leaf dependency of Ф 2LL. However, drought stress slightly decreased Ф 2LL at lower T leaf, but not for T leaf > 35°C, leading to increases in T opt,Ф2LL. This is in agreement with an earlier study showing an increased thermostability of PSII to heat stress in drought‐stressed plants (Lu & Zhang, 1999).
Yin et al. (2014) suggested that both Ф 2LL and the slope factor [ and , see Equation (S19)] should be accounted for to estimate Ф CO2LL. lumps two parameters: the interphotosystem energy partitioning (ρ 2), and the alternative electron fraction in the form of . is multiplied by an additional term , see Equation (S19). In line with the results of Yin et al. (2014), our data showed that the response of Ф CO2LL to T leaf was also parabolic, which was attributed to Ф 2LL, while the difference in Ф CO2LL response to T leaf between different photorespiratory conditions could be explained by the term (i.e. the amount of photorespiration). The higher relative loss due to photorespiration [as indicated by ; Figure S7] in DS plants and the increased photorespiration with increased T leaf could be responsible for the stronger T leaf sensitivity of Ф CO2LL under PR conditions across water regimes and T growth. However, Ф CO2LL under NPR conditions still differed between WW and DS plants, suggesting that photorespiration was not the only reason for the different thermal sensitivity. Our previous study has demonstrated that the gas mixture we used (2% O2 combined with 1000 ppm C a) for estimating the calibration factor (i.e. here) did allow to reach a nearly NPR state, even for extreme conditions (Fang et al., 2022). Given that ρ 2 most likely does not vary much, the declines in Ф CO2LL with increasing T leaf in DS plants under NPR conditions indicated that the second parameter , see Equation (S19), increased significantly under drought, especially when combined with high temperature. The increase in this parameter, representing the overall fraction for alternative electron transport (Yin et al., 2016), agrees with the result of Zivcak et al. (2013) that alternative electron transport operates as a means of photoprotection under drought.
4.4. Acclimation responses in photosynthetic capacity parameters to growth temperature and drought
The effects of T growth on photosynthetic capacity parameters (i.e. J max and V cmax) have been widely investigated but with inconsistent results (Kattge & Knorr, 2007; Kumarathunge et al., 2019). As compared with T growth, drought stress exerted a greater impact on photosynthetic capacity. J max was significantly suppressed under DS conditions and the effect of drought on J max increased as T leaf increased. T opt,Jmax was lower under DS conditions compared to WW conditions, although the extent of the decrease in T opt,Jmax under drought depended on T growth. Previous studies have indicated that drought stress can lead to damage of the electron transport chain, along with ATP shortage, thereby limiting the regeneration of RuBP, that is, J max (Campos et al., 2014; Tezara et al., 1999). However, damage to the electron transport chain cannot explain the decreased T opt,Jmax observed here. Changes in T opt,Jmax in response to T growth may be associated with the thermal acclimation of the thylakoid membrane (von Caemmerer et al., 2009). Thus, we speculate that the acclimation of the thylakoid membrane may also occur when plants are grown under drought stress, and it is conceivable that this acclimation to drought would be different under contrasting T growth.
Our results showed that the decrease in V cmax under drought was limited for T leaf < 25°C for both genotypes and for all T growth. This is consistent with Galmés et al. (2013) who reported that the effects of drought on Rubisco‐related parameters were not significant or only minor across species and studies, and with Kumarathunge et al. (2020) who showed that V cmax,25 values were similar between two different water regimes across various T growth. Moreover, in vitro assays showed that Rubisco activity and Rubisco carboxylase maximum turnover rate decrease only for measurement temperature >50°C (Galmés et al., 2015; Salvucci & Crafts‐Brandner, 2004). Therefore, although a decrease in V cmax has sometimes been observed at extremely high T leaf (Leuning, 2002; Medlyn et al., 2002), the temperature response of V cmax was originally modelled by the simple non‐peaked Arrhenius equation (Farquhar et al., 1980). This is supported by our data under well‐watered conditions, where V cmax,Topt was mostly not observed up to our highest T leaf of 40°C. However, surprisingly, T opt,Vcmax was decreased by drought, owing to the substantial decrease in V cmax for T leaf > ~30°C. The decrease in g m under drought suggested that low C c under drought stress might cause the decrease in T opt,Vcmax. Evidence showed that low C c could induce the deactivation of Rubisco sites (Galmés et al., 2011). Hikosaka et al. (2006) and Yamori et al. (2014) also indicated that changes in activity and thermal lability of Rubisco and Rubisco activase might also be involved in drought acclimation. Therefore, our observed decline of V cmax at high T leaf under drought might reflect drought induced changes not only in the activity but also in activation state of Rubisco. The full mechanisms behind the complex interactive effect of drought stress and T growth on the response of V cmax to T leaf (Figure 5d) remain to be elucidated.
4.5. The necessity of considering acclimation of photosynthetic components when projecting photosynthesis under various growth conditions
Projecting future GPP in the context of climate change is strongly affected by uncertainties in not only the short‐term but also the long‐term responses of photosynthetic parameters to environmental variables. Although photosynthetic acclimation to T growth has been empirically modelled (Huang et al., 2019; Mercado et al., 2018; Smith et al., 2016), uncertainties remain, as this acclimation could be interactively affected by other environmental variables, for instance, the interaction between T growth and drought as shown in our study.
Earlier photosynthesis models only assumed that water stress directly affects photosynthesis through g s (e.g. Yin & van Laar, 2005). Using Equations (S14) and (S15) would indirectly account for the drought effect on the other diffusional parameter g m, which has been incorporated into recent crop models (e.g. Yin & Struik, 2017). But overall, these models still do not account for drought acclimation of biochemical parameters. However, our study revealed that although the CO2 diffusional parameters matter substantially for model prediction, biochemical parameters (κ 2LL, J max, V cmax, T p and R d) also acclimate to various environments, and consequently our results clearly showed that neglecting this acclimation leads to critical errors in predicting A (Figures 6 and 7). Moreover, simulation analysis showed that omitting drought acclimation of κ 2LL and J max, both for values estimated at a reference T leaf and the shape parameters, resulted in significant errors in predicting leaf photosynthetic rate; while the influence of omitting the acclimation of V cmax, T p or R d was limited (Figure 7). These results are in line with the reports of Gu et al. (2014), Yin et al. (2022) and Harbinson and Yin (2022), who showed electron transport parameters, rather than Rubisco‐related parameters (i.e. V cmax), contribute most to the variation of plant productivity. Nevertheless, V cmax, T p and R d still had influence on the prediction of photosynthetic capacity (Figure 7). Our results suggest that the acclimation of these biochemical parameters to environmental variables should not be neglected as well, in particular under drought conditions and at high T leaf.
Kattge and Knorr (2007) proposed simple algorithms to represent and parameterize the temperature acclimation of biochemical parameters of photosynthesis across 36 C3 species, thereby allowing the acclimation to be implemented directly in models. The algorithms were later extended by Kumarathunge et al. (2019) with broader ranges of species and geographical gradients. However, none of these previous studies addressed acclimation parameterization of photosynthetic components under water stress. Although we provided a clear case to demonstrate the necessity to consider drought acclimation of biochemical parameters in predicting photosynthesis, more experimental work and theoretical analysis on how biochemical parameters acclimate to water stress under various T growth and levels of water deficit, for different species and geographical locations is urgently needed.
4.6. Concluding remarks
Typical practices in ecophysiological and modelling studies on the impact of climate change variables on (agro)ecosystems assume: (i) photosynthetic acclimation to environmental factors (e.g. elevated CO2 and/or elevated T growth) is associated with altered leaf N content (e.g. Cai et al., 2020; Dusenge et al., 2020; Yin, 2013), and (ii) the impact of water stress on photosynthesis is via the decrease in diffusional parameters (e.g. Centritto et al., 2009; Kumarathunge et al., 2020; Yin & Struik, 2017). Therefore, many current models do not consider the drought acclimation of biochemical parameters. However, we found that both diffusional and biochemical parameters and their thermal sensitivity considerably acclimate to drought and the combination of drought and T growth. Consequently, neglecting this acclimation would lead to critical errors in predicting leaf photosynthetic capacity, particularly under extreme conditions such as drought stress and heat shocks (i.e. when T leaf is high). We have also shown that these acclimation responses to drought and T growth cannot be explained by the altered leaf N content. Several alternative mechanisms have been discussed. Further research is needed to reveal mechanisms underlying these acclimation responses. In addition, the ‘deacclimation’ of photosynthesis related processes after rewatering should also be analysed. Finally, the priming effect of mild water deficit that may help plants cope with later and more severe drought (e.g. Wang et al., 2015) should also be considered. All these would provide empirical data that help develop mechanistic algorithms for the photosynthetic acclimation to a set of environmental combinations across species, thereby minimizing uncertainties in global modelling framework for projecting the impact of climate change on (agro)ecosystems.
AUTHOR CONTRIBUTIONS
Xinyou Yin and Liang Fang conceived the study. Liang Fang and Peter E. L. van der Putten designed the experiments. Liang Fang, Kaining Jin, Xinmiao Du and Peter E. L. van der Putten conducted the measurements. Liang Fang, Kaining Jin, Xinmiao Du, Pierre Martre and Xinyou Yin analyzed the data. Liang Fang wrote the draft and finalized it with significant input from Pierre Martre, Xinyou Yin and Paul C. Struik.
CONFLICT OF INTEREST
The authors have no conflict of interest to declare.
Supporting information
Appendix S1
ACKNOWLEDGEMENTS
We thank David Brink, Gerrit Stunnenberg and Taede Stoker for their support in the use of climate chambers and climate cabinets. We are thankful to Yanda Zhou and Zhonghao Mei for their help with the experiments. We are grateful to the two anonymous reviewers who provided very useful comments that allowed us to improve our manuscript. Liang Fang thanks the China Scholarship Council for awarding him a PhD fellowship at Wageningen University and Research to conduct this study.
Fang, L. , Martre, P. , Jin, K. , Du, X. , van der Putten, P. E. L. , Yin, X. , & Struik, P. C. (2023). Neglecting acclimation of photosynthesis under drought can cause significant errors in predicting leaf photosynthesis in wheat. Global Change Biology, 29, 505–521. 10.1111/gcb.16488
DATA AVAILABILITY STATEMENT
The data that support the findings of this study are openly available in 4TU.ResearchData at http://doi.org/10.4121/21304917.
REFERENCES
- Asseng, S. , Ewert, F. , Martre, P. , Rötter, R. P. , Lobell, D. B. , Cammarano, D. , Kimball, B. A. , Ottman, M. J. , Wall, G. W. , White, J. W. , Reynolds, M. P. , Alderman, P. D. , Prasad, P. V. V. , Aggarwal, P. K. , Anothai, J. , Basso, B. , Biernath, C. , Challinor, A. J. , De Sanctis, G. , … Zhu, Y. (2015). Rising temperatures reduce global wheat production. Nature Climate Change, 5(2), 143–147. 10.1038/nclimate2470 [DOI] [Google Scholar]
- Barber, H. M. , Carney, J. , Alghabari, F. , & Gooding, M. J. (2015). Decimal growth stages for precision wheat production in changing environments? Annals of Applied Biology, 166(3), 355–371. 10.1111/aab.12207 [DOI] [Google Scholar]
- Bernacchi, C. J. , Pimentel, C. , & Long, S. P. (2003). In vivo temperature response functions of parameters required to model RuBP‐limited photosynthesis. Plant, Cell & Environment, 26(9), 1419–1430. 10.1046/j.0016-8025.2003.01050.x [DOI] [Google Scholar]
- Bernacchi, C. J. , Rosenthal, D. M. , Pimentel, C. , Long, S. P. , & Farquhar, G. D. (2009). Modeling the temperature dependence of C3 photosynthesis. In Laisk, A. , Nedbal, L. & Govindjee (Eds.), Photosynthesis in silico: Understanding complexity from molecules to ecosystems (pp. 231–246). Springer. 10.1007/978-1-4020-9237-4_10 [DOI] [Google Scholar]
- Cai, C. , Li, G. , Di, L. , Ding, Y. , Fu, L. , Guo, X. , Struik, P. C. , Pan, G. , Li, H. , Chen, W. , Luo, W. , & Yin, X. (2020). The acclimation of leaf photosynthesis of wheat and rice to seasonal temperature changes in T‐FACE environments. Global Change Biology, 26(2), 539–556. 10.1111/gcb.14830 [DOI] [PubMed] [Google Scholar]
- Cai, C. , Li, G. , Yang, H. , Yang, J. , Liu, H. , Struik, P. C. , Luo, W. , Yin, X. , Di, L. , Guo, X. , Jiang, W. , Si, C. , Pan, G. , & Zhu, J. (2018). Do all leaf photosynthesis parameters of rice acclimate to elevated CO2, elevated temperature, and their combination, in FACE environments? Global Change Biology, 24(4), 1685–1707. 10.1111/gcb.13961 [DOI] [PubMed] [Google Scholar]
- Campos, H. , Trejo, C. , Peña‐Valdivia, C. B. , García‐Nava, R. , Conde‐Martínez, F. V. , & Cruz‐Ortega, M. R. (2014). Stomatal and non‐stomatal limitations of bell pepper (Capsicum annuum L.) plants under water stress and re‐watering: Delayed restoration of photosynthesis during recovery. Environmental and Experimental Botany, 98, 56–64. 10.1016/j.envexpbot.2013.10.015 [DOI] [Google Scholar]
- Centritto, M. , Lauteri, M. , Monteverdi, M. C. , & Serraj, R. (2009). Leaf gas exchange, carbon isotope discrimination, and grain yield in contrasting rice genotypes subjected to water deficits during the reproductive stage. Journal of Experimental Botany, 60(8), 2325–2339. 10.1093/jxb/erp123 [DOI] [PubMed] [Google Scholar]
- Crous, K. Y. , Drake, J. E. , Aspinwall, M. J. , Sharwood, R. E. , Tjoelker, M. G. , & Ghannoum, O. (2018). Photosynthetic capacity and leaf nitrogen decline along a controlled climate gradient in provenances of two widely distributed eucalyptus species. Global Change Biology, 24(10), 4626–4644. 10.1111/gcb.14330 [DOI] [PubMed] [Google Scholar]
- Dai, L. , Xu, Y. , Harmens, H. , Duan, H. , Feng, Z. , Hayes, F. , Sharps, K. , Radbourne, A. , & Tarvainen, L. (2021). Reduced photosynthetic thermal acclimation capacity under elevated ozone in poplar (Populus tremula) saplings. Global Change Biology, 27(10), 2159–2173. 10.1111/gcb.15564 [DOI] [PubMed] [Google Scholar]
- Dusenge, M. E. , Madhavji, S. , & Way, D. A. (2020). Contrasting acclimation responses to elevated CO2 and warming between an evergreen and a deciduous boreal conifer. Global Change Biology, 26(6), 3639–3657. 10.1111/gcb.15084 [DOI] [PubMed] [Google Scholar]
- Dusenge, M. E. , Wittemann, M. , Mujawamariya, M. , Ntawuhiganayo, E. B. , Zibera, E. , Ntirugulirwa, B. , Way, D. A. , Nsabimana, D. , Uddling, J. , & Wallin, G. (2021). Limited thermal acclimation of photosynthesis in tropical montane tree species. Global Change Biology, 27(19), 4860–4878. 10.1111/gcb.15790 [DOI] [PubMed] [Google Scholar]
- Fang, L. , Yin, X. , van der Putten, P. E. , Martre, P. , & Struik, P. C. (2022). Drought exerts a greater influence than growth temperature on the temperature response of leaf day respiration in wheat (Triticum aestivum). Plant, Cell & Environment, 45(7), 2062–2077. 10.1111/pce.14324 [DOI] [PMC free article] [PubMed] [Google Scholar]
- Farquhar, G. D. , von Caemmerer, S. V. , & Berry, J. A. (1980). A biochemical model of photosynthetic CO2 assimilation in leaves of C3 species. Planta, 149(1), 78–90. 10.1007/BF00386231 [DOI] [PubMed] [Google Scholar]
- Flexas, J. , & Diaz‐Espejo, A. (2015). Interspecific differences in temperature response of mesophyll conductance: Food for thought on its origin and regulation. Plant, Cell & Environment, 38(4), 625–628. 10.1111/pce.12476 [DOI] [PubMed] [Google Scholar]
- Flexas, J. , Diaz‐Espejo, A. , Galmes, J. , Kaldenhoff, R. , Medrano, H. , & Ribas‐Carbó, M. (2007). Rapid variations of mesophyll conductance in response to changes in CO2 concentration around leaves. Plant, Cell & Environment, 30(10), 1284–1298. 10.1111/j.1365-3040.2007.01700.x [DOI] [PubMed] [Google Scholar]
- Flexas, J. , & Medrano, H. (2002). Drought‐inhibition of photosynthesis in C3 plants: Stomatal and non‐stomatal limitations revisited. Annals of Botany, 89(2), 183–189. 10.1093/aob/mcf027 [DOI] [PMC free article] [PubMed] [Google Scholar]
- Galmés, J. , Aranjuelo, I. , Medrano, H. , & Flexas, J. (2013). Variation in rubisco content and activity under variable climatic factors. Photosynthesis Research, 117(1), 73–90. 10.1007/s11120-013-9861-y [DOI] [PubMed] [Google Scholar]
- Galmés, J. , Kapralov, M. V. , Copolovici, L. O. , Hermida‐Carrera, C. , & Niinemets, Ü. (2015). Temperature responses of the rubisco maximum carboxylase activity across domains of life: Phylogenetic signals, trade‐offs, and importance for carbon gain. Photosynthesis Research, 123(2), 183–201. 10.1007/s11120-014-0067-8 [DOI] [PubMed] [Google Scholar]
- Galmés, J. , Ribas‐Carbó, M. , Medrano, H. , & Flexas, J. (2011). Rubisco activity in Mediterranean species is regulated by the chloroplastic CO2 concentration under water stress. Journal of Experimental Botany, 62(2), 653–665. 10.1093/jxb/erq303 [DOI] [PMC free article] [PubMed] [Google Scholar]
- Genty, B. , Briantais, J. M. , & Baker, N. R. (1989). The relationship between the quantum yield of photosynthetic electron transport and quenching of chlorophyll fluorescence. Biochimica et Biophysica Acta (BBA)‐General Subjects, 990(1), 87–92. 10.1016/S0304-4165(89)80016-9 [DOI] [Google Scholar]
- Girousse, C. , Inchboard, L. , Deswarte, J. C. , & Chenu, K. (2021). How does post‐flowering heat impact grain growth and its determining processes in wheat? Journal of Experimental Botany, 72(18), 6596–6610. 10.1093/jxb/erab282 [DOI] [PubMed] [Google Scholar]
- Gu, J. , Yin, X. , Stomph, T. , & Struik, P. C. (2014). Can exploiting natural genetic variation in leaf photosynthesis contribute to increasing rice productivity? A simulation analysis. Plant, Cell & Environment, 37(1), 22–34. 10.1111/pce.12173 [DOI] [PubMed] [Google Scholar]
- Harbinson, J. , & Yin, X. (2022). Modelling the impact of improved photosynthetic properties on crop performance in Europe. Food and Energy Security. 10.1002/fes3.402 (in press). [DOI] [Google Scholar]
- Harley, P. C. , & Sharkey, T. D. (1991). An improved model of C3 photosynthesis at high CO2: Reversed O2 sensitivity explained by lack of glycerate reentry into the chloroplast. Photosynthesis Research, 27(3), 169–178. 10.1007/BF00035838 [DOI] [PubMed] [Google Scholar]
- Harley, P. C. , Thomas, R. B. , Reynolds, J. F. , & Strain, B. R. (1992). Modelling photosynthesis of cotton grown in elevated CO2 . Plant, Cell & Environment, 15(3), 271–282. 10.1111/j.1365-3040.1992.tb00974.x [DOI] [Google Scholar]
- Hikosaka, K. , Ishikawa, K. , Borjigidai, A. , Muller, O. , & Onoda, Y. (2006). Temperature acclimation of photosynthesis: Mechanisms involved in the changes in temperature dependence of photosynthetic rate. Journal of Experimental Botany, 57(2), 291–302. 10.1093/jxb/erj049 [DOI] [PubMed] [Google Scholar]
- Huang, M. , Piao, S. , Ciais, P. , Peñuelas, J. , Wang, X. , Keenan, T. F. , Peng, S. , Berry, J. A. , Wang, K. , Mao, J. , Alkama, R. , Cescatti, A. , Cuntz, M. , De Deurwaerder, H. , Gao, M. , He, Y. , Liu, Y. , Luo, Y. , Myneni, R. B. , … Janssens, I. A. (2019). Air temperature optima of vegetation productivity across global biomes. Nature Ecology & Evolution, 3(5), 772–779. 10.1038/s41559-019-0838-x [DOI] [PMC free article] [PubMed] [Google Scholar]
- IPCC . (2021). Climate change 2021: The physical science basis. In Masson‐Delmotte V., Zhai P., & Pirani A. (Eds.), Contribution of working group I to the sixth assessment report of the intergovernmental panel on climate change (2391 pp). Cambridge University Press. 10.1017/9781009157896 [DOI] [Google Scholar]
- June, T. , Evans, J. R. , & Farquhar, G. D. (2004). A simple new equation for the reversible temperature dependence of photosynthetic electron transport: A study on soybean leaf. Functional Plant Biology, 31(3), 275–283. 10.1071/FP03250 [DOI] [PubMed] [Google Scholar]
- Kattge, J. , & Knorr, W. (2007). Temperature acclimation in a biochemical model of photosynthesis: A reanalysis of data from 36 species. Plant, Cell & Environment, 30(9), 1176–1190. 10.1111/j.1365-3040.2007.01690.x [DOI] [PubMed] [Google Scholar]
- Kumarathunge, D. P. , Drake, J. E. , Tjoelker, M. G. , López, R. , Pfautsch, S. , Vårhammar, A. , & Medlyn, B. E. (2020). The temperature optima for tree seedling photosynthesis and growth depend on water inputs. Global Change Biology, 26(4), 2544–2560. 10.1111/gcb.14975 [DOI] [PubMed] [Google Scholar]
- Kumarathunge, D. P. , Medlyn, B. E. , Drake, J. E. , Tjoelker, M. G. , Aspinwall, M. J. , Battaglia, M. , Cano, F. J. , Carter, K. R. , Cavaleri, M. A. , Cernusak, L. A. , Chambers, J. Q. , Crous, K. Y. , De Kauwe, M. G. , Dillaway, D. N. , Dreyer, E. , Ellsworth, D. S. , Ghannoum, O. , Han, Q. , Hikosaka, K. , … Way, D. A. (2019). Acclimation and adaptation components of the temperature dependence of plant photosynthesis at the global scale. New Phytologist, 222(2), 768–784. 10.1111/nph.15668 [DOI] [PubMed] [Google Scholar]
- Leuning, R. (2002). Temperature dependence of two parameters in a photosynthesis model. Plant, Cell & Environment, 25(9), 1205–1210. 10.1046/j.1365-3040.2002.00898.x [DOI] [Google Scholar]
- Lloret, F. , Escudero, A. , Iriondo, J. M. , Martínez‐Vilalta, J. , & Valladares, F. (2012). Extreme climatic events and vegetation: The role of stabilizing processes. Global Change Biology, 18(3), 797–805. 10.1111/j.1365-2486.2011.02624.x [DOI] [Google Scholar]
- Lobell, D. B. , & Gourdji, S. M. (2012). The influence of climate change on global crop productivity. Plant Physiology, 160(4), 1686–1697. 10.1104/pp.112.208298 [DOI] [PMC free article] [PubMed] [Google Scholar]
- Loriaux, S. D. , Avenson, T. J. , Welles, J. M. , McDermitt, D. K. , Eckles, R. D. , Riensche, B. , & Genty, B. (2013). Closing in on maximum yield of chlorophyll fluorescence using a single multiphase flash of sub‐saturating intensity. Plant, Cell & Environment, 36(10), 1755–1770. 10.1111/pce.12115 [DOI] [PubMed] [Google Scholar]
- Lu, C. , & Zhang, J. (1999). Effects of water stress on photosystem II photochemistry and its thermostability in wheat plants. Journal of Experimental Botany, 50(336), 1199–1206. 10.1093/jxb/50.336.1199 [DOI] [Google Scholar]
- Ma, W. T. , Tcherkez, G. , Wang, X. M. , Schäufele, R. , Schnyder, H. , Yang, Y. , & Gong, X. Y. (2021). Accounting for mesophyll conductance substantially improves 13C‐based estimates of intrinsic water‐use efficiency. New Phytologist, 229(3), 1326–1338. 10.1111/nph.16958 [DOI] [PubMed] [Google Scholar]
- Martre, P. , Porter, J. R. , Jamieson, P. D. , & Triboï, E. (2003). Modeling grain nitrogen accumulation and protein composition to understand the sink/source regulations of nitrogen remobilization for wheat. Plant Physiology, 133(4), 1959–1967. 10.1104/pp.103.030585 [DOI] [PMC free article] [PubMed] [Google Scholar]
- Medlyn, B. E. , Dreyer, E. , Ellsworth, D. , Forstreuter, M. , Harley, P. C. , Kirschbaum, M. U. F. , Le Roux, X. , Montpied, P. , Strassemeyer, J. , Walcroft, A. , Wang, K. , & Loustau, D. (2002). Temperature response of parameters of a biochemically based model of photosynthesis. II. A review of experimental data. Plant, Cell & Environment, 25(9), 1167–1179. 10.1046/j.1365-3040.2002.00891.x [DOI] [Google Scholar]
- Mercado, L. M. , Medlyn, B. E. , Huntingford, C. , Oliver, R. J. , Clark, D. B. , Sitch, S. , Zelazowski, P. , Kattge, J. , Harper, A. B. , & Cox, P. M. (2018). Large sensitivity in land carbon storage due to geographical and temporal variation in the thermal response of photosynthetic capacity. New Phytologist, 218(4), 1462–1477. 10.1111/nph.15100 [DOI] [PMC free article] [PubMed] [Google Scholar]
- Moore, C. E. , Meacham‐Hensold, K. , Lemonnier, P. , Slattery, R. A. , Benjamin, C. , Bernacchi, C. J. , Lawson, T. , & Cavanagh, A. P. (2021). The effect of increasing temperature on crop photosynthesis: From enzymes to ecosystems. Journal of Experimental Botany, 72(8), 2822–2844. 10.1093/jxb/erab090 [DOI] [PMC free article] [PubMed] [Google Scholar]
- Ouyang, W. , Struik, P. C. , Yin, X. , & Yang, J. (2017). Stomatal conductance, mesophyll conductance, and transpiration efficiency in relation to leaf anatomy in rice and wheat genotypes under drought. Journal of Experimental Botany, 68(18), 5191–5205. 10.1093/jxb/erx314 [DOI] [PMC free article] [PubMed] [Google Scholar]
- Peng, B. , Guan, K. , Tang, J. , Ainsworth, E. A. , Asseng, S. , Bernacchi, C. J. , Cooper, M. , Delucia, E. H. , Elliott, J. W. , Ewert, F. , Grant, R. F. , Gustafson, D. I. , Hammer, G. L. , Jin, Z. , Jones, J. W. , Kimm, H. , Lawrence, D. M. , Li, Y. , Lombardozzi, D. L. , … Zhou, W. (2020). Towards a multiscale crop modelling framework for climate change adaptation assessment. Nature Plants, 6(4), 338–348. 10.1038/s41477-020-0625-3 [DOI] [PubMed] [Google Scholar]
- Perdomo, J. A. , Capó‐Bauçà, S. , Carmo‐Silva, E. , & Galmés, J. (2017). Rubisco and rubisco activase play an important role in the biochemical limitations of photosynthesis in rice, wheat, and maize under high temperature and water deficit. Frontiers in Plant Science, 8, 490. 10.3389/fpls.2017.00490 [DOI] [PMC free article] [PubMed] [Google Scholar]
- Perkins‐Kirkpatrick, S. E. , & Lewis, S. C. (2020). Increasing trends in regional heatwaves. Nature Communications, 11(1), 1–8. 10.1038/s41467-020-16970-7 [DOI] [PMC free article] [PubMed] [Google Scholar]
- Piao, S. , Sitch, S. , Ciais, P. , Friedlingstein, P. , Peylin, P. , Wang, X. , Ahlström, A. , Anav, A. , Canadell, J. G. , Cong, N. , Huntingford, C. , Jung, M. , Levis, S. , Levy, P. E. , Li, J. , Lin, X. , Lomas, M. R. , Lu, M. , Luo, Y. , … Zeng, N. (2013). Evaluation of terrestrial carbon cycle models for their response to climate variability and to CO2 trends. Global Change Biology, 19(7), 2117–2132. 10.1111/gcb.12187 [DOI] [PubMed] [Google Scholar]
- Posch, B. C. , Kariyawasam, B. C. , Bramley, H. , Coast, O. , Richards, R. A. , Reynolds, M. P. , Trethowan, R. , & Atkin, O. K. (2019). Exploring high temperature responses of photosynthesis and respiration to improve heat tolerance in wheat. Journal of Experimental Botany, 70(19), 5051–5069. 10.1093/jxb/erz257 [DOI] [PubMed] [Google Scholar]
- Rogers, A. , Kumarathunge, D. P. , Lombardozzi, D. L. , Medlyn, B. E. , Serbin, S. P. , & Walker, A. P. (2020). Triose phosphate utilization limitation: An unnecessary complexity in terrestrial biosphere model representation of photosynthesis. New Phytologist, 230(1), 17–22. 10.1111/nph.17092 [DOI] [PubMed] [Google Scholar]
- Salvucci, M. E. , & Crafts‐Brandner, S. J. (2004). Inhibition of photosynthesis by heat stress: The activation state of rubisco as a limiting factor in photosynthesis. Physiologia Plantarum, 120(2), 179–186. 10.1111/j.0031-9317.2004.0173.x [DOI] [PubMed] [Google Scholar]
- Sharkey, T. D. (1985). Photosynthesis in intact leaves of C3 plants: Physics, physiology and rate limitations. The Botanical Review, 51(1), 53–105. 10.1007/BF02861058 [DOI] [Google Scholar]
- Slot, M. , Garcia, M. N. , & Winter, K. (2016). Temperature response of CO2 exchange in three tropical tree species. Functional Plant Biology, 43(5), 468–478. 10.1071/FP15320 [DOI] [PubMed] [Google Scholar]
- Smith, N. G. , & Dukes, J. S. (2013). Plant respiration and photosynthesis in global‐scale models: Incorporating acclimation to temperature and CO2 . Global Change Biology, 19(1), 45–63. 10.1111/j.1365-2486.2012.02797.x [DOI] [PubMed] [Google Scholar]
- Smith, N. G. , Malyshev, S. L. , Shevliakova, E. , Kattge, J. , & Dukes, J. S. (2016). Foliar temperature acclimation reduces simulated carbon sensitivity to climate. Nature Climate Change, 6(4), 407–411. 10.1038/nclimate2878 [DOI] [Google Scholar]
- Solomon, S. , Plattner, G. K. , Knutti, R. , & Friedlingstein, P. (2009). Irreversible climate change due to carbon dioxide emissions. Proceedings of the National Academy of Sciences, 106(6), 1704–1709. 10.1073/pnas.081272110 [DOI] [PMC free article] [PubMed] [Google Scholar]
- Tezara, W. M. V. J. , Mitchell, V. J. , Driscoll, S. D. , & Lawlor, D. W. (1999). Water stress inhibits plant photosynthesis by decreasing coupling factor and ATP. Nature, 401(6756), 914–917. 10.1038/44842 [DOI] [Google Scholar]
- von Caemmerer, S. , & Evans, J. R. (2015). Temperature responses of mesophyll conductance differ greatly between species. Plant, Cell & Environment, 38(4), 629–637. 10.1111/pce.12449 [DOI] [PubMed] [Google Scholar]
- von Caemmerer, S. , Farquhar, G. , & Berry, J. (2009). Biochemical model of C3 photosynthesis. In Laisk, A. , Nedbal, L. & Govindjee (Eds.), Photosynthesis in silico: Understanding complexity from molecules to ecosystems (pp. 209–230). Springer. 10.1007/978-1-4020-9237-4_9 [DOI] [Google Scholar]
- Wang, D. , Rianti, W. , Gálvez, F. , van der Putten, P. E. , Struik, P. C. , & Yin, X. (2022). Estimating photosynthetic parameter values of rice, wheat, maize and sorghum to enable smart crop cultivation. Crop and Environment, 1(2), 119–132. 10.1016/j.crope.2022.05.004 [DOI] [Google Scholar]
- Wang, X. , Vignjevic, M. , Liu, F. , Jacobsen, S. , Jiang, D. , & Wollenweber, B. (2015). Drought priming at vegetative growth stages improves tolerance to drought and heat stresses occurring during grain filling in spring wheat. Plant Growth Regulation, 75(3), 677–687. 10.1007/s10725-014-9969-x [DOI] [Google Scholar]
- Warren, C. R. (2008). Stand aside stomata, another actor deserves Centre stage: The forgotten role of the internal conductance to CO2 transfer. Journal of Experimental Botany, 59(7), 1475–1487. 10.1093/jxb/erm245 [DOI] [PubMed] [Google Scholar]
- Way, D. A. , & Yamori, W. (2014). Thermal acclimation of photosynthesis: On the importance of adjusting our definitions and accounting for thermal acclimation of respiration. Photosynthesis Research, 119(1), 89–100. 10.1007/s11120-013-9873-7 [DOI] [PubMed] [Google Scholar]
- Wei, Z. , Fang, L. , Li, X. , Liu, J. , & Liu, F. (2020). Effects of elevated atmospheric CO2 on leaf gas exchange response to progressive drought in barley and tomato plants with different endogenous ABA levels. Plant and Soil, 447(1), 431–446. 10.1007/s11104-019-04393-3 [DOI] [Google Scholar]
- Yamasaki, T. , Yamakawa, T. , Yamane, Y. , Koike, H. , Satoh, K. , & Katoh, S. (2002). Temperature acclimation of photosynthesis and related changes in photosystem II electron transport in winter wheat. Plant Physiology, 128(3), 1087–1097. 10.1104/pp.010919 [DOI] [PMC free article] [PubMed] [Google Scholar]
- Yamori, W. , Hikosaka, K. , & Way, D. A. (2014). Temperature response of photosynthesis in C3, C4, and CAM plants: Temperature acclimation and temperature adaptation. Photosynthesis Research, 119(1), 101–117. 10.1007/s11120-013-9874-6 [DOI] [PubMed] [Google Scholar]
- Yamori, W. , Noguchi, K. , Hanba, Y. T. , & Terashima, I. (2006). Effects of internal conductance on the temperature dependence of the photosynthetic rate in spinach leaves from contrasting growth temperatures. Plant and Cell Physiology, 47(8), 1069–1080. 10.1093/pcp/pcj077 [DOI] [PubMed] [Google Scholar]
- Yamori, W. , Noguchi, K. O. , & Terashima, I. (2005). Temperature acclimation of photosynthesis in spinach leaves: Analyses of photosynthetic components and temperature dependencies of photosynthetic partial reactions. Plant, Cell & Environment, 28(4), 536–547. 10.1111/j.1365-3040.2004.01299.x [DOI] [Google Scholar]
- Yang, J. T. , Preiser, A. L. , Li, Z. , Weise, S. E. , & Sharkey, T. D. (2016). Triose phosphate use limitation of photosynthesis: Short‐term and long‐term effects. Planta, 243(3), 687–698. 10.1007/s00425-015-2436-8 [DOI] [PubMed] [Google Scholar]
- Yin, X. (2013). Improving ecophysiological simulation models to predict the impact of elevated atmospheric CO2 concentration on crop productivity. Annals of Botany, 112(3), 465–475. 10.1093/aob/mct016 [DOI] [PMC free article] [PubMed] [Google Scholar]
- Yin, X. (2021). No need to switch the modified Arrhenius function back to the old form. New Phytologist, 231(6), 2113–2116. 10.1111/nph.17341 [DOI] [PMC free article] [PubMed] [Google Scholar]
- Yin, X. , Belay, D. W. , van der Putten, P. E. , & Struik, P. C. (2014). Accounting for the decrease of photosystem photochemical efficiency with increasing irradiance to estimate quantum yield of leaf photosynthesis. Photosynthesis Research, 122(3), 323–335. 10.1007/s11120-014-0030-8 [DOI] [PubMed] [Google Scholar]
- Yin, X. , Gu, J. , Dingkuhn, M. , & Struik, P. C. (2022). A model‐guided holistic review of exploiting natural variation of photosynthesis traits in crop improvement. Journal of Experimental Botany, 73(10), 3173–3188. 10.1093/jxb/erac109 [DOI] [PMC free article] [PubMed] [Google Scholar]
- Yin, X. , Schapendonk, A. H. , & Struik, P. C. (2019). Exploring the optimum nitrogen partitioning to predict the acclimation of C3 leaf photosynthesis to varying growth conditions. Journal of Experimental Botany, 70(9), 2435–2447. 10.1093/jxb/ery277 [DOI] [PMC free article] [PubMed] [Google Scholar]
- Yin, X. , & Struik, P. C. (2009). Theoretical reconsiderations when estimating the mesophyll conductance to CO2 diffusion in leaves of C3 plants by analysis of combined gas exchange and chlorophyll fluorescence measurements. Plant, Cell & Environment, 32(11), 1513–1524. 10.1111/j.1365-3040.2009.02016.x [DOI] [PubMed] [Google Scholar]
- Yin, X. , & Struik, P. C. (2017). Can increased leaf photosynthesis be converted into higher crop mass production? A simulation study for rice using the crop model GECROS. Journal of Experimental Botany, 68(9), 2345–2360. 10.1093/jxb/erx085 [DOI] [PMC free article] [PubMed] [Google Scholar]
- Yin, X. , Struik, P. C. , Romero, P. , Harbinson, J. , Evers, J. B. , Van Der Putten, P. E. , & Vos, J. A. N. (2009). Using combined measurements of gas exchange and chlorophyll fluorescence to estimate parameters of a biochemical C3 photosynthesis model: A critical appraisal and a new integrated approach applied to leaves in a wheat (Triticum aestivum) canopy. Plant, Cell & Environment, 32(5), 448–464. 10.1111/j.1365-3040.2009.01934.x [DOI] [PubMed] [Google Scholar]
- Yin, X. , Van Der Putten, P. E. , Driever, S. M. , & Struik, P. C. (2016). Temperature response of bundle‐sheath conductance in maize leaves. Journal of Experimental Botany, 67(9), 2699–2714. 10.1093/jxb/erw104 [DOI] [PMC free article] [PubMed] [Google Scholar]
- Yin, X. , & van Laar, H. H. (2005). Crop systems dynamics: An ecophysiological simulation model of genotype‐by‐environment interactions. Wageningen Academic Publishers. https://edepot.wur.nl/139772 [Google Scholar]
- Zivcak, M. , Brestic, M. , Balatova, Z. , Drevenakova, P. , Olsovska, K. , Kalaji, H. M. , Yang, X. , & Allakhverdiev, S. I. (2013). Photosynthetic electron transport and specific photoprotective responses in wheat leaves under drought stress. Photosynthesis Research, 117(1), 529–546. 10.1007/s11120-013-9885-3 [DOI] [PubMed] [Google Scholar]
Associated Data
This section collects any data citations, data availability statements, or supplementary materials included in this article.
Supplementary Materials
Appendix S1
Data Availability Statement
The data that support the findings of this study are openly available in 4TU.ResearchData at http://doi.org/10.4121/21304917.