

Abstract
Purpose of review:
Heart failure results in the high incidence and mortality all over the world. Mechanical properties of myocardium are critical determinants of cardiac function, with regional variations in myocardial contractility demonstrated within infarcted ventricles. Quantitative assessment of cardiac contractile function is therefore critical to identify myocardial infarction for the early diagnosis and therapeutic intervention.
Recent findings:
Current advancement of cardiac functional assessments is in pace with the development of imaging techniques. The methods tailored to advanced imaging have been widely used in cardiac magnetic resonance, echocardiography, and optical microscopy. In this review, we introduce fundamental concepts and applications of representative methods for each imaging modality used in both fundamental research and clinical investigations. All these methods have been designed or developed to quantify time-dependent 2-dimensional (2D) or 3D cardiac mechanics, holding great potential to unravel global or regional myocardial deformation and contractile function from end-systole to end-diastole.
Summary:
Computational methods to assess cardiac contractile function provide a quantitative insight into the analysis of myocardial mechanics during cardiac development, injury, and remodeling.
Keywords: heart failure, cardiac contractile function, biomedical imaging, computational analysis
Introduction
Heart failure leads to alarmingly high levels of morbidity and mortality worldwide and is considered the global health priority [1]–[3]. Over 26 million patients suffer from heart failure worldwide [4], [5], with an addition of nearly 550,000 cases per year in the United States [5], [6]. Myocardial infarction remains the most common cause of heart failure, resulting in impaired myocardial structure and contractile dysfunction [6]. Despite continued efforts to uncover the underlying mechanism of cardiac injury, numerous issues in cardiac structure and function are yet to be investigated. Myocardial mechanical properties are critical determinants of cardiac function, playing a vital role in understanding the heart formation, development, injury, and remodeling. For this reason, improved understanding of myocardial mechanics enables to provide a biomechanical blueprint for cardiac contractile function and facilitate new strategies for restoring function to the injured heart.
Non-invasive imaging technique is an indispensable tool to investigate the 4-dimensional (4D, 3D spatial + 1D temporal) cardiac dynamics over the course of time, allowing us to assess in vivo cardiac architecture and contractility with regards to myocardial dysfunction. With numerous imaging methods implemented, two metrics are widely used to assess the cardiac contractile function: ejection fraction as a global index, and strain or strain rate as a regional measure [7], [8]. Generally, ejection fraction indicates the percentage of blood flow leaving from the ventricle with each heartbeat [9], [10], providing a global value of ventricular volume change. In contrast, strain and strain rate mostly focus on time-dependent 2D local myocardial deformation, advantageous for early identification of cardiac dysfunction [10], [11]. Both ejection fraction and strain are dimensionless quantities reflecting the contractile change of myocardial deformation, while strain rate indicates the rate of this change and represents instantaneous force-velocity-length relations that can be used to define the local contractile state [12], [13].
Myocardial contraction and relaxation can be decomposed into three directions in Euclidean coordinates, that is, longitudinal, circumferential, and radial directions, respectively [10], [14] (Figure 1). In this context, strain analysis demonstrates base-apex shortening, transmural thickening, and circumferential stretching [14]. The ability to analyze myocardial deformation in a specific region of interest (ROI) enables us to quantify local cardiac contractility, providing an entry point to interrogate the myocardial contraction and relaxation in response to functional abnormalities within multiple cardiac cycles.
Figure 1.
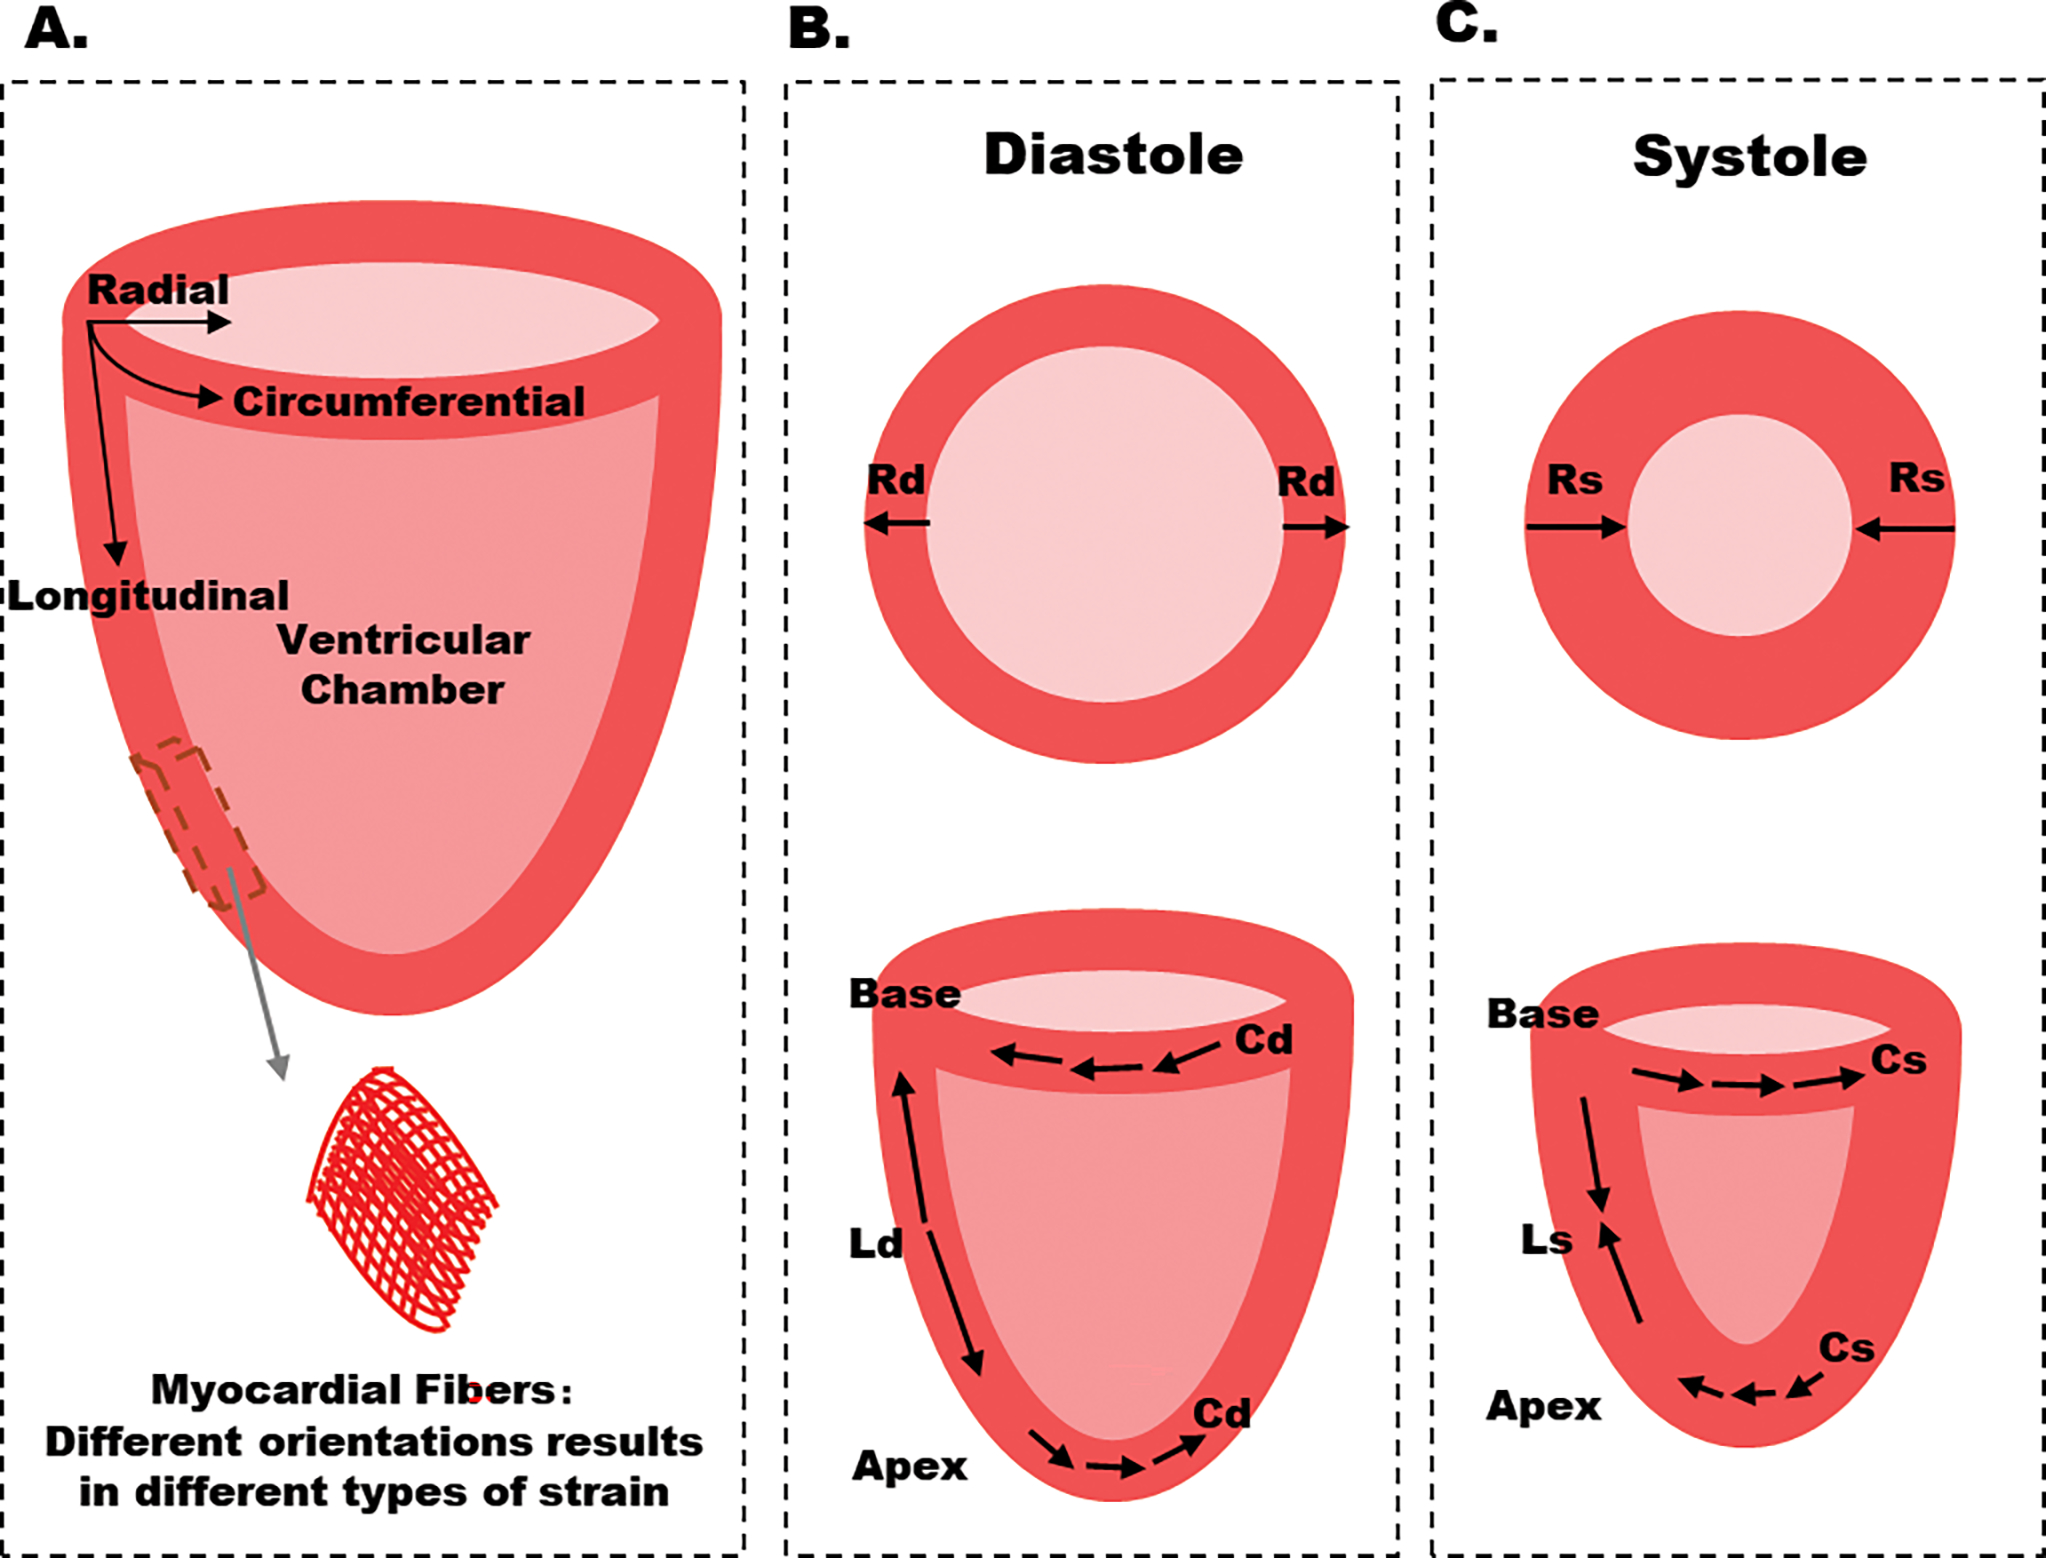
Schematic diagram of myocardial strain. A. Three types of strain are defined along longitudinal, circumferential, and radial, respectively. B-C. Circumferential and radial strains are obtained from short-axis sections, whereas longitudinal strain is obtained from long-axis sections. Cd: circumferential strain in diastole, Cs: circumferential strain in systole, Ld: longitudinal strain in diastole, Ls: longitudinal strain in systole, Rd: radial strain in diastole, Rs: radial strain in systole. In the long-axis plane, the longitudinal deformation corresponds to apex-base shortening / lengthening. In the short-axis plane, circumferential strain is tangential to the epicardial wall (oriented along the perimeter), and radial strain is oriented toward the center of the ventricular cavity. Ventricular sections close to the apex have a counterclockwise systolic rotation, whereas sections close to the base have a clockwise rotation.
While computed tomography (CT) and positron emission tomography (PET) are increasingly important in evaluation of cardiac contractility [15], [16], we focus on other widely-used methods tailored to contractile analysis. In this review, we summarize the representative methods along with cardiac magnetic resonance (CMR), echocardiography, and optical microscopy to assess myocardial contractility for both fundamental research and clinical investigations. These methods include but not limit to CMR tagging, tissue doppler imaging (TDI), speckle-tracking echocardiography (STE), and displacement analysis of myocardial mechanical deformation (DIAMOND) in light-sheet fluorescence microscopy.
1. Myocardial analysis based on cardiac magnetic resonance
Cardiac magnetic resonance (CMR) is one of the primary imaging modalities used to assess myocardial deformation and displacement in both fundamental research and clinical settings. The representative approaches of cardiac analysis include spatial modulation of magnetization (SPAMM), strain encoded (SENC) magnetic resonance imaging, displacement encoding with stimulated echoes (DENSE), harmonic phase (HARP), and Sine-Wave Modeling (SinMod).
Tagging is a method to create non-invasive markers in CMR images by implementing a selective radiofrequency (RF) pulse sequence to spatially perturb the longitudinal magnetization prior to the acquisition [17]–[19]. The alternating bright and dark patterns on the image produced by varying RF pulses are tag lines, and will be deformed when the myocardium contracts and relaxes (Figure 2A) [7], [19]. At the beginning of the cardiac cycle, tag lines in images are parallel and equispaced. In the frequency domain, corresponding spectral peaks are represented as harmonic frequencies, becoming wider following the tissue contraction. Unlike invasive methods such as implanted radiopaque markers and ultrasound crystals, CMR tagging is non-invasive and highly reproducible to quantify the regional myocardial deformation, allowing us to track myocardial motion in response to cardiac dysfunction at high spatial resolution [19]–[21].
Figure 2.
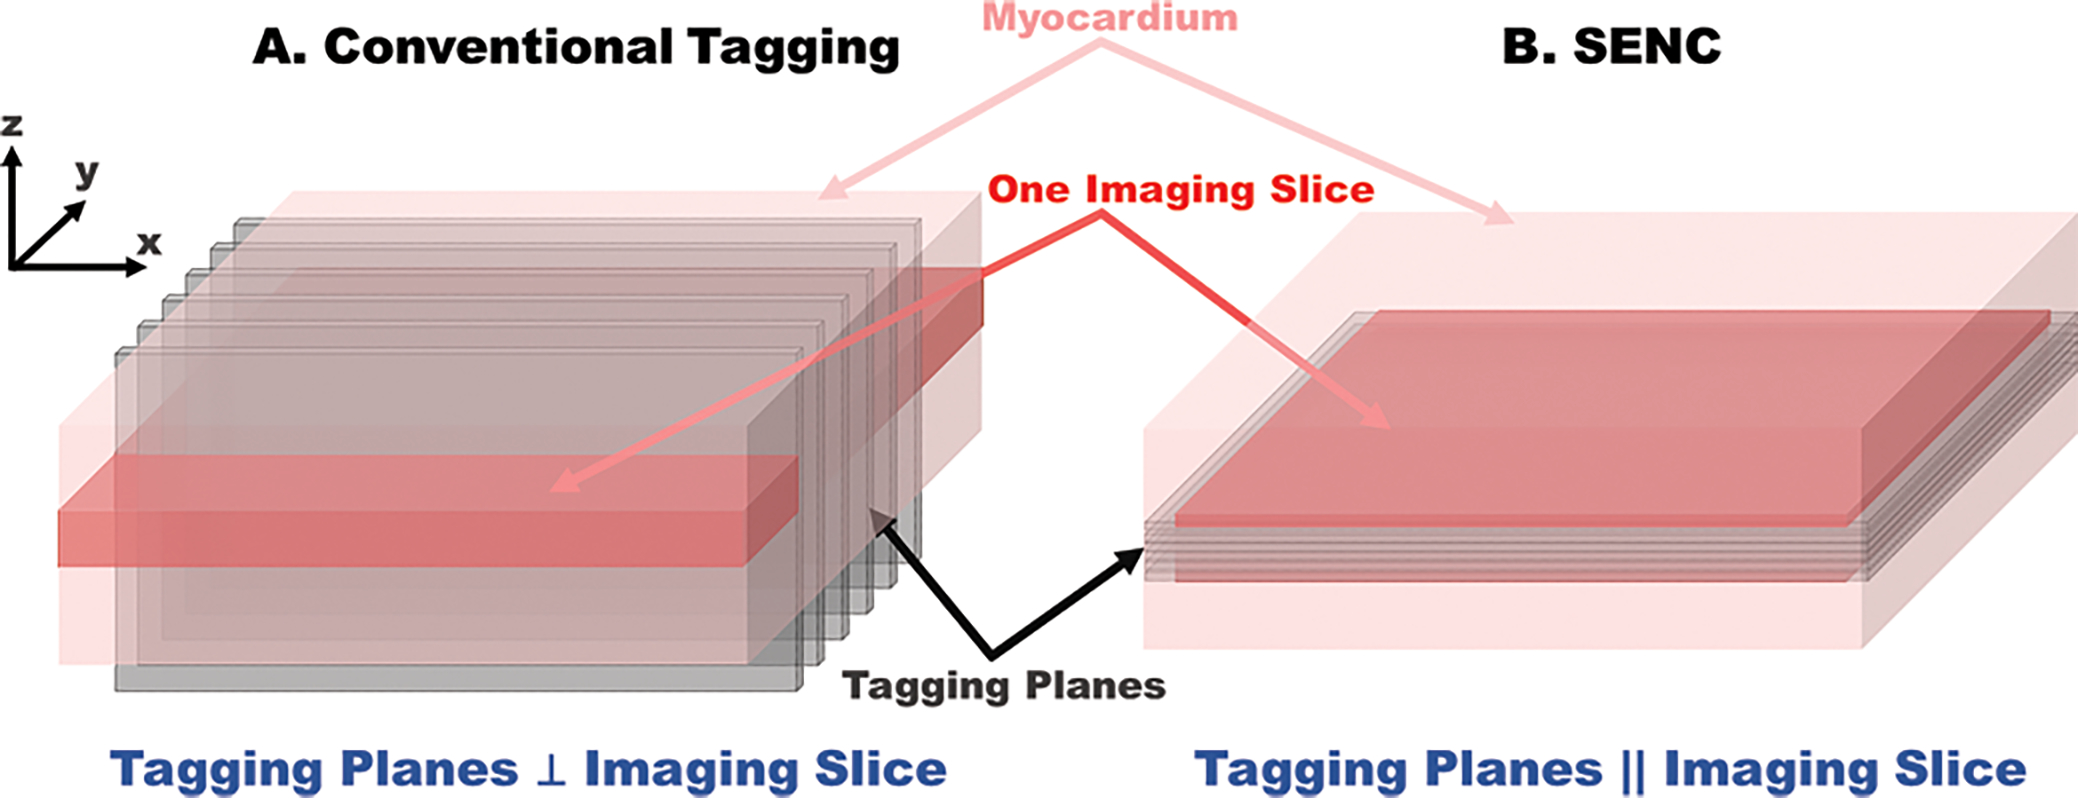
A. Implemented tagging lines are orthogonal to the imaging slice in conventional CMR tagging methods. B. In contrast, the tag planes generated in SENC are parallel to and inside the imaging slice, to record through-plane strain.
One of representative techniques developed to acquire tagged CMR images is spatial modulation of magnetization. It was developed to generate sinusoidal tag patterns and create a 2D grid of sharp intrinsic myocardial markers [22]. However, tagging lines fade toward the end of the cardiac cycle, leading to an unrecognizable tagging pattern. For this reason, complementary SPAMM (CSPAMM) was developed to persist longer net tagging lines while suppressing untagged blood [23].
Another technique to assess cardiac contractility is displacement encoding with stimulated echoes [9]. It encodes the displacement of the tissue into the phase of the magnetization vector. DENSE uses stimulated echo acquisition mode pulse sequence to extract cardiac motion at high spatial density over segments of an entire cardiac cycle [24]. A stimulated echo with a bipolar gradient is introduced to encode myocardial displacement. The phase of the MR signal is modulated and demodulated using the stimulated echo pulse by the gradients being applied between the first two RF pulses and the one after the third RF pulse. The displacements occurring during the mixing time, the time duration between the second and third RF pulses, are recorded in the phase of a stimulated echo image, indicating the phase of DENSE images is proportional to the myocardial displacement (Table 1) [7], [19]. While the low signal-to-noise ratio (SNR) of the DENSE method is attributed to the 50% signal loss inherent to stimulated echoes, it has been improved by a single-averaged DENSE technique in combination with an uncorrelated noise from CSPAMM image during image reconstruction [7], [25]. In addition, Cine DENSE imaging sequence that trade SNR for temporal resolution is designed to track elements of myocardium through time as they move through the cardiac cycle [26].
Table 1:
Advantages and Disadvantages of CMR Tagging Methods.
| CMR Tagging | Working Principle | Advantages | Disadvantages |
|---|---|---|---|
|
| |||
| SPAMM | Use RF-saturation pulses to place stripes or grids on the heart to follow its motion during the cardiac cycle. | • Low SAR (specific absorption rate) • Available for clinical applications |
• Moderate resolution • 2-D only • Tag fading |
| DENSE | Encode tissue displacement into the phase of an image. | • Rapid acquisition • Better myocardium identification |
• Low SNR (signal-to-noise ratio) • Modest clinical experience |
| SENC | Implement magnetization tags parallel to the image plane combined with out-of-plane phase-encoding gradients. | • High resolution • Simple processing • Intuitive view |
• Tag fading • Modest clinical experience • Radial strain non-measurable |
Legend: SPAMM, spatial modulation of magnetization; DENSE, displacement encoded with stimulated echoes; SENC, strain encoded. Adapted from [19].
Similar to SPAMM and DENSE, strain-encoded magnetic resonance imaging is also based on applying parallel planes of saturated magnetization that are used as virtual markers to track cardiac motion. However, in contrast to conventional tagging where the saturated magnetization planes are applied perpendicular to the imaging plane and thus appear as dark stripes in the imaged slice, SENC applies the tagging planes parallel to (and therefore lie inside) the imaged slice, similar to pages of a book (Figure 2B). Through-plane motion results in varying stripes during the contraction or relaxation, leading to the higher or lower tagging frequency. Therefore, SENC has the capability to directly encode the regional strain into the acquired image without measuring the displacement. Longitudinal and circumferential strains are respectively measured from short-axis and long-axis images. The integration of DENSE and SENC was also developed to obtain a 3D strain map in a single layer of the myocardium at the high spatial resolution [7], [27].
Following the tagged images, motion estimation strategies based on the image intensity, or the k-space were developed to track myocardial contraction and relaxation. One way to track the deformed tagging is tracing the varying intensity and brightness by using active contour models [28]–[30], optical flow techniques [31]–[33], finite element modeling [34], [35], and volumetric modeling [36]–[38] to reflect myocardial contraction. The other way is analyzing the k-space frequency for the identification and extraction of the harmonic spectral peaks, including Harmonic-Phase (HARP) [39]–[41] and Sinusoidal-Modeling (SinMod) analysis [42]–[44]. We focus on the latter methods for its faster and more automatic analysis of myocardial motion [19].
HARP implements SPAMM tags to produce a sequence of spectral peaks in the k-space to extract myocardial contraction and relaxation [39]–[41]. Each spectral peak carries a specific frequency extracted by phase demodulation methods to reflect the cardiac contractile function. The underlying principle of HARP is to extract the signal peak at the first harmonic frequency, consisting of the tagging information. Harmonic magnitude and phase images are then multiplied to generate a HARP image in the frequency domain. To analyze HARP image, we need to consider its two properties. One is that the phase relates to the material property, that is, the harmonic phase of a specific spot is time invariant. Another property is that the slope of the harmonic phase is linearly related to the compression and elongation of the heart muscle, i.e., myocardial strain. Benefiting from the simplicity and performance, HARP is one of the most common approaches.
The SinMod technique is a frequency-based method to extract myocardial motion from the tagged images based on sinusoidal approximation. In SinMod, the intensity distribution is modeled as a summation of sinusoidal wavefronts, depicting the motion of the myocardium. The environment of each pixel in the image is characterized as a sine wave with local frequency and amplitude. Without utilizing phase data from surrounding pixels, a displacement estimation is provided by the local quotient of the phase difference and the mean frequency at each pixel of two consecutive images. In addition, an objective criterion is constructed for each pixel to reflect the local quality of the sinusoidal model as a descriptor of the available image data [42]. Despite the acceptable agreement of the strain and torsion patterns by HARP and SinMod, the latter could reduce the phase aliasing and sensitivity to noise at the cost of systematical overestimation of measurements compared to HARP [45].
2. Evaluating myocardial deformation using echocardiography
While CMR imaging plays an indispensable role in the assessment of cardiac contraction and relaxation, the low temporal resolution remains a bottleneck in CMR image formation and subsequent analysis. In contrast, echocardiography addresses this issue and allows for the rapid acquisition of multiple cardiac phases within one cardiac cycle. Among them, tissue doppler imaging (TDI) and speckle tracking echocardiography (STE) are representative methods. We have summarized the development of the aforementioned methods in Figure 3.
Figure 3.
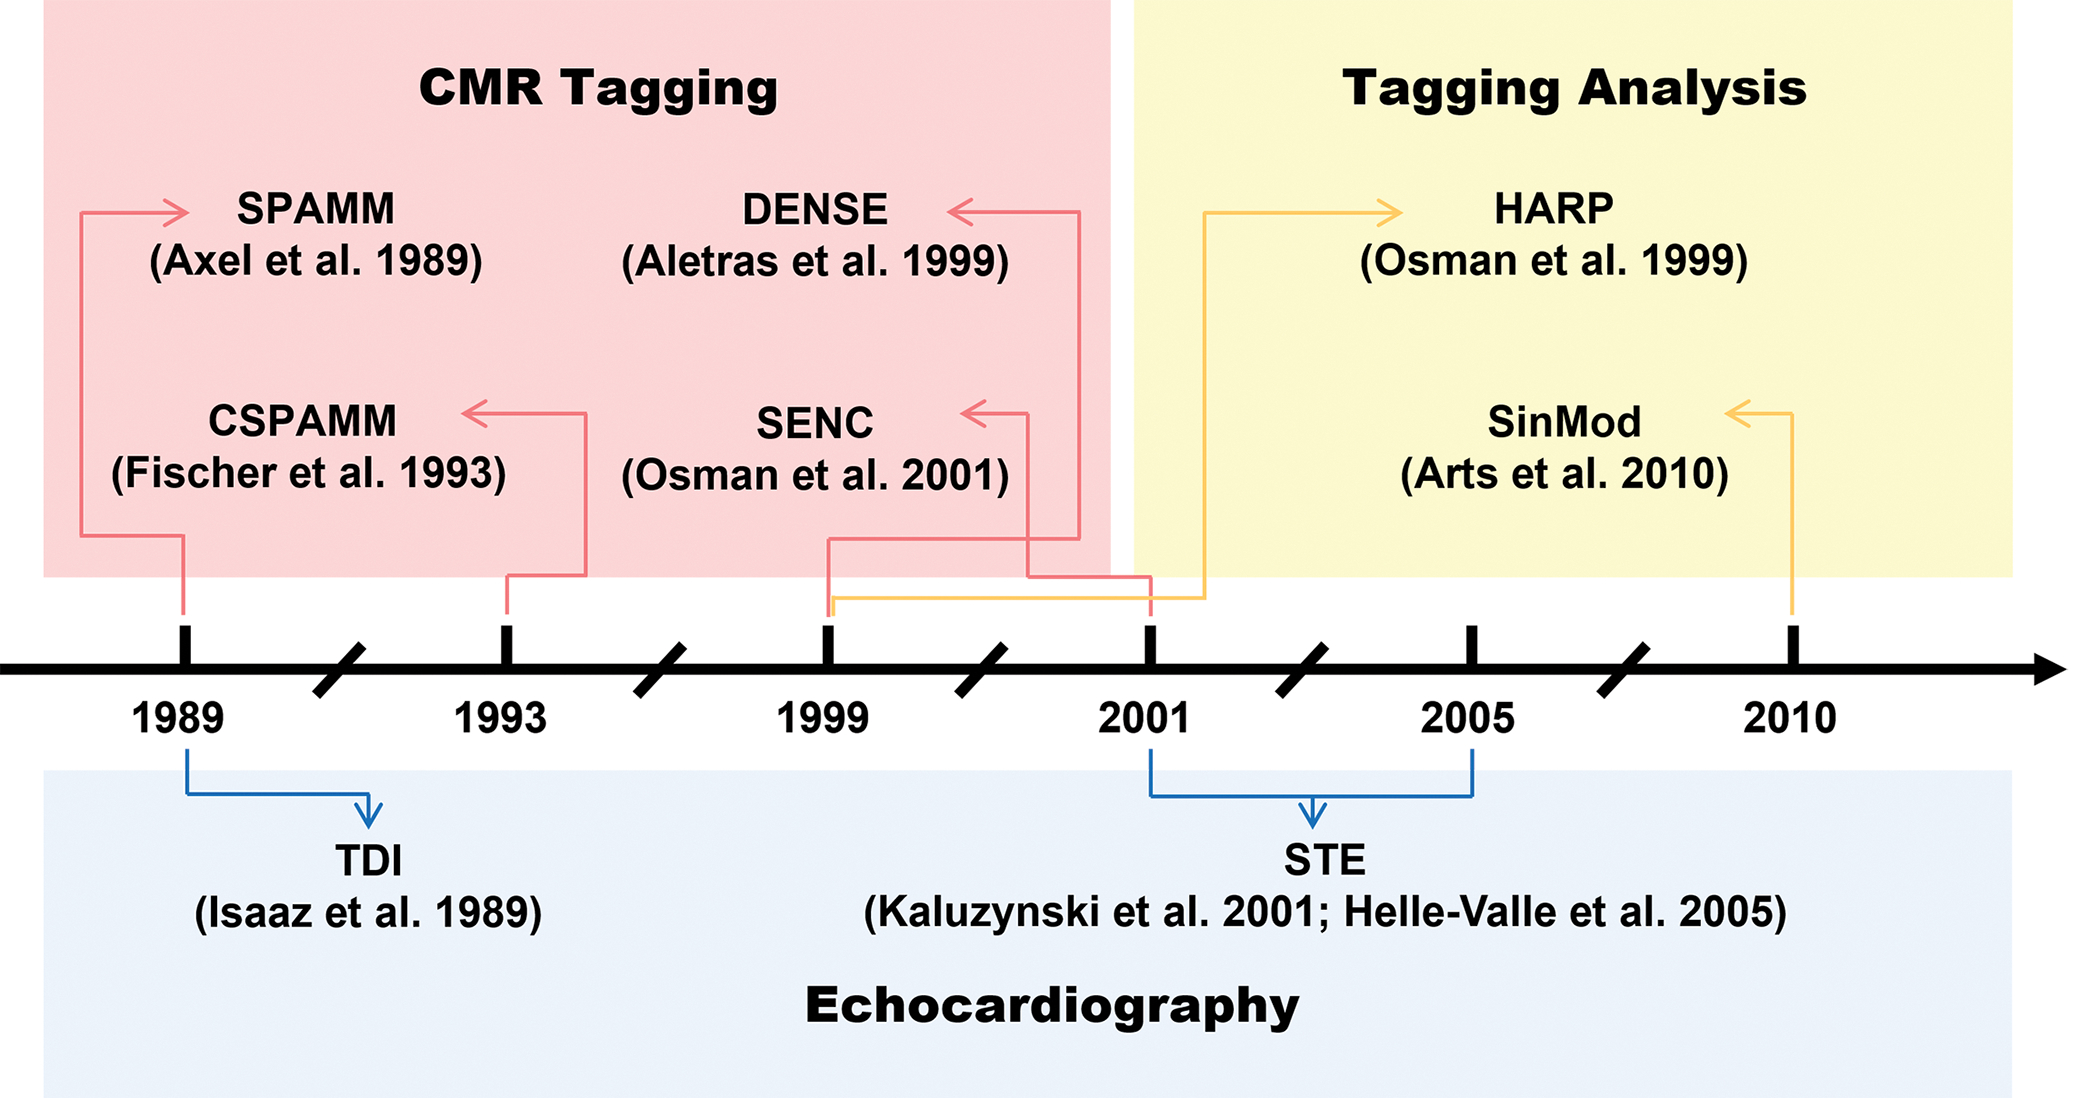
The advent of methods for cardiac magnetic resonance and echocardiography. Adapted from references: [19], [42], [47], [111], [112].
TDI is introduced to measure the Doppler effect of ultrasound signals reflected from the contracting myocardium. This method allows us to assess cardiac contractility during multiple cycles in both fundamental research and clinical investigations [46], [47]. The fundamental imaging mechanism of TDI determines higher amplitude and lower frequency signals generated by myocardial contraction in comparison to those from blood blow. In this context, both pulsed-wave TDI (PW-TDI) and color-coded TDI (C-TDI) are widely used [48].
PW-TDI is based on spectral analysis of the reflected ultrasound signals, providing information about the range of myocardial velocities encountered at the investigated region. It is used to measure peak myocardial velocities and is particularly well suited to the measurement of long-axis ventricular motion as the longitudinally oriented endocardial fibers are most parallel to the ultrasound beam in the apical views. PW-TDI offers a high level of temporal resolution (3~4 ms) [49] and can therefore be used to analyze the temporal relationship between myocardium systolic and diastolic velocity waves. However, PW-TDI is limited to image a single myocardial segment at a time.
Similar to PW-TDI, C-TDI also utilizes intermittent sampling of ultrasound, but it allows the visualization of different cardiac segments from a single view. C-TDI calculates multipoint color-coded blood flow velocities along a succession of ultrasonic scan lines inside a 2D sector using an autocorrelation algorithm, and generate superimposed color-coded blood flow velocity images, similar to color flow Doppler [50], [51]. Because C-TDI measures mean values rather than peak systolic and diastolic velocities, myocardial velocities obtained using C-DTI are generally 20% lower in systole and diastole compared to PW-TDI. The ability of C-TDI to collect full sector image data of various ventricle segments significantly reduces the scanning time in comparison with PW-TDI, resulting in the combination of high temporal resolution with a high spatial resolution. However, C-TDI results highly depends on the image quality, leading to the poor reproducibility [52], [53].
While TDI enables us to characterize 2D myocardial displacement, strain, and strain rate throughout the cardiac cycle, this kind of methods only uncovers the myocardial deformation along the direction of ultrasound waves (Figure 4A). Thus, the angle dependency limits its application of 3D contractile analysis [54]. In addition, due to Doppler effect, TDI is highly susceptible to noise arising from the blood pool, aliasing, and reverberation [55].
Figure 4.
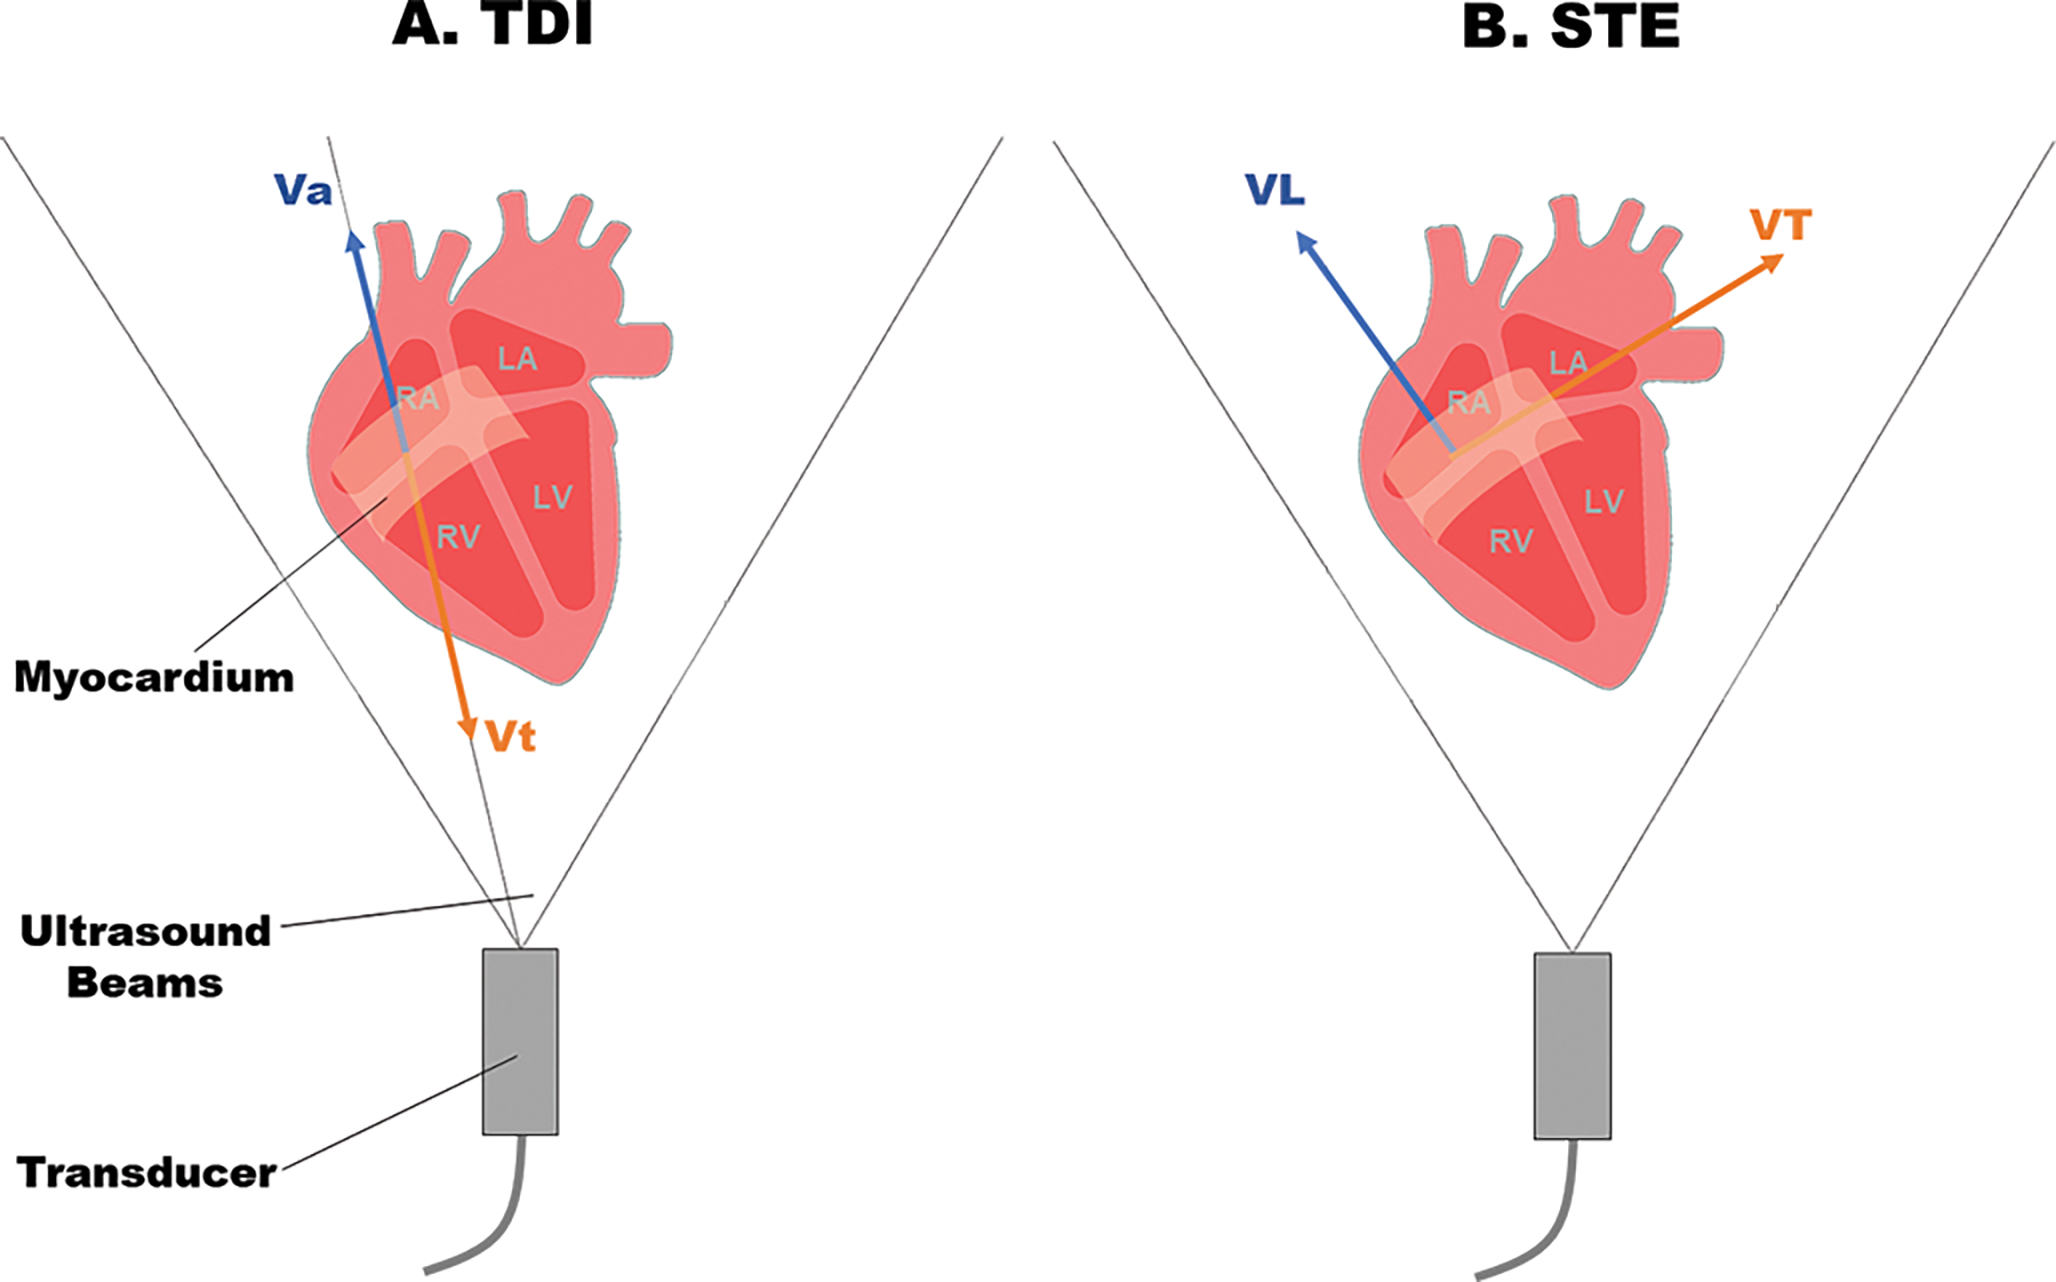
A. Auto-correlation-based tissue Doppler imaging (TDI). B. Cross-correlation based 2D speckle tracking (STE). Vt: Velocity towards the transducer. Va: velocity away from the transducer. VL: Longitudinal velocity along the myocardial contraction. VT: Transverse velocity perpendicular to myocardial contraction.
To address the issue of Doppler effect in TDI, STE is developed to offer an alternative approach to measure myocardial strain and strain rate. STE is a quantitative echocardiography used for evaluating myocardial deformation through analysis of the motion of speckles [56], [57]. In an ultrasonic 2D image, speckles are generated at random due to reflections, refraction, and scattering of ultrasound beams with myocardial fibers [54]. Speckle tracking provides non-Doppler, angle-independent, and objective quantification of myocardial deformation and ventricular systolic and diastolic dynamics. The idea of STE is to track the displacement of the speckles during the cardiac cycle, and therefore the regional myocardial deformation can be assessed using strain and the strain rate. Different from TDI, STE is angle independent of the ultrasound beam and tracks the displacements in 2D (Figure 4B) [58].
Several methods such as block matching [59], optical flow [60], feature tracking [61], level sets [62], and elastic registration [63] are used for assessing the shift of speckles in 2D ultrasound images. The two commonly used methods for speckle tracking are block matching and optical flow. The idea of block matching is to select a region in one frame, matching it with the patterns in adjacent positions in the subsequent frames based on similarity comparison. In contrast, the assumption of optical flow is that the gray value variation in a particular pixel can only be attributed to location movement, thus it tracks the frame-by-frame displacement of the spots with a specific grayscale. For this reason, regional myocardial motion can be extracted from the geometric displacement of speckles [58], and the velocity is calculated from the displacement of each speckle divided by the time between successive frames. Similarly, strain and strain rate can be determined by the relative shift of speckles at a given time range in the ROI.
3. Optical imaging and analyzation of cardiac functions
While CMR and echocardiography are established to extract anatomical architecture and cardiac contractile function, parallel advances in optical imaging along with computational methods led to better spatiotemporal resolution, higher image contrast, and specific fluorescence labeling in fundamental research. The usage of optical imaging methods on animal models provides an entry point to investigate cardiac structure and contractility at molecular and cellular scales, enabling to unravel the underlying mechanism of cardiac development, injury, and regeneration [64]. Besides non-invasive visualization and analysis, researchers also used the pulsed laser illumination on graphene-treated zebrafish to manipulate the heart contraction and assess the output [65], [66].
Light-sheet microscopy (LSM) [67], [68], and light-field microscopy (LFM) [69] are emerging methods to capture 4D biomechanical and biophysical dynamics. The basic principle of LSM is to decouple the laser illumination and fluorescence detection, generating orthogonal illumination and detection to enable optical sectioning in a sample (Figure 5A). The laser is reshaped as a virtual blade to excite the sample placed at the intersection of the illumination and the detection axes, and the emitted fluorescence is collected by the detection optics and array sensors. LSM provides high spatial and temporal resolution, high SNR and minimal photobleaching, otherwise challenging with the existing microscopes. In the meanwhile, LFM has become the technique of choice for instantaneous volumetric imaging [70]–[74]. It permits the acquisition of transient 3D signals via postprocessing of the light-field information recorded by single 2D camera snapshots. Due to the high spatiotemporal resolution, these new methods advanced our knowledge of regional variations in myocardial contractility, allowing us to investigate the heterogeneity of injury response across the entire heart [75], [76].
Figure 5.
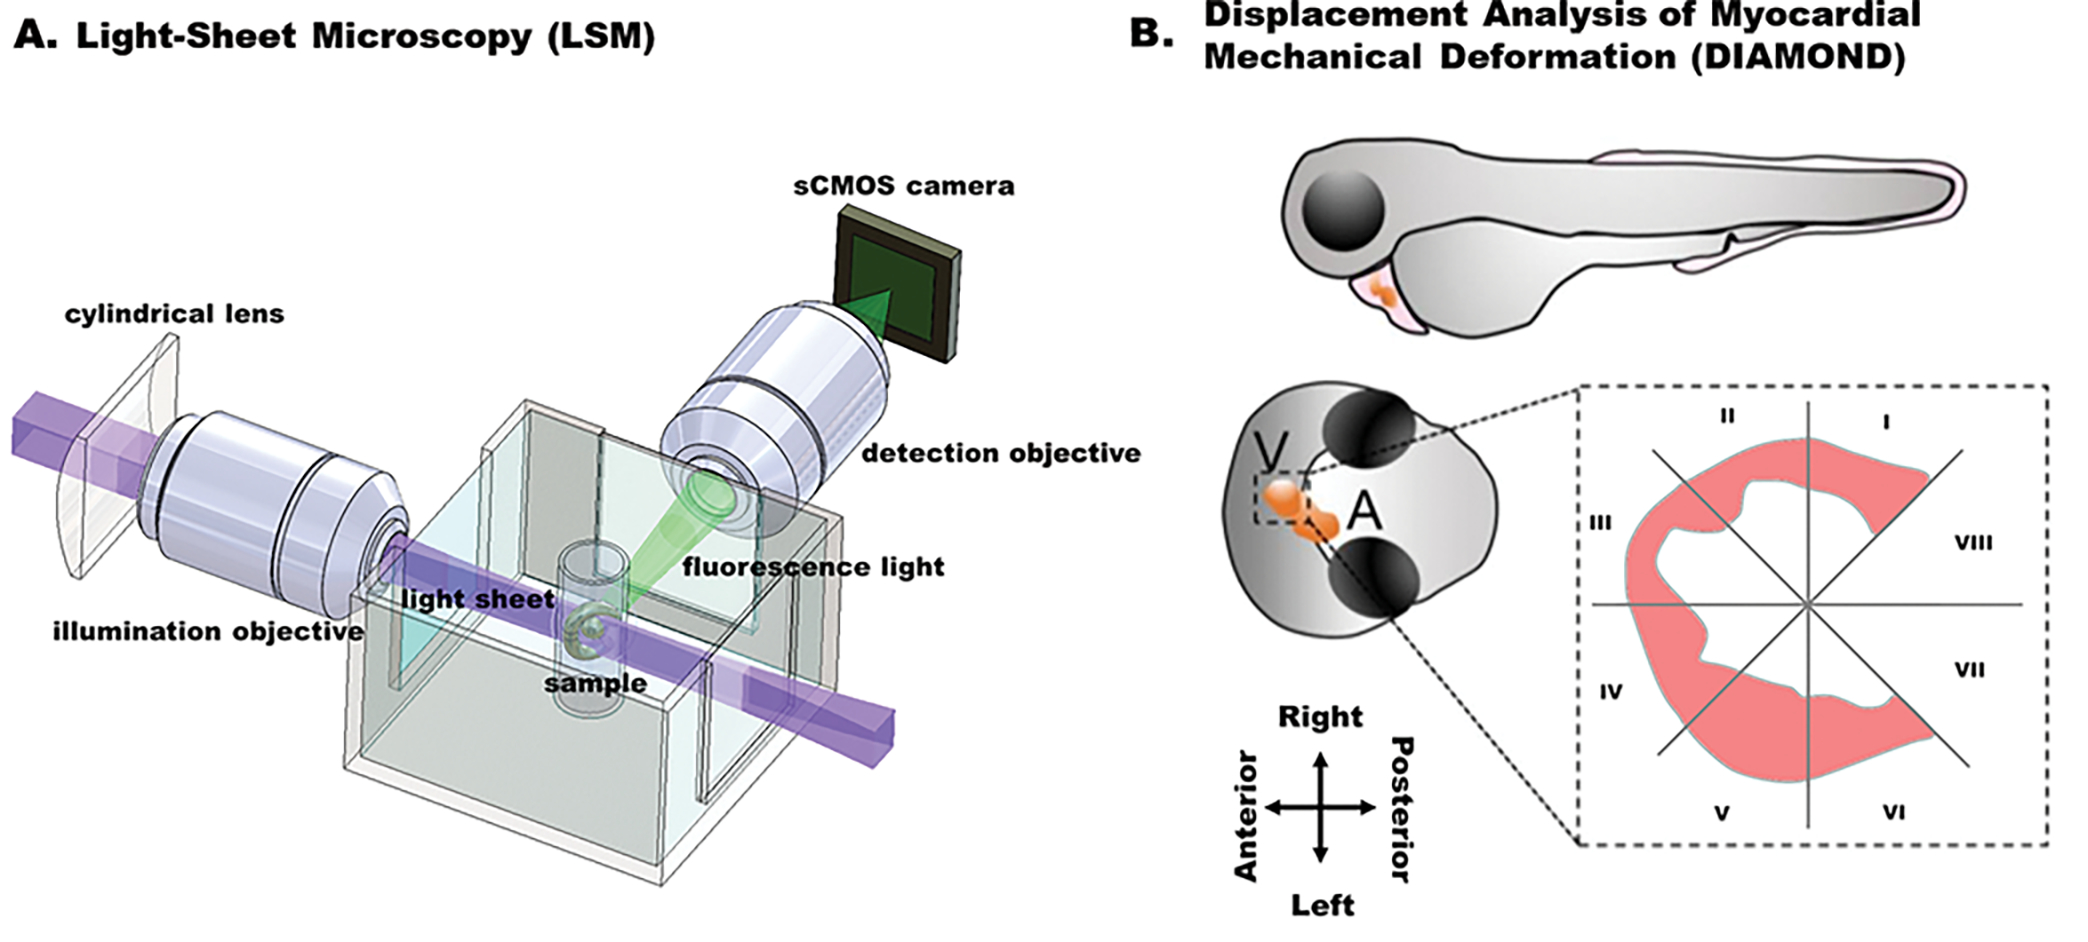
A. Fundamental concept of the light-sheet imaging strategy. B. Displacement analysis of focal myocardial mechanical deformation (DIAMOND) in zebrafish embryos. (Adapted with permission from: Chen et al. [77].)
The custom-built light-sheet microscope is able to capture the 4D contraction and relaxation within multiple cardiac cycles in the zebrafish embryo from 3 days post fertilization (dpf) to 7 dpf, providing the basis to interrogate the 4D local myocardial displacement and strain. The first method tailored to light-sheet microscopy is displacement analysis of myocardial mechanical deformation (DIAMOND) [77]. This semi-automated method allows us to track the regional myocardial displacement from end-systole to end-diastole, and further to assess the regional susceptibility in response to chemotherapy-induced injury. Different from ejection fraction and strain analysis, DIAMOND is able to track the 3D trajectory of mass centroid of each segment of myocardium throughout the whole cardiac cycle and quantify the local displacement of each segment. The ventricle along the short axis is divided into 8 equal segments constituted by even angles according to the intersection of a virtual division line (spanning from the atrium to the ventricle with the center of the endocardial ventricular cavity (Figure 5B). The most basal segments (VII and VIII) were removed from further analyses, given they are immediately adjacent to the atrioventricular valve and thus contain less myocardium compared with the other segments (I–VI) and thereby constitute incomplete myocardial segmental territories. DIAMOND allows us to correlate the focal cardiac mechanics with the local contractility in a live organism, establishing a framework to characterize the contribution of specific pluripotent cells to chemotherapy-induced cardiac injury and regeneration.
Recently, an integrated system including both LSM and LFM has been reported to investigate myocardial contraction and intracardiac blood flow [76]. Along with the contracting myocardium, time-dependent blood flow is also concurrently traced. This method further enhances the resolution of displacement tracing to single voxel level in comparison to the mass centroid in DIAMOND, providing higher spatial and temporal resolution to assess the structure and contractile function in a contracting heart [77]. These two customized methods, derived from deformable image registration [78]–[80], shed the light on the assessment of myocardial function by tracking the displacement of individual cardiomyocytes. The advancement of these methods further provides the possibility to investigate excitation-contraction coupling across the whole heart at the single cell level, following the integration of optical mapping methods [81]. In this case, calcium transients and mechanical contraction are able to be concurrently captured and analyzed with high spatiotemporal resolution.
In addition, optical coherence tomography (OCT) [82]–[84] and photoacoustic tomography (PAT) [85] have been reported to study cardiac morphogenesis and myocardial infarction. In comparison to other optical methods, both OCT and PAT are able to noninvasively image deep inside the heart over millimeters at the microscale resolution [86], [87], and therefore they have been used in mouse models for the in vivo study of cardiac structure and function. OCT is an imaging modality that uses near-infrared light and low-coherence interferometry, ideal for observing fine cardiac structures. Along with the structural imaging, Doppler OCT is developed to study the localized cardiac dynamics in the mouse tubular embryonic heart. It helps to understand the relation between the volumetric blood flow and the local pressure gradient produced by heart wall movements in terms of flow resistance within the beating heart.
PAT is an emerging method combining photon absorption and ultrasonic detection to maximize the imaging depth (~7 cm in vivo) [88]. This technique has advanced the visualization of cardiac structure at both microscopic and macroscopic levels. For example, a hemispherical PAT system was reported to non-invasively characterize the myocardial infarction [85]. Hemispherical PAT was featured as is capable of organ imaging and lesion region differentiation, enabling non-invasive diagnosis of MI and long-term monitoring. In addition to high image contrast, fine spatial resolution, and adequate tissue penetration, PAT is also able to reflect functional and metabolic changes stemming from hemodynamic information.
Although the specialized quantitative analysis of myocardial mechanics tailored to OCT or PAT remains to be defined, several tools such as PyJAMAS [89] and 3DeeCellTracker [90] have been reported for the motion tracking tailor to optical methods. PyJAMAS is an open-source Python application that combines classical segmentation methods with machine learning techniques to analyze biological images. It is available through a cross-platform graphical user interface or an application programming interface (API). By using the watershed region growing algorithm [91], [92] combined with particle image velocimetry, PyJAMAS can perform automatic cell segmentation and tracking in time or space. On the other hand, 3DeeCellTracker is developed to segment and track cells and extract their dynamic positions / activities for 4D datasets. Using deep learning techniques such as 3D U-Net and feedforward network, 3DeeCellTracker allows us to analyze various types of images captured by optical microscope systems. Specifically, it has been successfully used to track cardiomyocytes in the naturally beating heart of zebrafish embryo under the LSM [90], demonstrating the great potential for the computational analysis of cardiac contractile function.
Conclusion
Myocardial mechanical properties and regional variations in myocardial contractility are critical indicators of cardiac function [93], [94]. Accordingly, we reviewed the representative methods based on different non-invasive imaging modalities to assess myocardial deformation, contraction, and relaxation. From bench to bedside, CMR, echocardiography, and optical imaging methods equipped with the specific RF sequence or post-processing computation have been developed to assess cardiac dysfunction, facilitating diagnosis and fundamental research. We have summarized the advantages and disadvantages of numerous methods from the imaging and post-processing perspectives, providing a new insight into the computational analysis of cardiac contractile function.
CMR-based methods and echocardiography are currently widely used for clinical investigations of myocardial deformation due to their great penetration depth. Recent developments are notable for their use in cardio-oncology, which seeks to provide pre-treatment risk stratification, surveillance, diagnosis, and assessment of cardiotoxicity during chemotherapy and radiotherapy, especially in patients undergoing anthracyclines and/or human epidermal growth factor receptor 2-targeted treatment [95], [96]. While left ventricular ejection fraction is still the most widespread biomarker used for surveillance, myocardial strain has been considered a more sensitive imaging biomarker to enable earlier diagnosis and treatment [97]. Global longitudinal strain through STE has been suggested by several guidelines for inclusion into echocardiographic surveillance for cancer therapy–related cardiac dysfunction (CTRCD) [97]–[99]. As the gold standard for evaluating cardiac function, CMR is also considered as a complementary tool to echocardiography for early prediction of CTRCD in clinical investigations [100], [101]. The implementation of these methods has already allowed for the in-depth analysis of anticancer therapy-induced cardiomyopathy in patients.
However, the absence of fluorescence labeling and lower spatial resolution in contrast to optical methods prevent the applications of CMR in fundamental research. Animal models such as zebrafish or mice with genetically tractable fluorescence provide in vivo evaluation of therapeutic effectiveness and cardiac function after the treatment for the investigation of CTRCD [102]–[106]. Therefore, the emerging LSM and LFM coupled with the computational ability to characterize high-resolution fluorescence-labeled 4D images are emerging for current analysis of cardiac contractile function in research laboratories [107]. However, the shallow penetration depth constrains them in only transparent organisms such as zebrafish embryos. Relatively, OCT and PAT provide better penetration for the live imaging of mouse heart. The outstanding temporal resolution of ultrasound and optical imaging techniques also makes them favorable in cardiac contractility analysis which requires fast image acquisition.
Also, computational methods assessing the cardiac contractile function are integrating with machine learning and deep learning to track myocardial cells in 4D or time-dependent 2D images, providing more possibilities for cardiac image analysis. Such methods also have the potential to be integrated into the widespread virtual reality (VR) or augmented reality (AR) platforms for interactively study of cardiac mechanics [75], [108]–[110]. Thus, it is commendable to take advantage of different imaging methods with computational tools for a comprehensive analysis of cardiac functions.
Overall, we believe the study of global and regional cardiac contractile function will significantly benefit from the advancement of imaging and computational analysis, as the transformative integration of imaging and computation holds the great potential to unravel the contribution of mechanical properties to cardiac development and regeneration.
Acknowledgments
This work was supported by NIH R00 HL148493 (YD) and the University of Texas at Dallas.
Footnotes
Conflicts of Interest
The authors declare that they have no conflict of interest.
Human and Animal Rights and Informed Consent
This article does not contain any studies with human or animal subjects performed by any of the authors.
References:
- [1].Mann DL, “Inflammatory Mediators and the Failing Heart,” Circ. Res, vol. 91, no. 11, Art. no. 11, Nov. 2002, doi: 10.1161/01.RES.0000043825.01705.1B. [DOI] [PubMed] [Google Scholar]
- [2].Adamo L, Rocha-Resende C, Prabhu SD, and Mann DL, “Reappraising the role of inflammation in heart failure,” Nat. Rev. Cardiol, vol. 17, no. 5, Art. no. 5, May 2020, doi: 10.1038/s41569-019-0315-x. [DOI] [PubMed] [Google Scholar]
- [3].Jafar TH et al. , “Non-communicable diseases and injuries in Pakistan: Strategic priorities,” The Lancet, vol. 381, no. 9885, Art. no. 9885, 2013, doi: 10.1016/S0140-6736(13)60646-7. [DOI] [PubMed] [Google Scholar]
- [4].Ponikowski P et al. , “Heart failure: preventing disease and death worldwide,” ESC Heart Fail, vol. 1, no. 1, Art. no. 1, Sep. 2014, doi: 10.1002/ehf2.12005. [DOI] [PubMed] [Google Scholar]
- [5].Bui AL, Horwich TB, and Fonarow GC, “Epidemiology and risk profile of heart failure,” Nat. Rev. Cardiol, vol. 8, no. 1, Art. no. 1, Jan. 2011, doi: 10.1038/nrcardio.2010.165. [DOI] [PMC free article] [PubMed] [Google Scholar]
- [6].Voorhees AP and Han H-C, “Biomechanics of Cardiac Function,” Compr. Physiol, vol. 5, no. 4, Art. no. 4, Sep. 2015, doi: 10.1002/cphy.c140070. [DOI] [PMC free article] [PubMed] [Google Scholar]
- [7].Wang H and Amini AA, “Cardiac motion and deformation recovery from MRI: a review,” IEEE Trans. Med. Imaging, vol. 31, no. 2, Art. no. 2, Feb. 2012, doi: 10.1109/TMI.2011.2171706. [DOI] [PubMed] [Google Scholar]
- [8].Frangi AF, Niessen WJ, and Viergever MA, “Three-dimensional modeling for functional analysis of cardiac images, a review,” IEEE Trans. Med. Imaging, vol. 20, no. 1, pp. 2–5, Jan. 2001, doi: 10.1109/42.906421. [DOI] [PubMed] [Google Scholar]
- [9].Konstam MA and Abboud FM, “Ejection Fraction: Misunderstood and Overrated (Changing the Paradigm in Categorizing Heart Failure),” Circulation, vol. 135, no. 8, Art. no. 8, Feb. 2017, doi: 10.1161/CIRCULATIONAHA.116.025795. [DOI] [PMC free article] [PubMed] [Google Scholar]
- [10]. Amzulescu MS et al. , “Myocardial strain imaging: review of general principles, validation, and sources of discrepancies,” Eur. Heart J. Cardiovasc. Imaging, vol. 20, no. 6, Art. no. 6, Jun. 2019, doi: 10.1093/ehjci/jez041. This study compares specific cardiac tracking and strain imaging modalities, and it summarizes the general principles and technical innovations of current deformable image analysis.
- [11].Mirsky I and Parmley WW, “Assessment of Passive Elastic Stiffness for Isolated Heart Muscle and the Intact Heart,” Circ. Res, vol. 33, no. 2, pp. 233–243, Aug. 1973, doi: 10.1161/01.RES.33.2.233. [DOI] [PubMed] [Google Scholar]
- [12].Abraham TP and Nishimura RA, “Myocardial strain: can we finally measure contractility?,” J. Am. Coll. Cardiol, vol. 37, no. 3, Art. no. 3, Mar. 2001, doi: 10.1016/s0735-1097(00)01173-6. [DOI] [PubMed] [Google Scholar]
- [13].Sonnenblick EH, “Instantaneous Force-Velocity-Length Determinants in the Contraction of Heart Muscle,” Circ. Res, vol. 16, no. 5, Art. no. 5, May 1965, doi: 10.1161/01.RES.16.5.441. [DOI] [PubMed] [Google Scholar]
- [14].Scatteia A, Baritussio A, and Bucciarelli-Ducci C, “Strain imaging using cardiac magnetic resonance,” Heart Fail. Rev, vol. 22, no. 4, Art. no. 4, Jul. 2017, doi: 10.1007/s10741-017-9621-8. [DOI] [PMC free article] [PubMed] [Google Scholar]
- [15].Slomka P, Berman DS, Alexanderson E, and Germano G, “The role of PET quantification in cardiovascular imaging,” Clin. Transl. Imaging, vol. 2, no. 4, pp. 343–358, Aug. 2014, doi: 10.1007/s40336-014-0070-2. [DOI] [PMC free article] [PubMed] [Google Scholar]
- [16].Vach M et al. , “Feasibility of CT-derived myocardial strain measurement in patients with advanced cardiac valve disease,” Sci. Rep, vol. 11, no. 1, Art. no. 1, Apr. 2021, doi: 10.1038/s41598-021-88294-5. [DOI] [PMC free article] [PubMed] [Google Scholar]
- [17].O’Dell WG, McVeigh ER, Moore CC, and Zerhouni EA, “Implementation of displacement field fitting for calculating 3D myocardial deformations from parallel-tagged MR images,” in Proceedings of 16th Annual International Conference of the IEEE Engineering in Medicine and Biology Society, Nov. 1994, vol. 1, pp. 551–552 vol.1. doi: 10.1109/IEMBS.1994.411908. [DOI] [Google Scholar]
- [18].Axel L and Dougherty L, “MR imaging of motion with spatial modulation of magnetization.,” Radiology, vol. 171, no. 3, Art. no. 3, Jun. 1989, doi: 10.1148/radiology.171.3.2717762. [DOI] [PubMed] [Google Scholar]
- [19].Ibrahim E-SH, “Myocardial tagging by Cardiovascular Magnetic Resonance: evolution of techniques–pulse sequences, analysis algorithms, and applications,” J. Cardiovasc. Magn. Reson, vol. 13, no. 1, Art. no. 1, Jul. 2011, doi: 10.1186/1532-429X-13-36. [DOI] [PMC free article] [PubMed] [Google Scholar]
- [20].Brower RW, ten Katen HJ, and Meester GT, “Direct method for determining regional myocardial shortening after bypass surgery from radiopaque markers in man,” Am. J. Cardiol, vol. 41, no. 7, Art. no. 7, Jun. 1978, doi: 10.1016/0002-9149(78)90879-2. [DOI] [PubMed] [Google Scholar]
- [21].Villarreal FJ, Waldman LK, and Lew WY, “Technique for measuring regional two-dimensional finite strains in canine left ventricle.,” Circ. Res, vol. 62, no. 4, Art. no. 4, Apr. 1988, doi: 10.1161/01.RES.62.4.711. [DOI] [PubMed] [Google Scholar]
- [22].Shehata ML, Cheng S, Osman NF, Bluemke DA, and Lima JA, “Myocardial tissue tagging with cardiovascular magnetic resonance,” J. Cardiovasc. Magn. Reson, vol. 11, no. 1, Art. no. 1, Dec. 2009, doi: 10.1186/1532-429X-11-55. [DOI] [PMC free article] [PubMed] [Google Scholar]
- [23].Fischer SE, McKinnon GC, Maier SE, and Boesiger P, “Improved myocardial tagging contrast,” Magn. Reson. Med, vol. 30, no. 2, Art. no. 2, Aug. 1993, doi: 10.1002/mrm.1910300207. [DOI] [PubMed] [Google Scholar]
- [24].Aletras AH, Ding S, Balaban RS, and Wen H, “DENSE: Displacement Encoding with Stimulated Echoes in Cardiac Functional MRI,” J. Magn. Reson. San Diego Calif 1997, vol. 137, no. 1, Art. no. 1, Mar. 1999, doi: 10.1006/jmre.1998.1676. [DOI] [PMC free article] [PubMed] [Google Scholar]
- [25].Kim D, Epstein FH, Gilson WD, and Axel L, “Increasing the signal-to-noise ratio in DENSE MRI by combining displacement-encoded echoes,” Magn. Reson. Med, vol. 52, no. 1, Art. no. 1, Jul. 2004, doi: 10.1002/mrm.20109. [DOI] [PubMed] [Google Scholar]
- [26].Kim D, Gilson WD, Kramer CM, and Epstein FH, “Myocardial Tissue Tracking with Two-dimensional Cine Displacement-encoded MR Imaging: Development and Initial Evaluation,” Radiology, vol. 230, no. 3, Art. no. 3, Mar. 2004, doi: 10.1148/radiol.2303021213. [DOI] [PubMed] [Google Scholar]
- [27].Hess AT, Zhong X, Spottiswoode Bruce. S., Epstein Frederick. H., and Meintjes EM, “Myocardial 3D strain calculation by combining cine DENSE and cine SENC imaging,” Magn. Reson. Med. Off. J. Soc. Magn. Reson. Med. Soc. Magn. Reson. Med, vol. 62, no. 1, Art. no. 1, Jul. 2009, doi: 10.1002/mrm.21984. [DOI] [PMC free article] [PubMed] [Google Scholar]
- [28].Guttman MA, Prince JL, and McVeigh ER, “Tag and contour detection in tagged MR images of the left ventricle,” IEEE Trans. Med. Imaging, vol. 13, no. 1, Art. no. 1, 1994, doi: 10.1109/42.276146. [DOI] [PubMed] [Google Scholar]
- [29].Kumar S and Goldgof D, “Automatic tracking of SPAMM grid and the estimation of deformation parameters from cardiac MR images,” IEEE Trans. Med. Imaging, vol. 13, no. 1, Art. no. 1, 1994, doi: 10.1109/42.276150. [DOI] [PubMed] [Google Scholar]
- [30].Ozturk C and McVeigh ER, “Four-dimensional B-spline based motion analysis of tagged MR images: introduction andin vivovalidation,” Phys. Med. Biol, vol. 45, no. 6, Art. no. 6, May 2000, doi: 10.1088/0031-9155/45/6/319. [DOI] [PMC free article] [PubMed] [Google Scholar]
- [31].Dougherty L, Asmuth JC, Blom AS, Axel L, and Kumar R, “Validation of an optical flow method for tag displacement estimation,” IEEE Trans. Med. Imaging, vol. 18, no. 4, Art. no. 4, Apr. 1999, doi: 10.1109/42.768845. [DOI] [PubMed] [Google Scholar]
- [32].Florack L and van Assen H, “A new methodology for multiscale myocardial deformation and strain analysis based on tagging MRI,” Int. J. Biomed. Imaging, vol. 2010, p. 341242, 2010, doi: 10.1155/2010/341242. [DOI] [PMC free article] [PubMed] [Google Scholar]
- [33].Xu C et al. , “Deformation analysis of 3D tagged cardiac images using an optical flow method,” J. Cardiovasc. Magn. Reson, vol. 12, no. 1, Art. no. 1, Mar. 2010, doi: 10.1186/1532-429X-12-19. [DOI] [PMC free article] [PubMed] [Google Scholar]
- [34].Young AA, “Model tags: direct three-dimensional tracking of heart wall motion from tagged magnetic resonance images,” Med. Image Anal, vol. 3, no. 4, Art. no. 4, Dec. 1999, doi: 10.1016/s1361-8415(99)80029-2. [DOI] [PubMed] [Google Scholar]
- [35].Genet M, Stoeck CT, von Deuster C, Lee LC, and Kozerke S, “Equilibrated warping: Finite element image registration with finite strain equilibrium gap regularization,” Med. Image Anal, vol. 50, pp. 1–22, Dec. 2018, doi: 10.1016/j.media.2018.07.007. [DOI] [PubMed] [Google Scholar]
- [36].Deng X and Denney TS, “Combined tag tracking and strain reconstruction from tagged cardiac MR images without user-defined myocardial contours,” J. Magn. Reson. Imaging JMRI, vol. 21, no. 1, Art. no. 1, Jan. 2005, doi: 10.1002/jmri.20234. [DOI] [PubMed] [Google Scholar]
- [37].Park J, Metaxas D, and Axel L, “Volumetric deformable models with parameter functions: A new approach to the 3D motion analysis of the LV from MRI-SPAMM,” in Proceedings of IEEE International Conference on Computer Vision, Jun. 1995, pp. 700–705. doi: 10.1109/ICCV.1995.466870. [DOI] [Google Scholar]
- [38].Sermesant M, Delingette H, and Ayache N, “An electromechanical model of the heart for image analysis and simulation,” IEEE Trans. Med. Imaging, vol. 25, no. 5, Art. no. 5, May 2006, doi: 10.1109/TMI.2006.872746. [DOI] [PubMed] [Google Scholar]
- [39].Osman NF, Kerwin WS, McVeigh ER, and Prince JL, “Cardiac Motion Tracking Using CINE Harmonic Phase (HARP) Magnetic Resonance Imaging,” Magn. Reson. Med. Off. J. Soc. Magn. Reson. Med. Soc. Magn. Reson. Med, vol. 42, no. 6, Art. no. 6, Dec. 1999. [DOI] [PMC free article] [PubMed] [Google Scholar]
- [40].Osman NF, McVeigh ER, and Prince JL, “Imaging heart motion using harmonic phase MRI,” IEEE Trans. Med. Imaging, vol. 19, no. 3, Art. no. 3, Mar. 2000, doi: 10.1109/42.845177. [DOI] [PubMed] [Google Scholar]
- [41].Osman NF and Prince JL, “Visualizing myocardial function using HARP MRI,” Phys. Med. Biol, vol. 45, no. 6, Art. no. 6, Jun. 2000, doi: 10.1088/0031-9155/45/6/318. [DOI] [PubMed] [Google Scholar]
- [42].Arts T, Prinzen FW, Delhaas T, Milles JR, Rossi AC, and Clarysse P, “Mapping Displacement and Deformation of the Heart With Local Sine-Wave Modeling,” IEEE Trans. Med. Imaging, vol. 29, no. 5, pp. 1114–1123, May 2010, doi: 10.1109/TMI.2009.2037955. [DOI] [PubMed] [Google Scholar]
- [43].Wang H, Stoeck CT, Kozerke S, and Amini AA, “Analysis of 3D cardiac deformations with 3D SinMod,” Annu. Int. Conf. IEEE Eng. Med. Biol. Soc. IEEE Eng. Med. Biol. Soc. Annu. Int. Conf, vol. 2013, pp. 4386–4389, 2013, doi: 10.1109/EMBC.2013.6610518. [DOI] [PubMed] [Google Scholar]
- [44].Clarysse P et al. , “Two-dimensional spatial and temporal displacement and deformation field fitting from cardiac magnetic resonance tagging,” Med. Image Anal, vol. 4, no. 3, pp. 253–268, Sep. 2000, doi: 10.1016/s1361-8415(00)00018-9. [DOI] [PubMed] [Google Scholar]
- [45].Ibrahim E-SH et al. , “Regional cardiac function analysis from tagged MRI images. Comparison of techniques: Harmonic-Phase (HARP) versus Sinusoidal-Modeling (SinMod) analysis,” Magn. Reson. Imaging, vol. 54, pp. 271–282, Dec. 2018, doi: 10.1016/j.mri.2018.05.008. [DOI] [PMC free article] [PubMed] [Google Scholar]
- [46].Kadappu KK and Thomas L, “Tissue Doppler Imaging in Echocardiography: Value and Limitations,” Heart Lung Circ, vol. 24, no. 3, Art. no. 3, Mar. 2015, doi: 10.1016/j.hlc.2014.10.003. [DOI] [PubMed] [Google Scholar]
- [47].Isaaz K, Thompson A, Ethevenot G, Cloez JL, Brembilla B, and Pernot C, “Doppler echocardiographic measurement of low velocity motion of the left ventricular posterior wall,” Am. J. Cardiol, vol. 64, no. 1, Art. no. 1, Jul. 1989, doi: 10.1016/0002-9149(89)90655-3. [DOI] [PubMed] [Google Scholar]
- [48].Olsen NT, Jons C, Fritz-Hansen T, Mogelvang R, and Sogaard P, “Pulsed-Wave Tissue Doppler and Color Tissue Doppler Echocardiography: Calibration with M-Mode, Agreement, and Reproducibility in a Clinical Setting,” Echocardiography, vol. 26, no. 6, pp. 638–644, 2009, doi: 10.1111/j.1540-8175.2008.00872.x. [DOI] [PubMed] [Google Scholar]
- [49].Soliman OII et al. , “Spectral pulsed-wave tissue Doppler imaging lateral-to-septal delay fails to predict clinical or echocardiographic outcome after cardiac resynchronization therapy,” EP Eur, vol. 9, no. 2, pp. 113–118, Feb. 2007, doi: 10.1093/europace/eul149. [DOI] [PubMed] [Google Scholar]
- [50].Sahn DJ, “Instrumentation and physical factors related to visualization of stenotic and regurgitant jets by Doppler color flow mapping,” J. Am. Coll. Cardiol, vol. 12, no. 5, pp. 1354–1365, Nov. 1988, doi: 10.1016/0735-1097(88)92621-6. [DOI] [PubMed] [Google Scholar]
- [51].Nestaas E, Schubert U, de Boode WP, and El-Khuffash A, “Tissue Doppler velocity imaging and event timings in neonates: a guide to image acquisition, measurement, interpretation, and reference values,” Pediatr. Res, vol. 84, no. Suppl 1, pp. 18–29, 2018, doi: 10.1038/s41390-018-0079-8. [DOI] [PMC free article] [PubMed] [Google Scholar]
- [52].Eriksen BH, Nestaas E, Hole T, Liestøl K, Støylen A, and Fugelseth D, “Longitudinal assessment of atrioventricular annulus excursion by grey-scale m-mode and colour tissue Doppler imaging in premature infants,” Early Hum. Dev, vol. 89, no. 12, pp. 977–982, Dec. 2013, doi: 10.1016/j.earlhumdev.2013.09.006. [DOI] [PubMed] [Google Scholar]
- [53].Mandysová E, Mráz T, Táborský M, and Niederle P, “Reproducibility of tissue Doppler parameters of asynchrony in patients with advanced LV dysfunction ☆,” Eur. J. Echocardiogr, vol. 9, no. 4, pp. 509–515, Jul. 2008, doi: 10.1016/j.euje.2007.08.005. [DOI] [PubMed] [Google Scholar]
- [54].Blessberger H and Binder T, “Two dimensional speckle tracking echocardiography: basic principles,” Heart, vol. 96, no. 9, Art. no. 9, May 2010, doi: 10.1136/hrt.2007.141002. [DOI] [PubMed] [Google Scholar]
- [55].Geyer H et al. , “Assessment of myocardial mechanics using speckle tracking echocardiography: fundamentals and clinical applications,” J. Am. Soc. Echocardiogr. Off. Publ. Am. Soc. Echocardiogr, vol. 23, no. 4, Art. no. 4, Apr. 2010, doi: 10.1016/j.echo.2010.02.015. [DOI] [PubMed] [Google Scholar]
- [56].Leitman M et al. , “Two-dimensional strain-a novel software for real-time quantitative echocardiographic assessment of myocardial function,” J. Am. Soc. Echocardiogr. Off. Publ. Am. Soc. Echocardiogr, vol. 17, no. 10, Art. no. 10, Oct. 2004, doi: 10.1016/j.echo.2004.06.019. [DOI] [PubMed] [Google Scholar]
- [57].Reisner SA, Lysyansky P, Agmon Y, Mutlak D, Lessick J, and Friedman Z, “Global longitudinal strain: a novel index of left ventricular systolic function,” J. Am. Soc. Echocardiogr. Off. Publ. Am. Soc. Echocardiogr, vol. 17, no. 6, Art. no. 6, Jun. 2004, doi: 10.1016/j.echo.2004.02.011. [DOI] [PubMed] [Google Scholar]
- [58].Dandel M, Lehmkuhl H, Knosalla C, Suramelashvili N, and Hetzer R, “Strain and Strain Rate Imaging by Echocardiography – Basic Concepts and Clinical Applicability,” Curr. Cardiol. Rev, vol. 5, no. 2, Art. no. 2, May 2009, doi: 10.2174/157340309788166642. [DOI] [PMC free article] [PubMed] [Google Scholar]
- [59].Hayat D et al. , “Comparison of real-time three-dimensional speckle tracking to magnetic resonance imaging in patients with coronary heart disease,” Am. J. Cardiol, vol. 109, no. 2, Art. no. 2, Jan. 2012, doi: 10.1016/j.amjcard.2011.08.030. [DOI] [PubMed] [Google Scholar]
- [60].Suhling M, Arigovindan M, Jansen C, Hunziker P, and Unser M, “Myocardial motion analysis from B-mode echocardiograms,” IEEE Trans. Image Process, vol. 14, no. 4, Art. no. 4, Apr. 2005, doi: 10.1109/TIP.2004.838709. [DOI] [PubMed] [Google Scholar]
- [61].Yu W, Yan P, Sinusas AJ, Thiele K, and Duncan JS, “Towards pointwise motion tracking in echocardiographic image sequences--comparing the reliability of different features for speckle tracking,” Med. Image Anal, vol. 10, no. 4, Art. no. 4, Aug. 2006, doi: 10.1016/j.media.2005.12.003. [DOI] [PubMed] [Google Scholar]
- [62].Paragios N, “A level set approach for shape-driven segmentation and tracking of the left ventricle,” IEEE Trans. Med. Imaging, vol. 22, no. 6, Art. no. 6, Jun. 2003, doi: 10.1109/TMI.2003.814785. [DOI] [PubMed] [Google Scholar]
- [63].Elen A et al. , “Three-dimensional cardiac strain estimation using spatio-temporal elastic registration of ultrasound images: a feasibility study,” IEEE Trans. Med. Imaging, vol. 27, no. 11, Art. no. 11, Nov. 2008, doi: 10.1109/TMI.2008.2004420. [DOI] [PubMed] [Google Scholar]
- [64].Weissleder R and Pittet MJ, “Imaging in the era of molecular oncology,” Nature, vol. 452, no. 7187, pp. 580–589, Apr. 2008, doi: 10.1038/nature06917. [DOI] [PMC free article] [PubMed] [Google Scholar]
- [65].Epstein FH, “MR in mouse models of cardiac disease,” NMR Biomed, vol. 20, no. 3, pp. 238–255, May 2007, doi: 10.1002/nbm.1152. [DOI] [PubMed] [Google Scholar]
- [66].Savchenko A et al. , “Graphene biointerfaces for optical stimulation of cells,” Sci. Adv, vol. 4, no. 5, p. eaat0351, doi: 10.1126/sciadv.aat0351. [DOI] [PMC free article] [PubMed] [Google Scholar]
- [67].Huisken J, Swoger J, Del Bene F, Wittbrodt J, and Stelzer EHK, “Optical Sectioning Deep Inside Live Embryos by Selective Plane Illumination Microscopy,” Science, vol. 305, no. 5686, pp. 1007–1009, Aug. 2004, doi: 10.1126/science.1100035. [DOI] [PubMed] [Google Scholar]
- [68].Weber M, Mickoleit M, and Huisken J, “Chapter 11 - Light sheet microscopy,” in Methods in Cell Biology, vol. 123, Waters JC and Wittman T, Eds. Academic Press, 2014, pp. 193–215. doi: 10.1016/B978-0-12-420138-5.00011-2. [DOI] [PubMed] [Google Scholar]
- [69].Levoy M, Ng R, Adams A, Footer M, and Horowitz M, “Light field microscopy,” in ACM SIGGRAPH 2006 Papers, New York, NY, USA, Jul. 2006, pp. 924–934. doi: 10.1145/1179352.1141976. [DOI] [Google Scholar]
- [70].Prevedel R et al. , “Simultaneous whole-animal 3D imaging of neuronal activity using light-field microscopy,” Nat. Methods, vol. 11, no. 7, Art. no. 7, Jul. 2014, doi: 10.1038/nmeth.2964. [DOI] [PMC free article] [PubMed] [Google Scholar]
- [71].Pégard NC, Liu H-Y, Antipa N, Gerlock M, Adesnik H, and Waller L, “Compressive light-field microscopy for 3D neural activity recording,” Optica, vol. 3, no. 5, pp. 517–524, May 2016, doi: 10.1364/OPTICA.3.000517. [DOI] [Google Scholar]
- [72].Cong L et al. , “Rapid whole brain imaging of neural activity in freely behaving larval zebrafish (Danio rerio),” eLife, vol. 6, p. e28158, Sep. 2017, doi: 10.7554/eLife.28158. [DOI] [PMC free article] [PubMed] [Google Scholar]
- [73].Wagner N et al. , “Instantaneous isotropic volumetric imaging of fast biological processes,” Nat. Methods, vol. 16, no. 6, Art. no. 6, Jun. 2019, doi: 10.1038/s41592-019-0393-z. [DOI] [PubMed] [Google Scholar]
- [74]. Wang Z et al. , “Real-time volumetric reconstruction of biological dynamics with light-field microscopy and deep learning,” Nat. Methods, vol. 18, no. 5, Art. no. 5, May 2021, doi: 10.1038/s41592-021-01058-x. This study offers a compelling solution for investigating the dynamic properties and functions of the cardiovascular system based on light-field microscopy and an easily adoptable deep-learning framework.
- [75].Ding Y et al. , “Integrating light-sheet imaging with virtual reality to recapitulate developmental cardiac mechanics,” JCI Insight, vol. 2, no. 22, Nov. 2017, doi: 10.1172/jci.insight.97180. [DOI] [PMC free article] [PubMed] [Google Scholar]
- [76].Wang Z, Ding Y, Satta S, Roustaei M, Fei P, and Hsiai TK, “A hybrid of light-field and light-sheet imaging to study myocardial function and intracardiac blood flow during zebrafish development,” PLOS Comput. Biol, vol. 17, no. 7, Art. no. 7, Jul. 2021, doi: 10.1371/journal.pcbi.1009175. [DOI] [PMC free article] [PubMed] [Google Scholar]
- [77]. Chen J et al. , “Displacement analysis of myocardial mechanical deformation (DIAMOND) reveals segmental susceptibility to doxorubicin-induced injury and regeneration,” JCI Insight, vol. 4, no. 8, Art. no. 8, Apr. 2019, doi: 10.1172/jci.insight.125362. This study developed a semiautomated method to assess the displacement of regional myocardial deformation, providing a new biomechanical insight into the in vivo analysis of cardiac contractile function.
- [78].Brock KK, Sharpe MB, Dawson LA, Kim SM, and Jaffray DA, “Accuracy of finite element model-based multi-organ deformable image registration,” Med. Phys, vol. 32, no. 6, pp. 1647–1659, Jun. 2005, doi: 10.1118/1.1915012. [DOI] [PubMed] [Google Scholar]
- [79].Hill DL, Batchelor PG, Holden M, and Hawkes DJ, “Medical image registration,” Phys. Med. Biol, vol. 46, no. 3, pp. R1–45, Mar. 2001, doi: 10.1088/0031-9155/46/3/201. [DOI] [PubMed] [Google Scholar]
- [80].Thirion JP, “Image matching as a diffusion process: an analogy with Maxwell’s demons,” Med. Image Anal, vol. 2, no. 3, pp. 243–260, Sep. 1998, doi: 10.1016/s1361-8415(98)80022-4. [DOI] [PubMed] [Google Scholar]
- [81].O’Shea C et al. , “Cardiac optical mapping – State-of-the-art and future challenges,” Int. J. Biochem. Cell Biol, vol. 126, p. 105804, Sep. 2020, doi: 10.1016/j.biocel.2020.105804. [DOI] [PMC free article] [PubMed] [Google Scholar]
- [82].Huang D et al. , “Optical Coherence Tomography,” Science, vol. 254, no. 5035, pp. 1178–1181, Nov. 1991, doi: 10.1126/science.1957169. [DOI] [PMC free article] [PubMed] [Google Scholar]
- [83].Attizzani GF, Patrício L, and Bezerra HG, “Optical coherence tomography assessment of calcified plaque modification after rotational atherectomy,” Catheter. Cardiovasc. Interv. Off. J. Soc. Card. Angiogr. Interv, vol. 81, no. 3, Art. no. 3, Feb. 2013, doi: 10.1002/ccd.23385. [DOI] [PubMed] [Google Scholar]
- [84].Wang S and Larina I, “Live mechanistic assessment of localized cardiac pumping in mammalian tubular embryonic heart,” J. Biomed. Opt, vol. 25, no. 8, Art. no. 8, Aug. 2020, doi: 10.1117/1.JBO.25.8.086001. [DOI] [PMC free article] [PubMed] [Google Scholar]
- [85].Lv J et al. , “Hemispherical photoacoustic imaging of myocardial infarction: in vivo detection and monitoring,” Eur. Radiol, vol. 28, no. 5, Art. no. 5, May 2018, doi: 10.1007/s00330-017-5209-x. [DOI] [PubMed] [Google Scholar]
- [86].Hou J et al. , “OCT Assessment of Allograft Vasculopathy in Heart Transplant Recipients,” JACC Cardiovasc. Imaging, vol. 5, no. 6, pp. 662–663, Jun. 2012, doi: 10.1016/j.jcmg.2012.01.018. [DOI] [PubMed] [Google Scholar]
- [87].Zhang C, Wang LV, Cheng Y-J, Chen J, and W. M.d SA, “Label-free photoacoustic microscopy of myocardial sheet architecture,” J. Biomed. Opt, vol. 17, no. 6, p. 060506, Jun. 2012, doi: 10.1117/1.JBO.17.6.060506. [DOI] [PMC free article] [PubMed] [Google Scholar]
- [88].Wang LV and Hu S, “Photoacoustic Tomography: In Vivo Imaging from Organelles to Organs,” Science, vol. 335, no. 6075, pp. 1458–1462, Mar. 2012, doi: 10.1126/science.1216210. [DOI] [PMC free article] [PubMed] [Google Scholar]
- [89].Fernandez-Gonzalez R et al. , “PyJAMAS: open-source, multimodal segmentation and analysis of microscopy images,” Bioinformatics, vol. 38, no. 2, pp. 594–596, Jan. 2022, doi: 10.1093/bioinformatics/btab589. [DOI] [PMC free article] [PubMed] [Google Scholar]
- [90].Wen C et al. , “3DeeCellTracker, a deep learning-based pipeline for segmenting and tracking cells in 3D time lapse images,” eLife, vol. 10, p. e59187, Mar. 2021, doi: 10.7554/eLife.59187. [DOI] [PMC free article] [PubMed] [Google Scholar]
- [91].Beucher S, “The watershed transformation applied to image segmentation,” Scanning Microsc. Suppl, pp. 299–314, Jan. 1992. [Google Scholar]
- [92].Wang MFZ, Hunter MV, Wang G, McFaul C, Yip CM, and Fernandez-Gonzalez R, “Automated cell tracking identifies mechanically oriented cell divisions during Drosophila axis elongation,” Dev. Camb. Engl, vol. 144, no. 7, pp. 1350–1361, Apr. 2017, doi: 10.1242/dev.141473. [DOI] [PubMed] [Google Scholar]
- [93].Lindsey ML, Iyer RP, Jung M, DeLeon-Pennell KY, and Ma Y, “Matrix Metalloproteinases as Input and Output Signals for Post-Myocardial Infarction Remodeling,” J. Mol. Cell. Cardiol, vol. 91, pp. 134–140, Feb. 2016, doi: 10.1016/j.yjmcc.2015.12.018. [DOI] [PMC free article] [PubMed] [Google Scholar]
- [94].Genet M et al. , “Heterogeneous growth-induced prestrain in the heart,” J. Biomech, vol. 48, no. 10, pp. 2080–2089, Jul. 2015, doi: 10.1016/j.jbiomech.2015.03.012. [DOI] [PMC free article] [PubMed] [Google Scholar]
- [95].Gupta A and Eisen HJ, “Cardiac-Oncology: Management of the Patient with Heart Failure After Chemotherapy,” in Heart Failure: A Comprehensive Guide to Pathophysiology and Clinical Care, Eisen H, Ed. London: Springer, 2017, pp. 309–325. doi: 10.1007/978-1-4471-4219-5_13. [DOI] [Google Scholar]
- [96].Dobson R et al. , “BSE and BCOS Guideline for Transthoracic Echocardiographic Assessment of Adult Cancer Patients Receiving Anthracyclines and/or Trastuzumab,” JACC CardioOncology, vol. 3, no. 1, pp. 1–16, Mar. 2021, doi: 10.1016/j.jaccao.2021.01.011. [DOI] [PMC free article] [PubMed] [Google Scholar]
- [97].Čelutkienė J et al. , “Role of cardiovascular imaging in cancer patients receiving cardiotoxic therapies: a position statement on behalf of the Heart Failure Association (HFA), the European Association of Cardiovascular Imaging (EACVI) and the Cardio-Oncology Council of the European Society of Cardiology (ESC),” Eur. J. Heart Fail, vol. 22, no. 9, pp. 1504–1524, Sep. 2020, doi: 10.1002/ejhf.1957. [DOI] [PubMed] [Google Scholar]
- [98].Zamorano JL et al. , “2016 ESC Position Paper on cancer treatments and cardiovascular toxicity developed under the auspices of the ESC Committee for Practice Guidelines: The Task Force for cancer treatments and cardiovascular toxicity of the European Society of Cardiology (ESC),” Eur. Heart J, vol. 37, no. 36, pp. 2768–2801, Sep. 2016, doi: 10.1093/eurheartj/ehw211. [DOI] [PubMed] [Google Scholar]
- [99].Plana JC et al. , “Expert consensus for multimodality imaging evaluation of adult patients during and after cancer therapy: a report from the American Society of Echocardiography and the European Association of Cardiovascular Imaging,” J. Am. Soc. Echocardiogr. Off. Publ. Am. Soc. Echocardiogr, vol. 27, no. 9, pp. 911–939, Sep. 2014, doi: 10.1016/j.echo.2014.07.012. [DOI] [PubMed] [Google Scholar]
- [100].Manrique CR, Park M, Tiwari N, Plana JC, and Garcia MJ, “Diagnostic Strategies for Early Recognition of Cancer Therapeutics–Related Cardiac Dysfunction,” Clin. Med. Insights Cardiol, vol. 11, p. 1179546817697983, Jan. 2017, doi: 10.1177/1179546817697983. [DOI] [PMC free article] [PubMed] [Google Scholar]
- [101].Perez IE, Taveras Alam S, Hernandez GA, and Sancassani R, “Cancer Therapy-Related Cardiac Dysfunction: An Overview for the Clinician,” Clin. Med. Insights Cardiol, vol. 13, p. 1179546819866445, Jul. 2019, doi: 10.1177/1179546819866445. [DOI] [PMC free article] [PubMed] [Google Scholar]
- [102].Campbell JM, Hartjes KA, Nelson TJ, Xu X, and Ekker SC, “New and TALENted genome engineering toolbox,” Circ. Res, vol. 113, no. 5, pp. 571–587, Aug. 2013, doi: 10.1161/CIRCRESAHA.113.301765. [DOI] [PMC free article] [PubMed] [Google Scholar]
- [103].Kim J-D, Lee H-W, and Jin S-W, “Diversity Is in My Veins,” Arterioscler. Thromb. Vasc. Biol, vol. 34, no. 9, pp. 1838–1845, Sep. 2014, doi: 10.1161/ATVBAHA.114.303219. [DOI] [PMC free article] [PubMed] [Google Scholar]
- [104].Milan DJ, Jones IL, Ellinor PT, and MacRae CA, “In vivo recording of adult zebrafish electrocardiogram and assessment of drug-induced QT prolongation,” Am. J. Physiol. Heart Circ. Physiol, vol. 291, no. 1, pp. H269–273, Jul. 2006, doi: 10.1152/ajpheart.00960.2005. [DOI] [PubMed] [Google Scholar]
- [105].Santoro MM, “Antiangiogenic cancer drug using the zebrafish model,” Arterioscler. Thromb. Vasc. Biol, vol. 34, no. 9, pp. 1846–1853, Sep. 2014, doi: 10.1161/ATVBAHA.114.303221. [DOI] [PubMed] [Google Scholar]
- [106].Sedmera D et al. , “Functional and morphological evidence for a ventricular conduction system in zebrafish and Xenopus hearts,” Am. J. Physiol. Heart Circ. Physiol, vol. 284, no. 4, pp. H1152–1160, Apr. 2003, doi: 10.1152/ajpheart.00870.2002. [DOI] [PubMed] [Google Scholar]
- [107].Packard RRS et al. , “Automated Segmentation of Light-Sheet Fluorescent Imaging to Characterize Experimental Doxorubicin-Induced Cardiac Injury and Repair,” Sci. Rep, vol. 7, no. 1, Art. no. 1, Aug. 2017, doi: 10.1038/s41598-017-09152-x. [DOI] [PMC free article] [PubMed] [Google Scholar]
- [108].Lamounier E, Bucioli A, Cardoso A, Andrade A, and Soares A, “On the use of Augmented Reality techniques in learning and interpretation of cardiologic data,” in 2010 Annual International Conference of the IEEE Engineering in Medicine and Biology, Aug. 2010, pp. 610–613. doi: 10.1109/IEMBS.2010.5628019. [DOI] [PubMed] [Google Scholar]
- [109].Koger CR, Hassan SS, Yuan J, and Ding Y, “Virtual Reality for Interactive Medical Analysis,” Front. Virtual Real, vol. 3, 2022, Accessed: Mar. 15, 2022. [Online]. Available: 10.3389/frvir.2022.782854 [DOI] [PMC free article] [PubMed] [Google Scholar]
- [110].Abiri A et al. , “Simulating Developmental Cardiac Morphology in Virtual Reality Using a Deformable Image Registration Approach,” Ann. Biomed. Eng, vol. 46, no. 12, pp. 2177–2188, Dec. 2018, doi: 10.1007/s10439-018-02113-z. [DOI] [PMC free article] [PubMed] [Google Scholar]
- [111].Kaluzynski K, Chen X, Emelianov SY, Skovoroda AR, and O’Donnell M, “Strain rate imaging using two-dimensional speckle tracking,” IEEE Trans. Ultrason. Ferroelectr. Freq. Control, vol. 48, no. 4, pp. 1111–1123, Jul. 2001, doi: 10.1109/58.935730. [DOI] [PubMed] [Google Scholar]
- [112].Helle-Valle T et al. , “New noninvasive method for assessment of left ventricular rotation: speckle tracking echocardiography,” Circulation, vol. 112, no. 20, pp. 3149–3156, Nov. 2005, doi: 10.1161/CIRCULATIONAHA.104.531558. [DOI] [PubMed] [Google Scholar]