Abstract
Background
Patients undergoing prostate biopsies (PBs) suffer from low positive rates and potential risk for complications. This study aimed to develop and validate an ultrasound (US)‐based radiomics score for pre‐biopsy prediction of prostate cancer (PCa) and subsequently reduce unnecessary PBs.
Methods
Between December 2015 and March 2018, 196 patients undergoing initial transrectal ultrasound (TRUS)‐guided PBs were retrospectively enrolled and randomly assigned to the training or validation cohort at a ratio of 7:3. A total of 1044 radiomics features were extracted from grayscale US images of each prostate nodule. After feature selection through the least absolute shrinkage and selection operator (LASSO) regression model, the radiomics score was developed from the training cohort. The prediction nomograms were developed using multivariate logistic regression analysis based on the radiomics score and clinical risk factors. The performance of the nomograms was assessed and compared in terms of discrimination, calibration, and clinical usefulness.
Results
The radiomics score consisted of five selected features. Multivariate logistic regression analysis demonstrated that the radiomics score, age, total prostate‐specific antigen (tPSA), and prostate volume were independent factors for prediction of PCa (all p < 0.05). The integrated nomogram incorporating the radiomics score and three clinical risk factors reached an area under the curve (AUC) of 0.835 (95% confidence interval [CI], 0.729–0.941), thereby outperforming the clinical nomogram which based on only clinical factors and yielded an AUC of 0.752 (95% CI, 0.618–0.886) (p = 0.04). Both nomograms showed good calibration. Decision curve analysis indicated that using the integrated nomogram would add more benefit than using the clinical nomogram.
Conclusion
The radiomics score was an independent factor for pre‐biopsy prediction of PCa. Addition of the radiomics score to the clinical nomogram shows incremental prognostic value and may help clinicians make precise decisions to reduce unnecessary PBs.
Keywords: nomogram, prostate cancer, radiomics, ultrasound
1. INTRODUCTION
Prostate cancer (PCa) is the most common cancer which accounts for 26% of new diagnoses and the second most common cause of cancer‐related death in American men. 1 In current clinical practice, after an elevated prostate‐specific antigen (PSA) testing or a suspicious digital rectal examination (DRE), the standard diagnostic approach for PCa predominantly relies on the systematic prostate biopsy (PB). 2 However, only 30%–45% of patients undergoing initial PBs show positive results. 3 , 4 , 5 In other words, more than half of patients could have been saved from unnecessary PBs and related complications, such as infection, bleeding, urinary retention, as well as significant psychological stress. 6 Thus, it is of great clinical importance to assess PCa risk more accurately before initial PBs to prevent or reduce unnecessary PBs.
Various nomograms based on clinical parameters have been used to identify patients in need of invasive PBs, with limited predictive accuracy ranging from 66% to 77%. 7 , 8 , 9 The inclusion of novel cancer‐specific biomarkers may add to the predictive accuracy to some extent, such as the Four‐Kallikrein panel (4Kscore), the Stockholm‐3 (STHLM3) test, and prostate cancer antigen 3 (PCA3) gene score. 10 , 11 , 12 Apart from that, previous studies have attempted to use prebiopsy imaging techniques for PCa screening. 13 , 14 Compared to magnetic resonance imaging (MRI), ultrasound (US) is widely available, portable and cost‐effective with the additional possibility of real‐time imaging and biopsy needle monitoring. US imaging features, such as echogenicity, tissue stiffness, and vascularity, have shown encouraging results in clinical prediction of PCa presence. 14 , 15 However, these imaging features were based on human visual grayscale, which restricts the potential for identifying valuable microcosmic image features with clinical implications.
Radiomic analysis, a rapidly growing discipline based on machine‐learning algorithms, can extract far more features than manual feature extraction. 16 , 17 It extracts high‐throughput medical image features and mines information related to tumor biology, which might contribute to clinical decision‐making. 18 , 19 Previous studies have demonstrated the clinical usefulness of US‐based radiomics in thyroid cancer, breast cancer, and liver cancer. 20 , 21 , 22 To the best of our knowledge, the literature focusing on US‐based radiomics in pre‐biopsy prediction of PCa remains limited. Therefore, we developed and validated a novel radiomics score based on the image features of grayscale US to improve the diagnostic performance of PCa screening and reduce unnecessary PBs.
2. MATERIALS AND METHODS
2.1. Study design
This retrospective study was approved by the Ethics Committee of the First Affiliated Hospital of Sun Yat‐sen University, and the informed consent requirement was waived. Figure 1 displays the flowchart of the study design. In all, 295 patients subjected to the initial transrectal ultrasound‐guided prostate biopsy (TRUS‐PB) due to suspicious DRE and/or elevated total PSA (tPSA) level from December 2015 to March 2018 were consecutively enrolled in this study. The inclusion criteria were as follows: (1) the tPSA level below 20 ng/ml; (2) solitary prostate nodule on the US image; and (3) the initial TRUS‐PB performed within 1 week after PSA screening. The exclusion criteria were as follows: (1) incomplete clinic‐pathological data; (2) insufficient quality of US images to segment the target nodule. Finally, a total of 196 target nodules from 196 patients were randomly assigned to the training or validation cohort at a ratio of 7:3. The training cohort was used to build the predictive nomograms for pre‐biopsy PCa screening, and the validation cohort was used to test the performance of the predictive nomograms.
Figure 1.
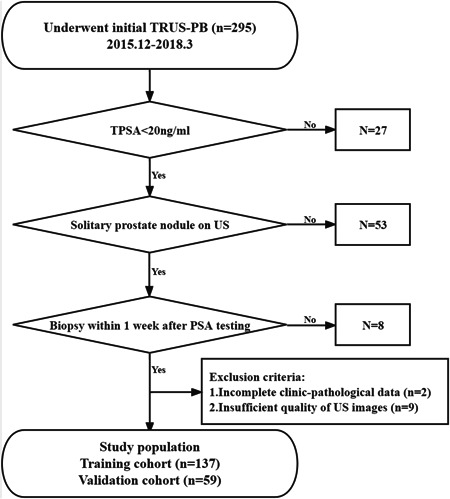
The flowchart of this study.
2.2. Ultrasound examination and PB
The TRUS examinations were performed manually by the radiologist (Chen Li with 5 years of experience performing TRUS examinations) using the same US machine (HITACHI ALOKA‐Noblus) equipped with the CC41R probe. Two images for each target nodule (one largest transverse cross‐section, one largest long axis cross‐section) were routinely recorded. Then the urologist (J.L.Z. with 10 years of experience in PB) performed the systematic TRUS‐PB (≥10‐core) with or without additional targeted biopsy for prostate nodules assisted by the radiologist. Two independent pathologists (Zhongjian Zhou and Jingxian Huang with 5 years of experience in genitourinary pathology) reviewed all the histopathologic specimen slices and labeled prostate nodules as benign or malignant with Gleason grades. In case of disagreement between two pathologists, the final pathological reports were discussed with a third pathologist (Shurong Li with 10 years of experience in genitourinary pathology) to reach a consensus. All pathologists were blinded to the US images and clinical information of patients.
2.3. Radiomics score
The radiologist (Shuangjian Jiang with at least 5 years of experience in genitourinary US) manually delineated the region of interest (ROI) around the outline of the target prostate nodules on the largest long axis cross‐section grayscale images using the A.K. software (Artificial Intelligence Kit, version 1.1, GE Healthcare) with no prior knowledge of the histopathological results (Figure 2). Then, a total of 1044 features were extracted from the ROI through computerized algorithms and normalized by the Z‐score method. The least absolute shrinkage and selection operator (LASSO) regression model was used to further select features. 23 Finally, the radiomics score formula was generated based on the selected features. The Supplement presents the details of delineating ROI (Supporting Information: S1) and building the radiomics score formula (Supporting Information: S2).
Figure 2.
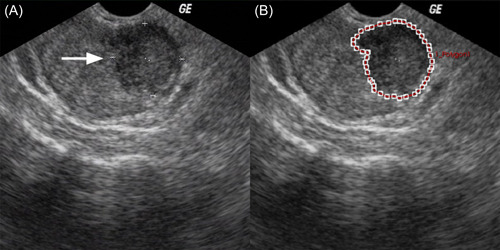
Example of delineating region of interest (ROI) on gray‐scale ultrasound images. The arrow indicates the solitary prostate nodule of a 65‐year‐old man (A). The nodule outline was delineated as the ROI (B). [Color figure can be viewed at wileyonlinelibrary.com]
2.4. Development and validation of predictive nomograms
Univariate and multivariate logistic regression models were used to select independent factors for pre‐biopsy prediction of PCa in the training cohort. Factors significant at the 0.10 level in the univariate analysis were included in the multivariate logistic regression analysis. In addition, p values below 0.05 were considered significant in the multivariate analysis. Given that prostate‐specific antigen density (PSAD) and %fPSA (percent free prostate‐specific antigen) were calculated values of other clinical parameters, they were not included in the logistic regression analysis for ease of statistical interpretation. The integrated nomogram incorporated both the radiomics score and the independent clinical risk factors based on the multivariate analysis, while the clinical nomogram incorporated only the independent clinical risk factors. The performance of the two nomograms was evaluated and compared in terms of discrimination, calibration, and clinical usefulness.
2.5. Discrimination
Receiver operating characteristic (ROC) curves were plotted to evaluate the performance of the radiomics score, clinical nomogram, and integrated nomogram in pre‐biopsy prediction of PCa in the training and validation cohorts. Discrimination was quantified with the area under the curve (AUC) analysis.
2.6. Calibration
Calibration curves (i.e., the agreement between predicted probabilities and observed outcome frequencies) were plotted to explore the predictive accuracy of the prediction nomograms in the validation cohort. 24
2.7. Clinical usefulness
Decision curve analysis (DCA) was conducted to determine the clinical usefulness of the prediction nomograms by quantifying the net benefits at different threshold probabilities in the validation cohort. 25
2.8. Statistical analysis
Statistical analysis was conducted with IBM SPSS 22.0 for Windows (IBM Corp.) and R software (version 4.1.0). Categorical variables, presented as number (percentile), were compared using the χ 2 test or the Fisher's exact test. Continuous variables, reported as median with the interquartile range (IQR), were compared using the Student's t test or the Mann–Whitney U test. P values below 0.05 (two sided) were considered statistically significant. R software was used to build and evaluate the prediction nomograms.
3. RESULTS
3.1. Clinical and pathological characteristics
The baseline information of the training and validation cohorts is shown in Table 1. Fifty of 137 (36.5%) patients in the training cohort and 18 of 59 (30.51%) patients in the validation cohort were diagnosed with PCa after PBs. There was no significant difference between two cohorts for the positive ratio of PB pathology (p = 0.419). In addition, other clinic‐pathological characteristics were also comparable between two cohorts (all p > 0.05).
Table 1.
Baseline characteristics of patients in the training and validation cohorts
| Training cohort | Validation cohort | p value | |
|---|---|---|---|
| Age, years, median (IQR) | 67.0 (63.0, 72.0) | 65.0 (61.0, 72.0) | 0.297 |
| tPSA, ng/ml, median (IQR) | 11.6 (8.3, 15.0) | 10.2 (8.2, 13.4) | 0.213 |
| fPSA, ng/ml, median (IQR) | 1.5 (0.9, 2.3) | 1.3 (0.8, 1.9) | 0.147 |
| %fPSA, median (IQR) | 0.1 (0.1, 0.2) | 0.1 (0.1, 0.2) | 0.662 |
| Prostate volume, ml, median (IQR) | 45.1 (30.7, 63.0) | 42.6 (32.6, 54.0) | 0.564 |
| PSAD, ng/ml2, median (IQR) | 0.3 (0.2, 0.3) | 0.2 (0.2, 0.3) | 0.596 |
| Radiomics score, median (IQR) | −0.7 (−1.1, −0.2) | −0.6 (−0.9, −0.3) | 0.954 |
| Biopsy cores, n (%) | 0.915 | ||
| 10 | 19 (13.9%) | 7 (11.9%) | |
| 12 | 112 (81.8%) | 49 (83.1%) | |
| ≥13 | 6 (4.4%) | 3 (5.1%) | |
| Positive cores, n (%) | 0.816 | ||
| 1–2 | 15 (30.0%) | 4 (22.2%) | |
| 3–5 | 22 (44.0%) | 9 (50.0%) | |
| ≥6 | 13 (26.0%) | 5 (27.8%) | |
| Gleason scores, n (%) | 0.477 | ||
| 6 | 20 (40.0%) | 10 (55.6%) | |
| 7 | 16 (32.0%) | 5 (27.8%) | |
| ≥8 | 14 (28.0%) | 3 (16.7%) | |
| Nodule location, n (%) | 0.242 | ||
| Left peripheral zone | 62 (45.3%) | 24 (40.7%) | |
| Right peripheral zone | 66 (48.2%) | 34 (57.6%) | |
| Others | 9 (6.6%) | 1 (1.7%) | |
| Nodule pathology, n (%) | 0.419 | ||
| Benign | 87 (63.5%) | 41 (69.5%) | |
| Malignant | 50 (36.5%) | 18 (30.5%) |
Note: Categorical variables are presented as n (%). Continuous variables are described as median (interquartile range [IQR]). Statistically significant at alpha = 0.05.
Abbreviations: fPSA, free prostate‐specific antigen; IQR, interquartile range; %fPSA, percent free prostate‐specific antigen; PSAD, prostate‐specific antigen density; tPSA, total prostate‐specific antigen.
3.2. Development of the clinical and integrated nomogram
After feature extraction, 1044 radiomics features in total were subjected to the subsequent screening and five potential predictors were identified using the LASSO regression model based on the training cohort (Figure 3). These five features were presented in the radiomics score formula (Supporting Information: S3). The radiomics score of each nodule in the training and validation cohorts was calculated using this formula. There was no significant difference between two cohorts for the distribution of the radiomics score (Table 1, p = 0.954). According to the univariate and multivariate logistic regression analysis in the training cohort, age, the tPSA level, prostate volume, and the radiomics score were independent factors for pre‐biopsy prediction of PCa (Table 2, all p < 0.05). Therefore, age, the tPSA level, and prostate volume were selected to develop the clinical nomogram (Figure 4A). Radiomics score, age, the tPSA level, and prostate volume were selected to develop the integrated nomogram (Figure 4C).
Figure 3.
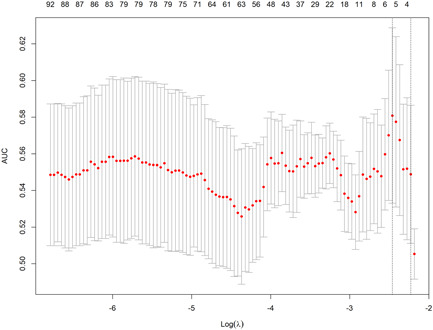
Radiomics feature selection using the least absolute shrinkage and selection operator (LASSO) regression model in the training cohort. The selection of the optimal penalization coefficient lambda (λ) in the LASSO model used the fivefold cross‐validation (CV) process via minimum criteria. The area under the curve (AUC) was plotted versus log (λ). Dotted vertical lines were drawn at the optimal values using the minimum criteria and the 1 standard error of the minimum criteria (the 1−SE criteria). A λ value of 0.0853 with log (λ) −2.46 was chosen, where optimal λ resulted in five nonzero coefficients. [Color figure can be viewed at wileyonlinelibrary.com]
Table 2.
Results of the univariate and multivariate analyses based on the training cohort
| Univariate analysis | Multivariate analyses | |||
|---|---|---|---|---|
| OR (95% CI) | p value | OR (95% CI) | p value | |
| Age (years) | 1.08 (1.02, 1.15) | 0.008 | 1.09 (1.02, 1.16) | 0.017 |
| tPSA (ng/ml) | 1.10 (1.01, 1.20) | 0.033 | 1.15 (1.04, 1.28) | 0.008 |
| fPSA (ng/ml) | 0.89 (0.65, 1.21) | 0.441 | ‐ | ‐ |
| Prostate volume (ml) | 0.98 (0.96, 0.99) | 0.006 | 0.96 (0.94, 0.98) | <0.001 |
| Radiomics score | 2.72 (1.58, 4.68) | <0.001 | 2.87 (1.65, 5.37) | <0.001 |
| Nodule location | ||||
| Left peripheral zone | Reference | ‐ | ‐ | |
| Right peripheral zone | 0.74 (0.36, 1.53) | 0.415 | ‐ | ‐ |
| Others | 1.98 (0.48, 8.11) | 0.343 | ‐ | ‐ |
Note: Factors significant at the 0.10 level in the univariate analysis were included in the multivariate logistic regression analysis. In addition, p values below 0.05 were considered significant in the multivariate analysis.
Abbreviations: CI, confidence interval; fPSA, free prostate‐specific antigen; OR, odds ratio; tPSA, total prostate specific antigen.
Figure 4.
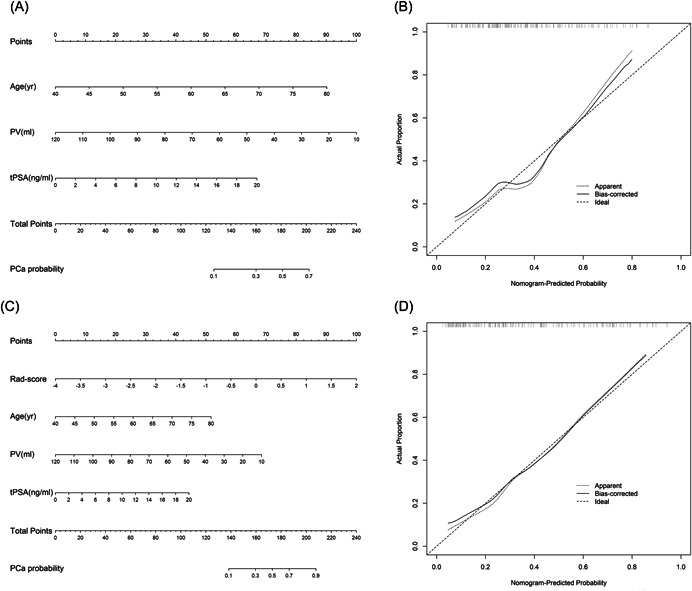
Two nomograms derived from the training cohort (A, C) and their calibration curves derived from the validation cohort (B, D). Both nomograms demonstrated good agreement in detecting the presence of PCa between prediction and observation in the validation cohort. (A) Clinical nomogram based on age, tPSA, and prostate volume. (B) Calibration curve of the clinical nomogram. (C) Integrated nomogram based on age, tPSA, prostate volume, and radiomics score. (D) Calibration curve of the integrated nomogram. PCa, prostate cancer; PV, prostate volume; Rad‐score, radiomics score; tPSA, total prostate‐specific antigen.
3.3. Validation of the clinical and integrated nomogram
3.3.1. Discrimination
ROC curves of the radiomics score, clinical nomogram, and integrated nomogram were plotted to show their discrimination performance in pre‐biopsy prediction of PCa in the training (Figure 5A) and validation (Figure 5B) cohorts, respectively. Table 3 shows the pairwise comparison of their discrimination performance quantified in AUC. The radiomics score yielded an AUC of 0.703 (95% confidence interval [CI], 0.614–0.792) in the training cohort and 0.745 (95% CI, 0.620–0.871) in the validation cohort. In comparison, the clinical nomogram yielded an AUC of 0.751 (95% CI, 0.662–0.839) in the training cohort and 0.752 (95% CI, 0.618–0.886) in the validation cohort. There was no significant difference between the AUCs of the radiomics score and the clinical nomogram in the training and validation cohorts (p = 0.5 and p = 0.9, respectively). When integrating the radiomics score and the clinical nomogram into the integrated nomogram, the discrimination performance was significantly increased from 0.751 to 0.815 in the training cohort (p = 0.04). This significant improvement was also confirmed in the validation cohort (the AUC was improved from 0.752 to 0.835, p = 0.04), which demonstrated the incremental value of the radiomics score for pre‐biopsy prediction of PCa.
Figure 5.
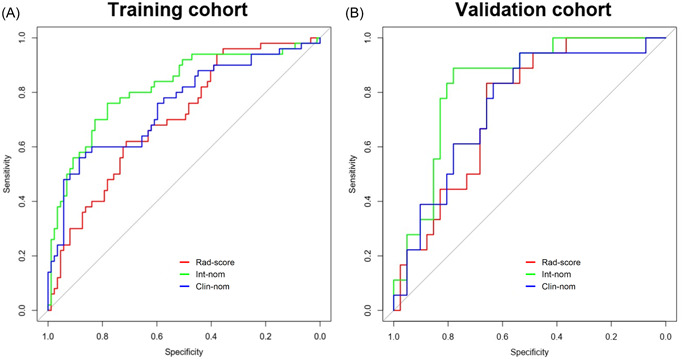
Receiver operating characteristic (ROC) curves of the integrated nomogram (green line), clinical nomogram (blue line), and radiomics score (red line) developed from the training (A) and validation (B) cohorts. Clin‐nom, clinical nomogram; Int‐nom, integrated nomogram; Rad‐score, radiomics score. [Color figure can be viewed at wileyonlinelibrary.com]
Table 3.
AUC of the radiomics score and prediction nomograms
| Training cohort (n = 137) | Validation cohort (n = 59) | |||
|---|---|---|---|---|
| AUC (95% CI) | p value | AUC (95% CI) | p value | |
| Rad‐score | 0.703 (0.614, 0.792) | 0.745 (0.620, 0.871) | ||
| Clin‐nom | 0.751 (0.662, 0.839) | 0.752 (0.618, 0.886) | ||
| Int‐nom | 0.815 (0.737, 0.893) | 0.835 (0.729, 0.941) | ||
| Rad‐score vs. Clin‐nom | 0.5 | 0.9 | ||
| Rad‐score vs. Int‐nom | 0.006 | 0.2 | ||
| Clin‐nom vs. Int‐nom | 0.04 | 0.04 | ||
Note: Clinical nomogram, combined with age, tPSA, and prostate volume; Integrated nomogram, combined with age, tPSA, prostate volume, and radiomics score.
Abbreviations: AUC, area under curve; CI, confidence interval; Clin‐nom, clinical nomogram; Int‐nom, integrated nomogram; Rad‐score, radiomics score.
3.4. Calibration and clinical usefulness
The calibration curves of the clinical nomogram and the integrated nomogram derived from the validation cohort are shown in Figure 4B and Figure 4D, respectively. Both two prediction nomograms demonstrated good agreement in detecting the presence of PCa between prediction and observation. Furthermore, the DCA was performed to evaluate the clinical usefulness of the two nomograms in the validation cohort (Figure 6). The integrated nomogram was superior to the clinical nomogram with a higher net benefit at almost any given threshold probability >10% (Figure 6). Numbers of biopsies performed according to different nomogram‐derived probability cut‐offs in two nomograms were shown in Supporting Information: Table S1. Using of integrated nomogram would significantly reduce unnecessary PBs.
Figure 6.
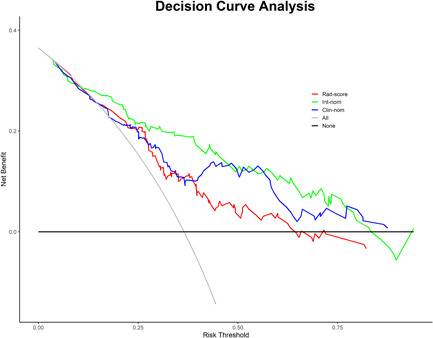
Decision curve analysis (DCA) derived from the validation cohort. The y‐axis measures the net benefit. The net benefit is determined by calculating the difference between the expected benefit and the expected harm associated with each proposed model [net benefit = true positive rate − (false positive rate × weighting factor), weighting factor = threshold probability/(1 − threshold probability)]. The gray line represents the assumption that all nodules were malignant (the treat‐all scheme). The black line represents the assumption that all nodules were benign (the treat‐none scheme). If the threshold probability was >10%, using the integrated nomogram (green line) to predict the presence of PCa added more benefit for patients than using the clinical nomogram (blue line). Int‐nom, integrated nomogram; Clin‐nom, clinical nomogram; Rad‐score, radiomics score. [Color figure can be viewed at wileyonlinelibrary.com]
4. DISCUSSION
In the present study, we used the data of patients who underwent initial PBs to develop and validate a TRUS radiomics‐based nomogram for PCa prediction. The integrated nomogram with the inclusion of radiomics score and clinical risk factors (age, tPSA, and prostate volume) significantly outperformed the clinical nomogram in pre‐biopsy prediction of PCa.
The present study identified age, tPSA, and prostate volume as independent predictors for PCa presence. The clinical nomogram incorporating these three conventional clinical variables yielded an AUC of 0.752 in our cohort, which was in line with the previous study. Hansen et al. 26 developed a biopsy nomogram based on age, tPSA, prostate volume, and DRE results in a cohort with 693 participants, demonstrating an AUC of 0.736 in PCa prediction. Similarly, Chun et al. 7 constructed a nomogram based on age, tPSA, %fPSA, DRE results, and sampling density in 2900 men, demonstrating an AUC of 0.767 in pre‐biopsy prediction of PCa. The prediction accuracy of nomograms based on conventional clinical risk factors is far from satisfactory. Several novel prostate‐specific biomarkers have shown incremental value in PCa screening. For example, Hansen et al. 26 reported a new nomogram with the inclusion of PCA3, which significantly increase the prediction accuracy from 0.736 to 0.803.
Apart from cancer‐related biomarkers, noninvasive imaging techniques also play an increasingly important role in pre‐biopsy PCa screening. Currently, US and multiparametric MRI (mp‐MRI) are the most common imaging techniques used in PCa diagnosis. The European Association of Urology has recommended the use of pre‐biopsy mp‐MRI in the diagnostic pathway considering its excellent performance in PCa detection and staging. However, the broader clinical access of mp‐MRI has been significantly restricted due to its prohibitively high cost. Compared to MRI, US is a cost‐effective and portable diagnostic modality, making it widely available in clinical practice. The grayscale TRUS has limited efficacy in PCa diagnosis with sensitivity and specificity generally reported to be around 17‐57% and 40%–63%. 27 Jeong et al. 28 attempted to incorporate US information identified by naked eyes (presence of hypoechoic lesions) into the predictive nomogram and yielded minimal incremental value of AUC, which was only 0.003.
In fact, interpretation and feature extraction of US images are generally based on radiologists’ experience. But many informative features, such as texture features and histogram‐based parameters are beyond visual grayscale. Radiomics is a computer‐aided technique that extract image features in a quantitative manner through computerized algorithms. Previous studies have demonstrated the clinical value of radiomics features in reflecting the microscopic structure and biological behavior of tumor. 20 , 21 , 22 In the present study, we developed a US‐based radiomics score through computerized algorithms. When incorporating the radiomics score into the clinical nomogram, the AUC significantly increased from 0.752 to 0.835, which confirmed the incremental value of radiomics scores in pre‐biopsy prediction of PCa.
Furthermore, application of the integrated nomogram led to a more distinct reduction of unnecessary biopsies relative to the clinical nomogram. It is crucial to avoid unnecessary PBs due to the biopsy‐related complications and severe psychological distress of patients. When applying a nomogram‐derived probability threshold of 20%, use of the integrated nomogram would reduce 14 unnecessary biopsies per 100 patients compared with the scenario that all men undergo PBs. The net reduction of unnecessary biopsies associated with the inclusion of radiomics score was 6 per 100 biopsies. Specifically, when using the integrated nomogram, 61 unnecessary prostate biopsies (48%) could be avoided and only 5 patients with PCa (7%) would be missed. In comparison, using the clinical nomogram, 44 unnecessary prostate biopsies (34%) could be avoided and 6 patients with PCa (9%) would be missed. Taken together, the novel integrated nomogram strikes a good balance between reducing unnecessary PBs and missing detection of PCa.
Despite these encouraging findings, there are still several limitations in our study. First, as a retrospective study, selection bias was inevitable. Second, our study was performed in a single center with a relatively limited sample size. Although the reproducibility of the nomograms was evaluated in the internal validation cohort, further external validation is needed to confirm our findings. Third, due to the limited number of clinically significant PCa (csPCa) in our cohorts, we were not able to develop another nomogram for predicting the presence of csPCa.
5. CONCLUSIONS
In conclusion, we developed a radiomics score based on TRUS images and demonstrated its feasibility in improving accuracy of PCa prediction. With the inclusion of the radiomics score, the novel integrated nomogram compares favorably with the clinical nomogram in pre‐biopsy prediction of PCa. Therefore, the integrated nomogram may be potentially useful for reducing unnecessary biopsies.
CONFLICT OF INTEREST
The authors declare no conflict of interest.
Supporting information
Supplementary information.
ACKNOWLEDGMENTS
We thank all medical staff who generously contributed to this study. All authors have read and approved the final submitted version of the manuscript. This study was supported by the National Natural Science Foundation of China (grant no. 81901849).
Ou W, Lei J, Li M, et al. Ultrasound‐based radiomics score for pre‐biopsy prediction of prostate cancer to reduce unnecessary biopsies. The Prostate. 2023;83:109‐118. 10.1002/pros.24442
Wei Ou, Jiahao Lei, and Minghao Li contributed equally to this work.
Contributor Information
Junlong Zhang, Email: zhangjlong@mail.sysu.edu.cn.
Zongren Wang, Email: wangzr27@mail.sysu.edu.cn.
DATA AVAILABILITY STATEMENT
Data available on request from the corresponding author.
REFERENCES
- 1. Siegel RL, Miller KD, Fuchs HE, Jemal A. Cancer statistics, 2021. CA Cancer J Clin. 2021;71(1):7‐33. [DOI] [PubMed] [Google Scholar]
- 2. Mottet N, Bellmunt J, Bolla M, et al. EAU‐ESTRO‐SIOG guidelines on prostate cancer. part 1: screening, diagnosis, and local treatment with curative intent. Eur Urol. 2017;71(4):618‐629. [DOI] [PubMed] [Google Scholar]
- 3. Scattoni V, Zlotta A, Montironi R, Schulman C, Rigatti P, Montorsi F. Extended and saturation prostatic biopsy in the diagnosis and characterisation of prostate cancer: a critical analysis of the literature. Eur Urol. 2007;52(5):1309‐1322. [DOI] [PubMed] [Google Scholar]
- 4. Presti JC Jr, O'Dowd GJ, Miller MC, Mattu R, Veltri RW. Extended peripheral zone biopsy schemes increase cancer detection rates and minimize variance in prostate specific antigen and age related cancer rates: results of a community multi‐practice study. J Urol. 2003;169(1):125‐129. [DOI] [PubMed] [Google Scholar]
- 5. Kawakami S, Kihara K, Fujii Y, Masuda H, Kobayashi T, Kageyama Y. Transrectal ultrasound‐guided transperineal 14‐core systematic biopsy detects apico‐anterior cancer foci of T1c prostate cancer. Int J Urol. 2004;11(8):613‐618. [DOI] [PubMed] [Google Scholar]
- 6. Loeb S, Vellekoop A, Ahmed HU, et al. Systematic review of complications of prostate biopsy. Eur Urol. 2013;64(6):876‐892. [DOI] [PubMed] [Google Scholar]
- 7. Chun FKH, Briganti A, Graefen M, et al. Development and external validation of an extended 10‐core biopsy nomogram. Eur Urol. 2007;52(2):436‐444. [DOI] [PubMed] [Google Scholar]
- 8. Sooriakumaran P, John M, Christos P, et al. Models to predict positive prostate biopsies using the Tyrol screening study. Urology. 2011;78(4):924‐929. [DOI] [PubMed] [Google Scholar]
- 9. Zaytoun OM, Kattan MW, Moussa AS, Li J, Yu C, Jones JS. Development of improved nomogram for prediction of outcome of initial prostate biopsy using readily available clinical information. Urology. 2011;78(2):392‐398. [DOI] [PubMed] [Google Scholar]
- 10. Grönberg H, Adolfsson J, Aly M, et al. Prostate cancer screening in men aged 50‐69 years (STHLM3): a prospective population‐based diagnostic study. Lancet Oncol. 2015;16(16):1667‐1676. [DOI] [PubMed] [Google Scholar]
- 11. Parekh DJ, Punnen S, Sjoberg DD, et al. A multi‐institutional prospective trial in the USA confirms that the 4Kscore accurately identifies men with high‐grade prostate cancer. Eur Urol. 2015;68(3):464‐470. [DOI] [PubMed] [Google Scholar]
- 12. Wei JT, Feng Z, Partin AW, et al. Can urinary PCA3 supplement PSA in the early detection of prostate cancer? J Clin Oncol. 2014;32(36):4066‐4072. [DOI] [PMC free article] [PubMed] [Google Scholar]
- 13. Ahmed HU, El‐Shater Bosaily A, Brown LC, et al. Diagnostic accuracy of multi‐parametric MRI and TRUS biopsy in prostate cancer (PROMIS): a paired validating confirmatory study. Lancet. 2017;389(10071):815‐822. [DOI] [PubMed] [Google Scholar]
- 14. Postema A, Mischi M, de la Rosette J, Wijkstra H. Multiparametric ultrasound in the detection of prostate cancer: a systematic review. World J Urol. 2015;33(11):1651‐1659. [DOI] [PMC free article] [PubMed] [Google Scholar]
- 15. Sauvain JL, Palascak P, Bourscheid D, et al. Value of power Doppler and 3D vascular sonography as a method for diagnosis and staging of prostate cancer. Eur Urol. 2003;44(1):21‐30. Discussion 30‐1. [DOI] [PubMed] [Google Scholar]
- 16. Gillies RJ, Kinahan PE, Hricak H. Radiomics: images are more than pictures, they are data. Radiology. 2016;278(2):563‐577. [DOI] [PMC free article] [PubMed] [Google Scholar]
- 17. Limkin EJ, Sun R, Dercle L, et al. Promises and challenges for the implementation of computational medical imaging (radiomics) in oncology. Ann Oncol. 2017;28(6):1191‐1206. [DOI] [PubMed] [Google Scholar]
- 18. Huang YQ, Liang CH, He L, et al. Development and validation of a radiomics nomogram for preoperative prediction of lymph node metastasis in colorectal cancer. J Clin Oncol. 2016;34(18):2157‐2164. [DOI] [PubMed] [Google Scholar]
- 19. Lambin P, Leijenaar R, Deist TM, et al. Radiomics: the bridge between medical imaging and personalized medicine. Nat Rev Clin Oncol. 2017;14(12):749‐762. [DOI] [PubMed] [Google Scholar]
- 20. Zheng X, Yao Z, Huang Y, et al. Deep learning radiomics can predict axillary lymph node status in early‐stage breast cancer. Nat Commun. 2020;11(1):1236. [DOI] [PMC free article] [PubMed] [Google Scholar]
- 21. Liang J, Huang X, Hu H, et al. Predicting malignancy in thyroid nodules: Radiomics Score versus 2017 American College of Radiology Thyroid Imaging, Reporting and Data System. Thyroid. 2018;28(8):1024‐1033. [DOI] [PubMed] [Google Scholar]
- 22. Hu H‐T, Wang Z, Huang XW, et al. Ultrasound‐based radiomics score: a potential biomarker for the prediction of microvascular invasion in hepatocellular carcinoma. Eur Radiol. 2019;29(6):2890‐2901. [DOI] [PubMed] [Google Scholar]
- 23. Sauerbrei W, Royston P, Binder H. Selection of important variables and determination of functional form for continuous predictors in multivariable model building. Stat Med. 2007;26(30):5512‐5528. [DOI] [PubMed] [Google Scholar]
- 24. Coutant C, Olivier C, Lambaudie E, et al. Comparison of models to predict nonsentinel lymph node status in breast cancer patients with metastatic sentinel lymph nodes: a prospective multicenter study. J Clin Oncol. 2009;27(17):2800‐2808. [DOI] [PubMed] [Google Scholar]
- 25. Vickers AJ, Cronin AM, Elkin EB, Gonen M. Extensions to decision curve analysis, a novel method for evaluating diagnostic tests, prediction models and molecular markers. BMC Med Inform Decis Mak. 2008;8:53. [DOI] [PMC free article] [PubMed] [Google Scholar]
- 26. Hansen J, Auprich M, Ahyai SA, et al. Initial prostate biopsy: development and internal validation of a biopsy‐specific nomogram based on the prostate cancer antigen 3 assay. Eur Urol. 2013;63(2):201‐209. [DOI] [PubMed] [Google Scholar]
- 27. Sedelaar JP, Vijverberg PL, De Reijke TM, et al. Transrectal ultrasound in the diagnosis of prostate cancer: state of the art and perspectives. Eur Urol. 2001;40(3):275‐84. [DOI] [PubMed] [Google Scholar]
- 28. Jeong IG, Lim JH, Hwang SS, et al. Nomogram using transrectal ultrasound‐derived information predicting the detection of high grade prostate cancer on initial biopsy. Prostate Int. 2013;1(2):69‐75. [DOI] [PMC free article] [PubMed] [Google Scholar]
Associated Data
This section collects any data citations, data availability statements, or supplementary materials included in this article.
Supplementary Materials
Supplementary information.
Data Availability Statement
Data available on request from the corresponding author.


