Abstract
A total of 2160 thermal conductivity data points, measured using a transient hot-wire instrument, are reported for binary mixtures of R-134a, R-1234yf, and R-1234ze(E) refrigerants from 200 to 340 K to pressures of 12 MPa for mixtures containing R-1234yf and to 50 MPa for R-134a/1234ze(E) mixtures. Data are reported at compositions of approximately (0.33/0.67) mole fraction and (0.67/0.33) mole fraction for each binary mixture investigated. The estimated relative expanded uncertainty of the thermal conductivity measurements is less than 2%. The data are used to refit binary interaction parameters for the Extended Corresponding States (ECS) model implemented in REFPROP (version 10.0). Additionally, the data in this study are used to assess the performance of a generalized entropy scaling model for refrigerants. Finally, the strengths and weaknesses of the ECS and entropy scaling models are compared.
Graphical Abstract
1. INTRODUCTION
Knowledge of refrigerant thermophysical properties is critical for the effective design of refrigeration systems. As described by McLinden and Huber,1 the search for new refrigerants has been driven by increasingly stringent regulations limiting refrigerant toxicity, flammability, ozone depletion potential (ODP), and global warming potential (GWP). Most present-day refrigerants, such as 1,1,1,2-tetrafluoroethane (R-134a), a pure refrigerant, and R-410A, a blend of difluoromethane (R-32) and pentafluoroethane (R-125), are hydrofluorocarbons (HFCs). HFCs typically exhibit low toxicity, flammability, and ODP levels. However, since HFCs are rather stable molecules they have a long atmospheric lifetime manifested by their high GWP values. Hydrofluoroolefins (HFOs) such as 2,3,3,3-tetrafluoropropene (R-1234yf) and trans-1,3,3,3-tetrafluoropropene (R-1234ze(E)) have been proposed to replace current HFC refrigerants. The alkene groups in HFOs result in a reduction in stability and prevent them from accumulating in the atmosphere, yielding significantly lower GWP values than their HFC counterparts. Unfortunately, pure HFO refrigerant performance is generally worse than HFC refrigerants in modern refrigeration systems. Therefore, HFC and HFO refrigerant blends have been proposed as a solution to provide a balance of thermophysical properties that still meet stringent regulations placed on refrigerants.
Brignoli et al.2 describe that thermal conductivity is the most influential transport property impacting the heat transfer coefficient in refrigeration systems. Currently only two experimental studies by Kim et al.3 and Mylona et al.4 report vapor and liquid thermal conductivity data for HFC and HFO blends. Kim et al. report thermal conductivity data for a nearly equimolar mixture of R-1234yf/134a from 255 to 385 K, and Mylona et al. report data for equimolar mixtures of R-1234yf/1234ze(E) from 274 to 414 K and R-134a/1234ze(E) from 274 to 385 K. Both studies are limited in pressure, reporting data near saturation. In the present study, liquid-phase thermal conductivity data are reported for six binary mixtures of R1234yf, R-134a, and R-1234ze(E) at nominal compositions of (0.33/0.67) and (0.67/0.33) mole fraction. The data presented in this paper cover a temperature range of 200 to 340 K up to pressures of 12 MPa for mixtures containing R-1234yf to avoid potential polymerization reactions5 and 50 MPa for the R-134a/1234ze(E) mixtures.
The data reported in the present work allow validation and improvement of available transport property models. The current mixture thermal conductivity model used in the REFPROP (version 10.0)6 program is the extended corresponding states model.7,8 However, Yang et al.9 recently reported a new entropy scaling model which is significantly less computationally complex than the current corresponding states model and may require less fitting of the data to calculate thermal conductivities over a wide range of conditions. The data reported in this study are compared to both the corresponding states and entropy scaling models, and the performance of both modeling approaches are evaluated.
2. MATERIALS AND METHODS
Table 1 lists the pure refrigerants, molar mass, sources, CAS numbers, and manufacturer specified purities for components used to prepare each mixture. Pure refrigerants were degassed before preparing mixtures using a freeze–pump–thaw technique described by Outcalt and Rowane10 in more detail. The mixture preparation procedure is described in the next section, and the transient hot-wire apparatus used to measure the thermal conductivity is described thereafter.
Table 1.
Refrigerant Samples Used in This Study Listed with Molar Masses, Source, CAS Numbers, and Puritya
| Chemical Name | Molar Mass/g·mol−1 | Source | CAS Numbers | Purity/mole fraction |
|---|---|---|---|---|
| 2,3,3,3-tetrafluoropropene (R-1234yf) | 114.04 | Chemours | 754–12-1 | 0.999 |
| 1,1,1,2-tetrafluoroethane (R-134a) | 102.03 | Dupont | 811–97-2 | 0.999 |
| trans-1,3,3,3-tetrafluoropropene (R-1234ze(E)) | 114.04 | Honeywell | 29118–24-9 | 0.9997 |
All samples were degassed using a freeze–pump–thaw method before preparing mixtures. Sample purities were verified through gas chromatography.
2.1. Refrigerant Mixtures.
Liquid refrigerant mixture samples used for this study were prepared gravimetrically using degassed pure refrigerant samples. The liquid mixture sample preparation procedure used in this work is described in detail by Outcalt and Rowane10 and therefore only briefly described here. Liquid mixtures were prepared in 300 mL sample cylinders with the objective of minimizing the vapor space. Limiting the vapor space minimized the difference between the bulk sample and liquid phase compositions when loading the transient hot-wire (THW) system. Flash calculations using the default REFPROP models were performed to quantify the difference between bulk sample and liquid phase compositions. The calculations showed that for all six samples the differences between the bulk and liquid phase compositions were no greater than 0.0003 mole fraction.
The sample cylinder was first evacuated under high vacuum and then weighed using a high-accuracy balance and the double substitution technique of Harris.11 To accurately assess the uncertainty contribution resulting from gravimetric preparation, each weighing was performed up to four times to provide a standard deviation. Calculations with REFPROP6 were used to determine a target mass of each component needed to prepare each mixture while minimizing the vapor space in the sample bottle. Before adding either component to the sample cylinder, the sample and pure component feed cylinders were connected to the mixing manifold and the sample cylinder and manifold were evacuated for at least 5 h. Once evacuated, the sample cylinder was closed off and placed in a dewar filled with liquid nitrogen for at least 30 min. Once sufficiently cooled to freeze the incoming sample, the sample cylinder was removed from liquid nitrogen and placed on a balance. The vacuum system was then isolated from the manifold, and the pure component feed cylinder containing the first component was then opened to fill and pressurize the manifold with the sample. The sample cylinder was then opened to add the first component and by observing the change in the balance reading the target amount of the first component was added. Once the first component was added, it was degassed using the high vacuum system in the same manner that the feed bottles were. The mass of component 1 added was then determined accurately by again using the double substitution weighing procedure with the high-accuracy balance. The second component was then added to the sample bottle using a procedure similar to the one used to add the first component with a few differences. The second component feed and sample cylinders were first connected to the mixing manifold. However, this time the sample bottle remained closed and only the manifold was evacuated again for at least 5 h. Additionally, the sample bottle was placed in a dewar filled with liquid nitrogen, but for up to 2 h to ensure that component 1 was completely frozen. The sample bottle was then taken out of the liquid nitrogen and placed on the balance. The second component was then added, and the balance was again used to track the amount of sample added. Finally, using the high-accuracy balance, the double substitution method was used to accurately determine the mass of component 2 added and the final bulk composition of the prepared binary mixture.
The liquid mixture samples were loaded into the THW system after cooling the apparatus to temperatures slightly below 200 K. The sample cylinders containing the liquid mixture samples were inverted and heated to both ensure only liquid sample was introduced to the filling lines connected to the hotwire cell and increase the loading pressure to prevent fractionation in portions of the filling lines outside the cryostat that were at room temperature. This loading procedure ensured that no fractionation and demixing of the liquid sample could occur and that measurements were performed a sample of the same composition of the prepared mixture.
Table 2 lists the first and second components, component 1 mole fraction (x1), and the composition’s standard uncertainties, uc(x1), for each mixture. The composition’s standard uncertainty considers contributions from the gravimetric preparation (0.0002 mole fraction), difference between the bulk sample and liquid composition (0.0003 mole fraction), and the impurities of each component (xi · ximpurity). Each contribution was added in quadrature to determine the composition’s standard uncertainties listed in Table 2.
Table 2.
Composition of the Six Binary Mixtures Prepared for This Studya
| Component 1 | Component 2 | x1/mol fraction | u(x1)/mole fraction |
|---|---|---|---|
| R-1234yf | R-1234ze(E) | 0.3234 | 0.0005 |
| R-1234yf | R-1234ze(E) | 0.6424 | 0.0007 |
| R-1234yf | R-134a | 0.3197 | 0.0008 |
| R-1234yf | R-134a | 0.6468 | 0.0008 |
| R-134a | R-1234ze(E) | 0.3337 | 0.0005 |
| R-134a | R-1234ze(E) | 0.6628 | 0.0008 |
Listed are the component 1 mole fraction (x1) and composition’s standard uncertainty (uc(x1)).
2.2. Low-Temperature Transient Hot Wire (THW) Instrument.
The THW instrument is an absolute technique used to measure thermal conductivity. The THW apparatus used in this study is described in detail elsewhere,12 and therefore only a summary of the instrument is provided here. The apparatus described in this study can operate at temperatures ranging from 60 to 340 K and pressures up to 70 MPa. The basis of the THW apparatus comprises two platinum wires of differing lengths, which function as both heating elements and resistance thermometers. The principle of the THW technique is to observe the temperature rise of the wire during a step power pulse through the wire over a short duration. The following equation
| (1) |
relates the measured temperature rise to the ideal temperature rise of an infinite line source where q is the applied power, λ is the thermal conductivity, K is the thermal diffusivity, a is the radius of the wire, C is the exponential of Euler’s constant, and t is the time. The equation for the infinite line source is an ideal scenario assuming a wire of near-zero diameter and infinite length with zero heat capacity and the term is the sum of corrections that are applied to the measured temperature rise. A more in-depth explanation of each correction required is described in the work of Healy et al.13
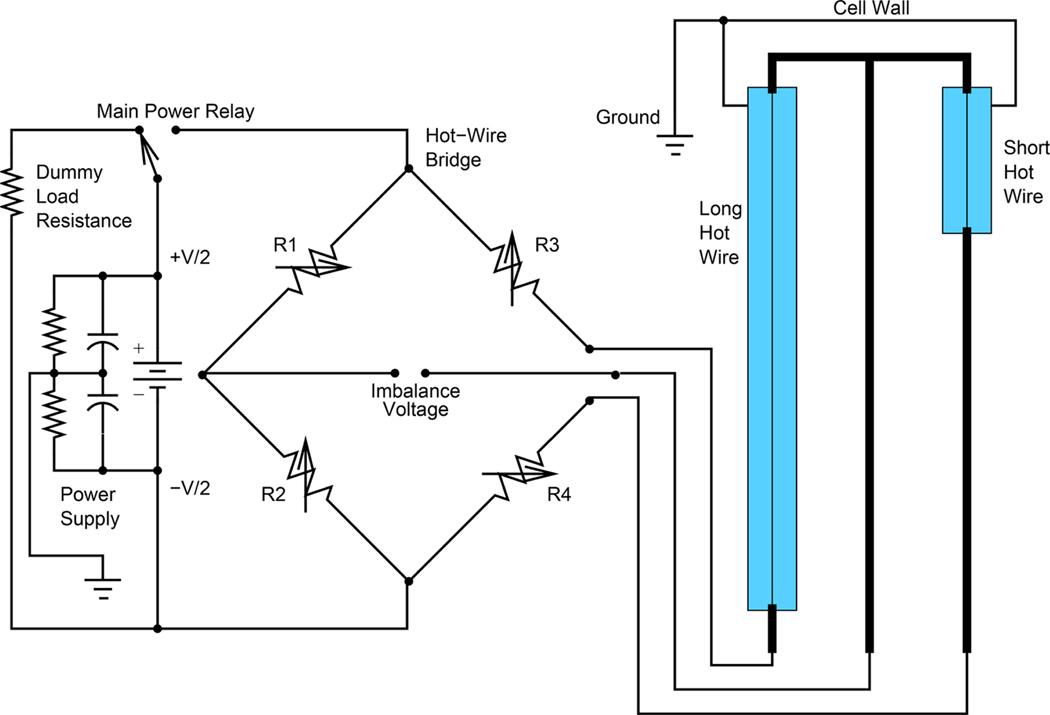
The apparatus consisted of a measuring cell containing the hot wires situated in one arm of a Wheatstone bridge to measure the difference between the long-wire and short-wire resistance increases during heating, a copper pressure vessel rated to 70 MPa, and a cryostat to maintain the temperature. Figure 1 shows the arrangement of the long and short hot wires on the Wheatstone bridge. The two-wire arrangement used in this THW apparatus allows for the elimination of end effects. During measurements, an in situ calibration was performed to correlate the wire resistances to their temperature.
Figure 1.
Circuit diagram of the Wheatstone bridge and long and short hot wire arrangement to measure the difference between long and short hot-wire resistance increases during a thermal conductivity measurement.
Small voltage changes that could not be attributed to the change in the temperature of the wire when using a direct current (DC) power source were observed in this study for refrigerants. Similar behavior was observed by Dietz et al.14 for thermal conductivity measurements for water and alcohols. In the present study, an explanation for this behavior is the generation of electrical charges along the wire surface which may be caused by the ionic impurities which form a double layer on the wire’s surface. A satisfactory solution to prevent the formation of a double layer proposed by Dietz et al. is to use an alternating current (AC) power source in place of a DC power source. Therefore, for all measurements, the heating of the platinum wires was done using a 1000 Hz alternating current (AC) power source to avoid polarization errors that may occur with ionic impurities in the refrigerants studied with bare hot wires.
Measurements were performed over a 1 s period to minimize convective heat transfer and at five temperature rises to rule out any power-level dependency. The data were measured isothermally from 200 to 340 K in 20 K increments. Measurements were performed at up to nine pressures along each isotherm at even density increments. Increasing the system temperature caused the resistance of the long and short wires to increase. Therefore, before starting any measurements the Wheatstone bridge was balanced using decade resistors so that the voltage measured across the bridge read zero. The expanded relative uncertainty of the slope of the line fit to the ideal temperature rise versus the logarithm of time ranged from 0.8% to 3.6%. Typically, the expanded relative uncertainty of this value was lower than 1%. However, for all the measurements performed for this study, the instrument used an alternating current power source which had a limited voltage drive that restricted the magnitude of the temperature rise. This was most notable at the lowest temperatures where the temperature rise was limited to 2 K. A more ideal series of temperature rises at a given starting state point would have ranged from 2 to 4 K. Despite this limitation, the uncertainty for more than 95% of the thermal conductivity data was lower than 2%. The Supporting Information includes the magnitude of contributions to the thermal conductivity uncertainty for the applied heating power per unit length of wire, density of the fluid in the hot wire cell, temperature, and pressure.
3. RESULTS AND DISCUSSION
Thermal conductivity data for binary mixtures of R-1234yf/1234ze(E), R-1234yf/134a, and R-134a/1234ze(E) are reported at temperatures ranging from 200 to 340 K and up to pressures of 12 MPa to avoid potential polymerization of R-1234yf. However, thermal conductivities are reported at temperatures ranging from 200 to 340 K up to 50 MPa for mixtures without R-1234yf. The thermal conductivity data reported in this study are compared to both the extended corresponding states mixture model implemented in REFPROP6 and an entropy scaling model recently reported by Yang et al.9 Here the performance of both models is assessed for future use in later versions of REFPROP.
3.1. Experimental Data.
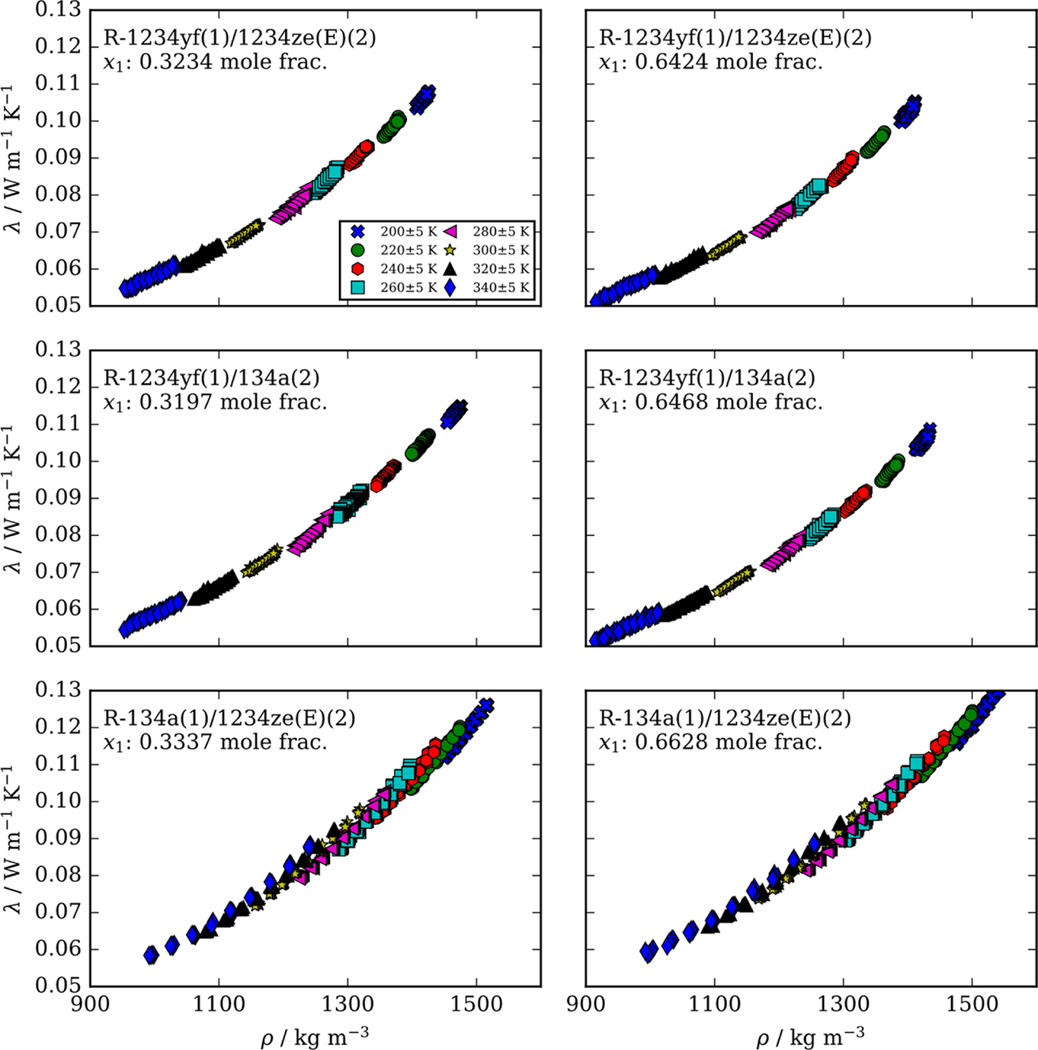
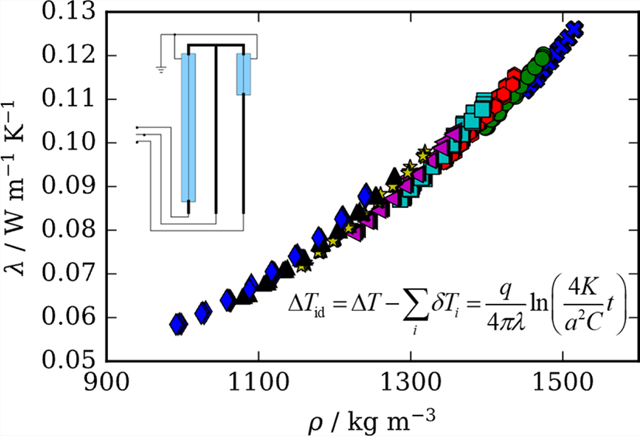
Figure 2 shows the impact of density on the thermal conductivity at several nominal temperatures from 200 to 340 K for the R-1234yf/1234ze(E), R-1234yf/134a, and R-134a/1234ze(E) mixtures at approximate compositions of (0.33/0.67) and (0.67/0.33) mole fraction. As discussed previously, at each initial state point, the thermal conductivity measurement was performed at five different power levels resulting in temperature rises ranging from 1 to 4 K. Thermal conductivities measured at the same initial starting temperature and pressure, but varying power levels, are considered measurements at unique state points. The temperature associated with a particular thermal conductivity measurement is the average wire temperature over the duration of the measurement. Therefore, the different symbols in Figure 2 represent nominal isotherms. The density values used to generate Figure 2 were calculated using mixture models included in REFPROP. Further information on the specifics of the mixture models used to calculate densities are included in the Supporting Information in Table S1. Data tables listing detailed experimental information for each measurement are available in the Supporting Information.
Figure 2.
Effect of density on the thermal conductivity measured in this study for binary mixtures of R1234yf, R134a, and R1234ze(E). The legend in the upper left figure shows the nominal isotherms considered.
3.2. Extended Corresponding States.
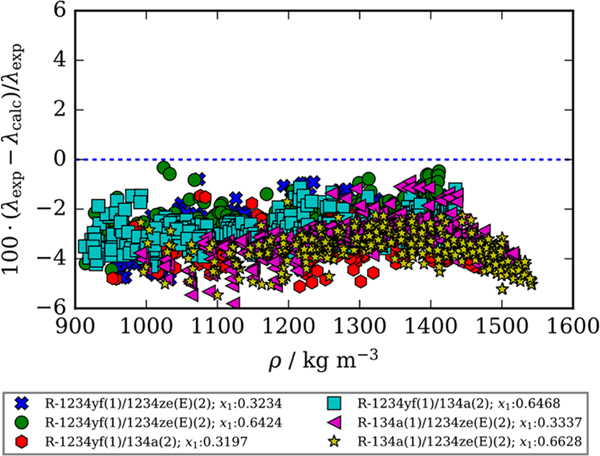
The extended corresponding states (ECS) method described in detail by Chichester and Huber7 and McLinden et al.8 included in REFPROP6 is used to calculate the thermal conductivity values. A deviation plot shown in Figure 3 compares the experimental data for all six binary refrigerant mixtures reported in this study to the available ECS model included in REFPROP as a function of density. Note that for this comparison no adjustments were made to the model currently available in REFPROP. Figure 3 shows a clear negative bias centered at −3% signifying that the ECS model included in REFPROP consistently overpredicts experimental thermal conductivity values.
Figure 3.
Comparison of experimental thermal conductivity values measured in this study, λexp, and those calculated using the extended corresponding states model described by McLinden et al.8 and Chichester and Huber7 without fitted binary interaction parameters as a function of density, λcalc. Compositions listed are mole fractions.
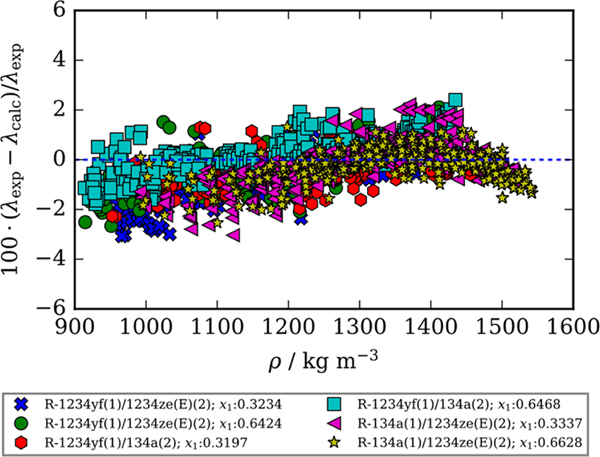
Fitting binary interaction parameters can improve the performance of the ECS model. Figure 4 is a deviation plot comparing the experimental thermal conductivity values for all six binary refrigerant mixtures to the ECS model with adjusted binary interaction parameters as a function of density. Table 3 lists the binary interaction parameters, absolute average deviation values (ΔAAD), defined by eq 2, and maximum deviation values (ΔMAX), defined by eq 3, summarizing the comparison of the experimental thermal conductivities to the ECS model with and without fitted binary interaction parameters. Figure 4 shows that adjusting the binary interaction parameters eliminates the systematic negative deviations seen in Figure 3 for all six binary refrigerant mixtures. An updated “HMX.BNC” file that includes the adjusted binary interaction parameters for each binary mixture can be found in the Supporting Information.
Figure 4.
Comparison of experimental thermal conductivity values measured in this study, λexp, and those calculated using the Extended Corresponding States method described by McLinden et al.8 and Chichester and Huber7 with adjusted binary interaction parameters listed in Table 4 as a function of density, λcalc. Compositions listed are mole fractions.
Table 3.
Statistics of the Fit of Experimental Mixture Data for the R-1234yf/1234ze(E), R-1234yf/134a, and R-134a/1234ze(E) Mixturesa
| Component 1 | Component 2 | k ij,fλ | k ij,hλ | ΔAAD,unfit | ΔMAX,unfit | ΔAAD,fit | ΔMAX,fit |
|---|---|---|---|---|---|---|---|
| R-1234yf | R-1234ze(E) | 0.007 | 0.039 | 2.95 | 5.47 | 0.59 | 2.67 |
| R-1234yf | R-134a | −0.094 | 0.092 | 3.19 | 5.12 | 0.61 | 2.26 |
| R-134a | R-1234ze(E) | −0.076 | 0.086 | 3.38 | 5.81 | 0.57 | 3.04 |
Listed are the binary interaction parameters obtained from the best fit of the data ( and ), and the absolute average deviations and maximum deviations and for the current ECS model included in REFPROP6 (ΔAAD,unfit and ΔMAX,unfit) and the model including fitted binary interaction parameters (ΔAAD,fit and ΔMAX, fit).
| (2) |
| (3) |
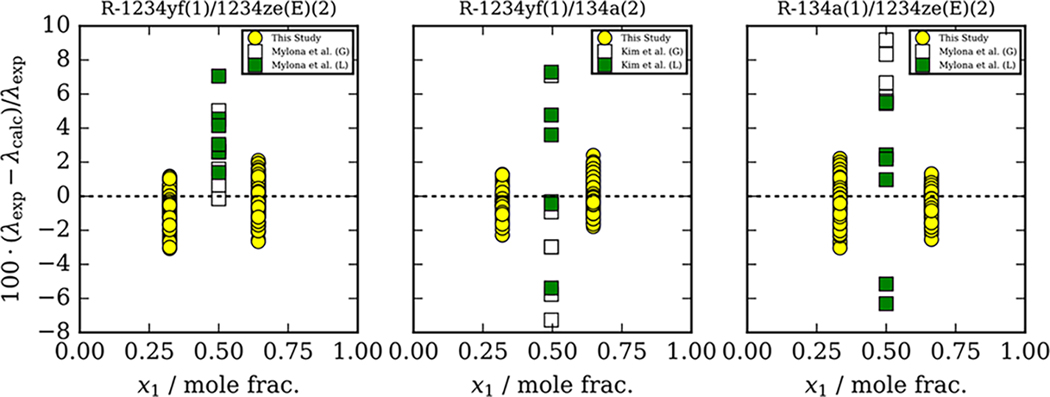
Figure 5 compares thermal conductivity data reported in this study and those reported in the literature to the ECS model with binary interaction parameters fit to the data from the present study as a function of composition. Mylona et al.4 report R-134a/1234ze(E) data in the liquid phase from 275 to 326 K and in the vapor phase from 344 to 403 K and R-1234yf/1234ze(E) data in the liquid phase from 275 to 326 K and in the vapor phase from 344 to 403 K. Thermal conductivity data for the R-1234yf/134a mixture are reported by Kim et al.3 from 255 to 325 K in the liquid phase and from 335 to 385 K in the vapor phase. Unfilled and filled symbols in Figure 5 represent vapor and liquid data points, respectively. Currently, no other thermal conductivity mixture data are available in the literature for comparison. Figure 5 shows that the deviations of the experimental data reported in the present study and those reported by Mylona et al.4 and Kim et al.3 follow the same trend. However, significantly more scatter is seen for the studies of Kim et al.3 and Mylona et al.4 regardless of the fluid phase.
Figure 5.
Comparisons of data reported in the present study and those reported by Mylona et al.4 and Kim et al.3 and to the extended corresponding states model using fitted binary interaction parameters implemented in REFPROP6 as a function of composition. Unfilled and filled symbols designate vapor phase (G) and liquid (L) measurements, respectively.
3.3. Entropy Scaling Model.
The thermal conductivity data obtained in this study are used to test the residual entropy scaling model of Yang et al.9 developed to calculate the thermal conductivity of refrigerants and their mixtures. The residual entropy defined as
| (4) |
is the difference between the entropy, , and the ideal gas entropy, , at the same temperature and molar density. The dimensionless residual entropy is defined by
| (5) |
where R, the molar gas constant, is 8.314462618 J·mol−1·K−1. Molar residual entropy values are calculated using pure component reference EoS for R-1234yf, R-134a, and R1234ze(E) and the applicable mixtures models using REFPROP6 interfaced with the Python package CoolProp 6.4.1.15 In the approach utilized by Yang et al.,9 the macroscopically scaled thermal conductivity,16 λ~, given by
| (6) |
is nondimensionalized using appropriate length, energy, and time dimensions. In eq 6, kB is the Boltzmann constant, ρ is the molar density, NA is Avogadro’s number, and m is the mass of the molecule in kilograms. For mixtures, m is defined as mmix given by
| (7) |
where yi is the mass fraction of component i and mi is the mass of component i. Following from a 1999 study by Rosenfeld17 showing that low-density transport properties of fluids modeled by inverse power law potentials are proportional to (s+)−2/3, Bell et al.18 defined the plus scaled thermal conductivity, λ+:
| (8) |
which is the dimensionless, macroscopically scaled thermal conductivity multiplied by (s+)−2/3. As reported by Bell et al.,18 applying this modification to entropy scaling eliminates the divergence of the macroscopically scaled thermal conductivity at zero density. Additional details for this entropy scaling approach including corrections for critical enhancement can be found elsewhere.9 In this study the generalized refrigerant thermal conductivity model of Yang et al., which does not require any fitting of the new data, is used. The generalized relationship for the thermal conductivity of Yang et al. as a function of the residual entropy is as follows:
| (9) |
where is a fluid-specific scaling parameter. For mixtures, is replaced by which is defined by the simple mixing rule
| (10) |
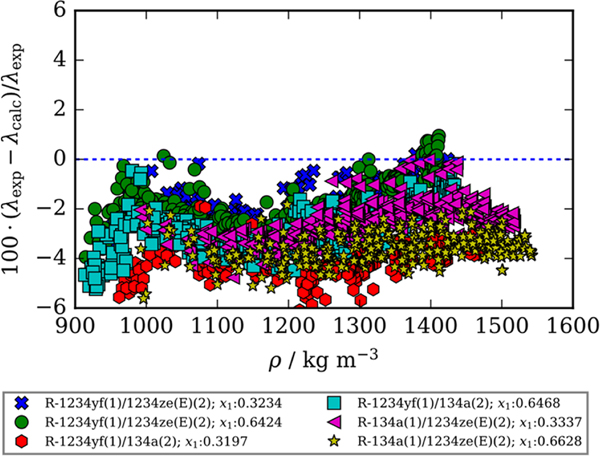
where xi is a mole fraction. Table 4 lists the ni coefficients and parameters for each refrigerant studied here. Figure 6 is a deviation graph comparing experimental thermal conductivity values to those calculated using the generalized entropy scaling model for refrigerants proposed by Yang et al.9 Figure 6 shows that the Yang et al. model exhibits a negative bias when compared to the experimental thermal conductivity values. The general entropy scaling model of Yang et al. reproduces the experimental thermal conductivity values reported in this work with a ΔMAX value of 6.7% with mixture ΔAAD values ranging from 1.7% to 3.2%. Table 5 lists ΔAAD and ΔMAX values for each binary pair studied.
Table 4.
Parameters Needed To Calculate Thermal Conductivity Values Using the Global Thermal Conductivity Entropy Scaling Model Proposed by Yang et al.9
| eq 9 coefficients | |||
|---|---|---|---|
|
| |||
| n 1 | n 2 | n 3 | n 4 |
| 3.636446 | −5.328258 | 4.543762 | −0.643352 |
| Fluid-specific scaling parameters () | |||
| R-134a | 1.0480 | ||
| R-1234yf | 1.0491 | ||
| R-1234ze(E) | 1.0540 | ||
Figure 6.
Comparison of experimental thermal conductivity values, λexp, and the generalized entropy scaling model for refrigerants developed by Yang et al.9 Compositions listed are mole fractions.
Table 5.
Statistics of Comparisons of Experimental Mixture Data to the Generalized Entropy Scaling Model for Refrigerants Developed by Yang et al.9 for the R-1234yf/1234ze(E), R-1234yf/134a, and R-134a/1234ze(E)Mixturesa
| Component 1 | Component 2 | ΔAAD,Yang | ΔMAX,Yang |
|---|---|---|---|
| R-1234yf | R-1234ze(E) | 1.70 | 4.26 |
| R-1234yf | R-134a | 3.21 | 6.69 |
| R-134a | R-1234ze(E) | 2.97 | 5.62 |
Listed are the absolute average deviations and maximum deviation (ΔAAD, Yang and ΔMAX, Yang).
The results shown in Figure 6 and statistics listed in Table 5 show that the entropy scaling approach works remarkably well modeling liquid-phase thermal conductivities for R-1234yf/1234ze(E), R-134a/1234yf, and R-134a/R1234ze(E) refrigerant blends. It is important to note that the entropy scaling model of Yang et al.9 was applied in a purely predictive manner and no adjustments were made to it using the data reported in the present study. Further, Yang et al. report consistently negative deviations for pure R-1234yf and R-1234ze(E) thermal conductivities when comparing to the global entropy scaling model, which was observed here for their mixtures. In this study, no measurements were performed for the vapor phase or in the critical region. However, as shown by Yang et al., the plus-scaled thermal conductivity remains a quasiunivariate function of residual entropy in the dilute gas region. Additionally, Yang et al. show that incorporating a critical enhancement correction can extend the use of entropy scaling to the critical region, even if the uncertainties may be significantly larger. The performance of the unfitted ECS model and entropy scaling model of Yang et al. provided similar performance for thermal conductivity predictions. In principle, the key advantage of the entropy scaling method is that it provides a low computational cost relative to other thermal conductivity models and may minimize the measurements needed to calculate thermal conductivities over large portions of the phase diagram.
4. CONCLUSIONS
Thermal conductivity data for R-1234yf/1234ze(E), R-134a/1234yf, and R-134a/1234ze(E) are reported from 200 to 340 K up to 12 MPa for mixtures containing R-1234yf and up to 50 MPa for the R-134a/1234ze(E) mixtures. The thermal conductivity data reported in this study allow a refinement of the current ECS model available in REFPROP,6 and the reported binary interaction parameters can be incorporated into REFPROP to provide more accurate thermal conductivity calculations. Additionally, the data were used to assess a newer generalized entropy scaling model for refrigerants developed by Yang et al.9 The ECS model without fitted binary interaction parameters and the entropy scaling model of Yang et al. provide similar performance characteristics when calculating thermal conductivity values. However, the use of ECS requires a two-dimensional root-finding problem to obtain the conformal state, which involves a significant computational speed penalty relative to the evaluation of a third-order polynomial in the entropy scaling model.
Supplementary Material
ACKNOWLEDGMENTS
We thank Megan Harries (NIST) and Jason Widegren (NIST) for providing analysis of the pure fluids used to prepare the binary mixtures studied in this work, and Stephanie Outcalt (NIST) for preparing the liquid refrigerant mixture samples studied in this work. This work was supported by the Strategic Environmental Research and Development Program; Project WP19-1385: WP-2740 Follow-On: Low-GWP Alternative Refrigerant Blends for HFC-134a.
Footnotes
ASSOCIATED CONTENT
Supporting Information
The Supporting Information is available free of charge at https://pubs.acs.org/doi/10.1021/acs.iecr.2c01924.
All of the reported thermal conductivity data. (PDF)
HMX.BNC file that contains the fitted binary interaction parameters for each binary mixture studied. (ZIP)
Complete contact information is available at: https://pubs.acs.org/10.1021/acs.iecr.2c01924
The authors declare no competing financial interest.
Commercial equipment, instruments, or materials are identified only to adequately specify certain procedures. Such identification does not imply recommendation or endorsement by the National Institute of Standards and Technology, nor does it imply that the identified products are necessarily the best available for the purpose.
Contributor Information
Aaron J. Rowane, Applied Chemicals and Materials Division, Material Measurement Laboratory, National Institute of Standards and Technology, Boulder, Colorado 80305, United States.
Ian H. Bell, Applied Chemicals and Materials Division, Material Measurement Laboratory, National Institute of Standards and Technology, Boulder, Colorado 80305, United States
Marcia L. Huber, Applied Chemicals and Materials Division, Material Measurement Laboratory, National Institute of Standards and Technology, Boulder, Colorado 80305, United States
Richard A. Perkins, Applied Chemicals and Materials Division, Material Measurement Laboratory, National Institute of Standards and Technology, Boulder, Colorado 80305, United States
REFERENCES
- (1).McLinden MO; Huber ML (R)Evolution of Refrigerants. J. Chem. Eng. Data 2020, 65 (9), 4176–4193. [DOI] [PMC free article] [PubMed] [Google Scholar]
- (2).Brignoli R; Brown JS; Skye HM; Domanski PA Refrigerant performance evaluation including effects of transport properties and optimized heat exchangers. Int. J. Refrig 2017, 80, 52–65. [DOI] [PMC free article] [PubMed] [Google Scholar]
- (3).Kim D; Yang X; Arami-Niya A; Rowland D; Xiao X; Al Ghafri SZS; Tsuji T; Tanaka Y; Seiki Y; May EF Thermal conductivity measurements of refrigerant mixtures containing hydrofluorocarbons (HFC-32, HFC-125, HFC-134a), hydrofluoroolefins (HFO-1234yf), and carbon dioxide (CO2). J. Chem. Thermodyn 2020, 151, 106248. [Google Scholar]
- (4).Mylona SK; Hughes TJ; Saeed AA; Rowland D; Park J; Tsuji T; Tanaka Y; Seiki Y; May EF Thermal conductivity data for refrigerant mixtures containing R1234yf and R1234ze(E). J. Chem. Thermodyn 2019, 133, 135–142. [Google Scholar]
- (5).Richter M; McLinden MO; Lemmon EW Thermodynamic properties of 2,3,3,3-tetrafluoroprop-1-ene (R1234yf): Vapor pressure and p-ρ-T measurements and equation of state. J. Chem. Eng. Data 2011, 56, 3254–3264. [Google Scholar]
- (6).NIST Standard Reference Database 23: Reference Fluid Thermodynamic and Transport Properties-REFPROP, Version 10.0; National Institute of Standards and Technology: Gaithersburg, MD, 2018. [Google Scholar]
- (7).Chichester JC; Huber ML, Documentation and assessment of the transport property model for mixtures implemented in NIST REFPROP (version 8.0) (NISTIR 6650), National Institute of Standards and Technology: Gaithersburg, MD, 2008. [Google Scholar]
- (8).McLinden MO; Klein SA; Perkins RA An extended corresponding states model for the thermal conductivity of pure refrigerants and refrigerant mixtures. Int. J. Refrig 2000, 23 (1), 43–63. [Google Scholar]
- (9).Yang M; Kim D; May EF; Bell IH Entropy Scaling of Thermal Conductivity: Application to Refrigerants and their Mixtures. Ind. Eng. Chem. Res 2021, 60, 13052–13070. [Google Scholar]
- (10).Outcalt SL; Rowane AJ Bubble Point Measurements of Mixtures of HFO and HFC Refrigerants. J. Chem. Eng. Data 2021, 66 (12), 4670–4683. [DOI] [PMC free article] [PubMed] [Google Scholar]
- (11).Harris G. Selected Laboratory and Measurement Practices and Procedures to Support Basic Mass Calibrations (NISTIR 6969); National Institute of Standards and Technology, Gaithersburg, MD, 2019. [Google Scholar]
- (12).Roder HM A transient hot wire thermal conductivity apparatus for fluids. J. Res. Natl. Bur Stand 1981, 86 (5), 457–493. [DOI] [PMC free article] [PubMed] [Google Scholar]
- (13).Healy JJ; de Groot JJ; Kestin J. The theory of the transient hot-wire method for measuring thermal conductivity. Physica 1976, 82, 392–408. [Google Scholar]
- (14).Dietz FJ; de Groot JJ; Franck EU The thermal-conductivity of water to 250°C and 350 MPa. Ber. Bunsenges Phys. Chem 1981, 85 (11), 1005–1009. [Google Scholar]
- (15).Bell IH; Wronski J; Quoilin S; Lemort V. Pure and pseudo-pure fluid thermophysical property evaluation and the opensource thermophysical property library CoolProp. Ind. Eng. Chem. Res 2014, 53 (6), 2498–2508. [DOI] [PMC free article] [PubMed] [Google Scholar]
- (16).Rosenfeld Y. Relation between the transport coefficients and the internal entropy of simple systems. Phys. Rev. A 1977, 15 (6), 2545. [Google Scholar]
- (17).Rosenfeld Y. A quasi-universal scaling law for atomic transport in simple fluids. J. Phys: Cond Matter 1999, 11 (28), 5415. [Google Scholar]
- (18).Bell IH; Messerly R; Thol M; Costigliola L; Dyre JC Modified entropy scaling of the transport properties of the LennardJones fluid. J. Phys. Chem. B 2019, 123 (29), 6345–6363. [DOI] [PMC free article] [PubMed] [Google Scholar]
Associated Data
This section collects any data citations, data availability statements, or supplementary materials included in this article.


