

ABSTRACT
Aim
Epicardial adipose tissue (EAT) may play a role in the pathophysiology of heart failure with preserved ejection fraction (HFpEF). We investigated associations of EAT with proteomics, coronary flow reserve (CFR), cardiac structure and function, and quality of life (QoL) in the prospective multinational PROMIS‐HFpEF cohort.
Methods and results
Epicardial adipose tissue was measured by echocardiography in 182 patients and defined as increased if ≥9 mm. Proteins were measured using high‐throughput proximity extension assays. Microvascular dysfunction was evaluated with Doppler‐based CFR, cardiac structural and functional indices with echocardiography and QoL by Kansas City Cardiomyopathy Questionnaire (KCCQ). Patients with increased EAT (n = 54; 30%) had higher body mass index (32 [28–40] vs. 27 [23–30] kg/m2; p < 0.001), lower N‐terminal pro‐B‐type natriuretic peptide (466 [193–1133] vs. 1120 [494–1990] pg/ml; p < 0.001), smaller indexed left ventricular (LV) end‐diastolic and left atrial (LA) volumes and tendency to lower KCCQ score. Non‐indexed LV/LA volumes did not differ between groups. When adjusted for body mass index, EAT remained associated with LV septal wall thickness (coefficient 1.02, 95% confidence interval [CI] 1.00–1.04; p = 0.018) and mitral E wave deceleration time (coefficient 1.03, 95% CI 1.01–1.05; p = 0.005). Increased EAT was associated with proteomic markers of adipose biology and inflammation, insulin resistance, endothelial dysfunction, and dyslipidaemia but not significantly with CFR.
Conclusion
Increased EAT was associated with cardiac structural alterations and proteins expressing adiposity, inflammation, lower insulin sensitivity and endothelial dysfunction related to HFpEF pathology, probably driven by general obesity. Potential local mechanical or paracrine effects mediated by EAT remain to be elucidated.
Keywords: Heart failure, Echocardiography, Proteomics, Microvascular dysfunction
Introduction
Heart failure (HF) with preserved ejection fraction (HFpEF) accounts for more than half of HF hospitalizations and is associated with poor prognosis. 1 Limited evidence for specific therapies in this setting has been attributed to complex pathophysiology, characterized by disease heterogeneity, caused or exacerbated by cardiac‐related or extracardiac comorbidities. 2 Identifying homogeneous pathophysiological patient subtypes may facilitate developing novel target‐specific therapies. 3
Obesity‐related HFpEF has been identified as a clinically relevant phenotype, characterized by pronounced biventricular remodelling and haemodynamic derangements. 4 Epicardial adipose tissue (EAT), which is related to obesity, 5 may cause systemic inflammation‐dependent microcirculatory dysfunction, thereby resulting in myocardial fibrosis and cardiac remodelling. 2 , 6 , 7 When deposited in excess, EAT may alter myocardial function also by local effects, causing mechanical restraint and intramyocardial fat deposition. 7 EAT is elevated in HFpEF compared with participants without HFpEF 8 and associated with significant haemodynamic aberrations among obese patients. 4 , 9 Additionally, increased EAT is associated with reduced exercise capacity and higher invasive right‐sided filling pressures 10 in HFpEF, although mechanisms are unclear. While recent studies have explored the relationship between increased EAT and cardiac structure, haemodynamic and metabolic profile in HFpEF, 11 information on association with proteomics and coronary microvascular dysfunction is scarce.
We aimed to evaluate associations between EAT and obesity, proteomics, measures of coronary microvascular dysfunction, cardiac structure and function, and quality of life (QoL) in the multinational PROMIS‐HFpEF (Prevalence of Microvascular Dysfunction in HFpEF) cohort.
Methods
Study population
We evaluated EAT in patients enrolled in the prospective, multinational PROMIS‐HFpEF study, which aimed primarily to assess the prevalence of coronary microvascular dysfunction measured by Doppler‐based coronary flow reserve (CFR) in a strictly‐defined international HFpEF cohort and has been described previously. 12 Inclusion criteria included symptomatic HF with New York Heart Association (NYHA) class II–IV, ejection fraction (EF) ≥40%, and at least one of the following: (i) prior hospitalization with evidence of left ventricular (LV) hypertrophy (LV mass index >95 g/m2 in women and >115 g/m2 in men) or left atrial (LA) dilatation (LA volume index [LAVI] >34 ml/m2), (ii) elevated natriuretic peptides (B‐type natriuretic peptide [BNP] outpatient sinus rhythm ≥75 ng/L; atrial fibrillation ≥200 ng/L; hospitalized sinus rhythm ≥125 ng/L; atrial fibrillation ≥350 ng/L, and N‐terminal proBNP [NT‐proBNP] outpatient sinus rhythm ≥300 ng/L; atrial fibrillation ≥750 ng/L; hospitalized sinus rhythm ≥500 ng/L; atrial fibrillation ≥1250 ng/L), (iii) E/e' ratio ≥15, (iv) elevated invasive capillary wedge pressures at rest (>15 mmHg) or with exercise (>25 mmHg). Participants with unrevascularized epicardial coronary disease were excluded. All patients were subject to a comprehensive medical history and physical examination, fasting blood and urine tests, 6‐min walk test (6MWT), EndoPAT (peripheral arterial tonometry), Kansas City Cardiomyopathy Questionnaire overall summary score (KCCQ‐OSS) and comprehensive transthoracic echocardiography which included assessment of coronary microvascular dysfunction. The study complied with the Declaration of Helsinki and was approved by relevant institutional review boards. All participants provided written informed consent.
Echocardiographic evaluation
Comprehensive two‐dimensional, Doppler and tissue Doppler echocardiography was performed with the patient in the left lateral decubitus position using commercially available ultrasound equipment (Vivid 7 or Vivid E9, GE Healthcare, General Electric Corp., Waukesha, WI, USA) and a 2.5 to 3.5 MHz adult probe. Blood pressure readings were taken at the time of the study using a digital blood pressure monitor with a brachial cuff. All images were stored for offline analysis. EAT was measured around the right ventricular free wall in the parasternal long‐axis view and identified as the relatively echo‐free space between the outer wall of the myocardium and the visceral layer of the pericardium. 13 Measurements were averaged across three cycles during end‐systole. Increased EAT was defined as EAT ≥9 mm based on earlier studies employing similar cut‐offs in strictly‐chosen HFpEF cohorts, 9 and in keeping with published threshold values for epicardial fat associated with high metabolic risk in large international populations. 14 Coronary microvascular dysfunction was assessed using transthoracic Doppler‐derived adenosine CFR as per validated protocol. 15 Cardiac structure and function were evaluated in keeping with the American Society of Echocardiography (ASE)/European Association of Cardiovascular Imaging (EACVI) recommendations. 16 Non‐invasive pressure–volume analysis was performed using echocardiographic and blood pressure data. 17
Biomarker assays
Fasting blood samples were drawn from participants in a stable, euvolaemic state, collected in EDTA tubes, immediately centrifuged at 4°C and stored in aliquots at −70°C until analysis. Both NT‐proBNP and creatinine were analysed locally. Biomarker analysis was performed using three 92‐plex high‐throughput proximity extension assays (Olink Proseek Multiplex CVD II and III, and inflammation 96x96), representing 266 unique biomarkers. Estimated glomerular filtration rate (eGFR) was calculated from creatinine according to the Chronic Kidney Disease Epidemiology Collaboration except in the orthogonal partial least squares discriminant analysis (OPLS‐DA) where a combined creatinine–cystatin C equation was used. 18
Statistics
Continuous data are presented as median (interquartile range [IQR]) and categorical data as number (percent) unless otherwise specified. Comparisons between patients with EAT <9 versus ≥9 mm were performed using the Mann–Whitney U test or Fisher's exact test as appropriate. Ancillary analysis was performed in patients with EF ≥50%. The association between EAT (as a continuous variable) and body mass index (BMI) was analysed with Pearson's correlation. Linear regression was performed to assess associations between echocardiographic parameters and EAT (dependent variable) crude and adjusted for BMI (since EAT is expected to correlate with BMI). Echocardiographic variables with a p‐value <0.10 in the comparison between patients with high (≥9 mm) versus low (<9 mm) EAT were selected for linear regression analysis, as were CFR, reactive hyperaemia index from EndoPAT, KCCQ‐OSS, and 6MWT distance. Depending on distribution, some variables were log‐transformed before analysis and coefficients and confidence intervals (CI) for these variables were exponentiated for ease of interpretation. Potential effect modification by sex and interaction term (epicardial fat#sex) was added to the BMI‐adjusted model and p‐values for interaction were presented. Normality was tested through the Shapiro–Wilk test and Q–Q residual plots. Only non‐indexed echocardiographic variables were adjusted for BMI to avoid double adjustment for body size area and mass. Tests were performed at 95% CIs, and a two‐sided p‐value ≤0.05 was considered statistically significant. STATA version 14.2 (Stata Corp., College Station, TX, USA) was employed for analysis.
Characteristics of patients with EAT <9 mm versus ≥9 mm and identification of most discriminative variables was performed employing discriminant analysis (OPLS‐DA, SIMCA 15, Satorius Stedim Data Analytics AB; Umeå, Sweden) on all 622 variables recorded for the participants. The default SIMCA threshold for missing values tolerance was used, meaning that only participants and variables with less than 50% missing data were included in the analysis, leaving 579 variables from 172 participants. The analysis bilinearizes a data matrix into scores and loading vectors, which represent participants and variables, respectively. Loading values expressed as correlation coefficients describe the discriminating importance of the variable between the two groups along the x‐axis, and the variation independent of the groups on the orthogonal y‐axis. The strongest descriptors are represented by variables with the highest numerical correlation coefficients along the x‐axis and the lowest correlation coefficients on the y‐axis. Modelling includes iterative removal of one seventh of the data matrix (full jack‐knife cross‐validation) as a robustness measurement (predictivity). To dissect variables that were associated with EAT but not with general adiposity, we also performed OPLS‐DA models comparing variables significantly associated with BMI ≥30 kg/m2 to those significantly associated with EAT ≥9 mm.
Results
Epicardial adipose tissue could be measured by echocardiography in 182 (90%) of 202 patients who underwent successful CFR testing. Median (IQR) EAT in the entire cohort was 7 (6–9) mm. EAT was moderately and significantly correlated with BMI (r = 0.49, p < 0.001).
Patient characteristics
Table 1 shows patient characteristics stratified according to EAT categories. Patients with increased EAT (≥9 mm; n = 54) were younger, more obese, had larger waist circumference, higher glycated hameoglobin (HbA1c) and triglyceride concentrations in addition to lower high‐density lipoprotein (HDL) and NT‐proBNP when compared with EAT <9 mm (n = 128). They also had greater diuretic use as compared with those with lower EAT. There was no difference in distribution of patients with mildly reduced EF between the high and low EAT groups (13 [10%] vs. 4 [7%], p = 0.780). Online supplementary Table S1 shows the results of supplementary analysis comparing EAT subgroups in non‐obese (BMI <30 kg/m2) and obese participants (BMI ≥30 kg/m2) separately. Among obese and non‐obese patients, those with increased EAT had higher BMI and worse lipid profiles represented by more elevated total cholesterol and low‐density lipoprotein (LDL). Online supplementary Table S 4 displays patient characteristics in those with EF ≥50% (n = 162) stratified by EAT thickness. This sub‐analysis in HFpEF patients employing stricter EF criteria demonstrated largely similar trends in comparisons as the main analysis.
Table 1.
Baseline characteristics according to epicardial adipose tissue <9 mm versus ≥9 mm
| EAT <9 mm (n = 128, 70%) | EAT ≥9 mm (n = 54, 30%) | p‐value | |
|---|---|---|---|
| EAT (mm) | 6.0 (6.0–7.0) | 10.0 (9.0–11.0) | <0.001 |
| Age (years) | 76 (70–82) | 73 (68–77) | 0.026 |
| Female sex | 59 (46) | 23 (43) | 0.74 |
| Heart rate (bpm) | 66 (60–77) | 68 (62–80) | 0.38 |
| Body mass index (kg/m2) | 26.6 (22.9–29.8) | 32.0 (28.1–40.0) | <0.001 |
| Waist circumference (cm) | 96 (88–106) | 108 (98–120) | <0.001 |
| Systolic blood pressure (mmHg) | 140 (128–156) | 135 (126–150) | 0.11 |
| Diastolic blood pressure (mmHg) | 80 (70–88) | 75 (63–83) | 0.018 |
| NYHA class (I/II/III/IV) | 1/95/31/1 (1/74/24/1) | 0/43/11/0 (0/80/20/0) | 0.79 |
| Comorbidities | |||
| Atrial fibrillation/flutter | 69 (54) | 25 (46) | 0.42 |
| Hypertension | 108 (84) | 43 (80) | 0.52 |
| Diabetes | 35 (27) | 17 (32) | 0.59 |
| Hyperlipidaemia | 71 (56) | 32 (59) | 0.74 |
| Current smoker | 5 (4) | 1 (2) | 0.67 |
| Cardiovascular disease other than HF | 47 (37) | 20 (37) | 1.00 |
| Laboratory | |||
| Haemoglobin (g/L) | 128 (117–140) | 132 (122–141) | 0.41 |
| Haemoglobin A1c (mmol/mol) | 40.0 (37.0–44.0) | 44.0 (38.0–57.0) | 0.049 |
| eGFR (ml/min/1.73 m2) | 62 (48–75) | 57 (40–68) | 0.078 |
| NT‐proBNP (pg/ml) | 1120 (494–1990) | 466 (193–1133) | <0.001 |
| Cholesterol (mmol/L) | 4.1 (3.4–4.8) | 4.2 (3.5–5.3) | 0.27 |
| Triglycerides (mmol/L) | 1.0 (0.8–1.4) | 1.3 (1.0–1.9) | 0.008 |
| Apolipoprotein A (mmol/L) | 1.4 (1.2–1.7) | 1.4 (1.2–1.6) | 0.42 |
| Apolipoprotein B (mmol/L) | 0.8 (0.6–0.9) | 0.9 (0.7–1.1) | 0.007 |
| LDL (mmol/L) | 2.1 (1.6–2.9) | 2.3 (1.8–3.3) | 0.081 |
| HDL (mmol/L) | 1.4 (1.1–1.8) | 1.2 (1.0–1.4) | 0.006 |
| CRP (mg/L) | 2.0 (0.9–4.6) | 2.8 (1.3–6.1) | 0.17 |
| Uric acid (mg/L) | 385 (318–466) | 420 (373–551) | 0.011 |
| BUN (mmol/L) | 7.5 (5.9–9.0) | 8.4 (6.4–12.0) | 0.058 |
| Medications | |||
| Beta‐blocker | 95 (74) | 38 (70) | 0.59 |
| ACEi/ARB | 99 (77) | 38 (70) | 0.35 |
| Diuretics | 91 (71) | 47 (87) | 0.023 |
| Glucose‐lowering therapy | 30 (23) | 17 (32) | 0.27 |
Values are given as median (interquartile range) or n (%).
ACEi, angiotensin‐converting enzyme inhibitor; ARB, angiotensin receptor blocker; BUN, blood urea nitrogen; CRP, C‐reactive protein; EAT, epicardial adipose tissue; eGFR, estimated glomerular filtration rate (Chronic Kidney Disease Epidemiology Collaboration formula); HDL, high‐density lipoprotein; HF, heart failure; LDL, low‐density lipoprotein; NT‐proBNP, N‐terminal pro B‐type natriuretic peptide; NYHA, New York Heart Association.
Descriptive comparisons: echocardiography, coronary flow reserve and quality of life
Table 2 shows that patients with increased EAT demonstrated smaller indexed LV volumes on echocardiography with higher EF when compared with EAT <9 mm. However, absolute values were similar in patients with EAT ≥9 mm versus <9 mm. Patients with increased EAT showed lower early diastolic myocardial velocities and higher right ventricular E/e'. Online supplementary Table S 2 shows that even among non‐obese participants, EAT ≥9 mm displayed signs of LV hypertrophy reflected in thicker interventricular septum and elevated filling pressures as represented by higher LV E/e'. No significant differences in CFR were observed between the EAT ≥9 mm versus <9 mm groups in the total cohort (Table 2 ) or subgroup analysis (online supplementary Table S 2 ) (p > 0.05 for all comparisons). KCCQ‐OSS was non‐significantly lower in participants with increased EAT (p = 0.07). When patients with LVEF ≥50% were analysed, comparison between echocardiographic variables in this sub‐analysis were largely consistent with what was seen in the total cohort. CFR was not significantly different between normal and elevated EAT subgroups. KCCQ‐OSS, however, was significantly lower in the high EAT subgroup (p = 0.04) (online supplementary Table S 5 ).
Table 2.
Echocardiographic and functional parameters according to epicardial adipose tissue <9 mm versus ≥9 mm
| EAT <9 mm (n = 128,70%) | EAT ≥9 mm (n = 54,30%) | p‐value | |
|---|---|---|---|
| EAT (mm) | 6.0 (6.0–7.0) | 10.0 (9.0–11.0) | <0.001 |
| Left heart structure/function | |||
| EF (%) | 58 (54–64) | 62 (56–66) | 0.019 |
| Stroke volume (ml) | 67 (52–79) | 78 (65–100) | 0.001 |
| Septal wall thickness (cm) | 1.2 (1.1–1.5) | 1.4 (1.2–1.6) | 0.034 |
| Posterior wall thickness (cm) | 1.0 (0.9–1.2) | 1.1 (1.0–1.2) | 0.10 |
| Relative wall thickness | 0.4 (0.4–0.5) | 0.5 (0.4–0.5) | 0.23 |
| LVMI (g/cm2) | 103.3 (85.1–127.5) | 102.9 (83.6–120.9) | 0.70 |
| LVM (g) | 192 (156–242) | 217 (170–248) | 0.076 |
| LVEDV (ml) | 79 (63–96) | 77 (64–99) | 0.75 |
| LVEDVI (ml/m2) | 43 (36–51) | 37 (32–44) | 0.002 |
| LVEDV indexed for height (ml/m) | 47 (39–57) | 46 (41–58) | 0.95 |
| LVESV (ml) | 33 (24–41) | 29 (23–40) | 0.23 |
| LVESVI (ml/m2) | 17 (14–22) | 14 (12–18) | 0.003 |
| LVESV indexed for height (ml/m) | 19 (15–24) | 18 (14–23) | 0.26 |
| LA volume (ml) | 74 (58–92) | 69 (57–78) | 0.30 |
| LAVI (ml/m2) | 39 (32–46) | 33 (29–43) | 0.004 |
| LAV indexed for height (ml/m) | 45 (36–52) | 41 (36–51) | 0.45 |
| Mitral E‐wave (cm/s) | 92.4 (80.2–111.4) | 96.8 (80.0–113.6) | 0.31 |
| Mitral A‐wave (cm/s) | 78.9 (50.0–101.4) | 97.0 (78.0–110.4) | 0.017 |
| Mitral E/A | 1.9 (1.5–2.5) | 1.6 (1.1–1.8) | 0.001 |
| Mitral deceleration time (ms) | 172 (143–197) | 200 (166–231) | <0.001 |
| Mitral annular s' velocity (cm/s) | 5.5 (4.6–6.8) | 6.6 (5.4–8.1) | <0.001 |
| Mitral annular e' velocity at septal wall (cm/s) | 6.6 (5.2–8.3) | 7.0 (5.6–8.2) | 0.58 |
| Mitral annular e' velocity at lateral wall (cm/s) | 9.7 (7.7–12.5) | 8.8 (7.5–10.8) | 0.13 |
| Mitral E/e' (lateral) | 9.9 (6.9–12.3) | 11.3 (8.4–13.6) | 0.061 |
| Mitral E/e' (septal) | 14.3 (10.4–18.1) | 14.4 (10.4–19.5) | 0.81 |
| Mitral E/e' (average) | 12.5 (9.0–15.5) | 12.6 (10.2–16.5) | 0.34 |
| Global longitudinal strain (%) | 16 (13–19) | 17 (15–19) | 0.39 |
| LA reservoir strain (%) | 14 (9–22) | 18 (9–23) | 0.47 |
| Right heart structure/function | |||
| RV free wall thickness (cm) | 0.5 (0.4–0.5) | 0.5 (0.4–0.5) | 0.94 |
| RV end‐diastolic area (cm2) | 19 (14–22) | 19 (16–22) | 0.33 |
| RV end‐systolic area (cm2) | 10 (8–13) | 10 (9–13) | 0.39 |
| Tricuspid annular e' velocity (cm/s) | 12.9 (10.2–17.0) | 11.3 (9.2–14.3) | 0.038 |
| Tricuspid annular a' velocity (cm/s) | 13.4 (9.7–17.9) | 14.4 (11.9–17.5) | 0.20 |
| Tricuspid annular s' velocity (cm/s) | 11.1 (9.5–13.4) | 11.6 (9.2–13.1) | 0.73 |
| Tricuspid E/e' ratio | 4.1 (2.9–5.8) | 4.9 (3.8–6.0) | 0.037 |
| TAPSE (cm) | 1.8 (1.5–2.1) | 1.8 (1.6–2.1) | 0.51 |
| Tricuspid regurgitation velocity (cm/s) | 297 (267–335) | 294 (248–325) | 0.23 |
| PASP (mmHg) | 42 (35–52) | 41 (32–48) | 0.19 |
| CFR, RHI, 6MWT and QoL | |||
| CFR | 2.1 (1.8–2.4) | 2.0 (1.8–2.7) | 0.49 |
| RHI | 1.6 (1.0–2.0) | 1.5 (0.8–1.9) | 0.32 |
| KCCQ score | 71 (50–85) | 62 (49–77) | 0.070 |
| 6‐min walk test (m) | 341 (240–426) | 331.5 (240–408) | 0.59 |
Values are given as median (interquartile range) or n (%).
CFR, coronary flow reserve; EF, ejection fraction; KCCQ, Kansas City Cardiomyopathy Questionnaire; LA, left atrial; LAV, left atrial volume; LAVI, left atrial volume index; LV, left ventricular; LVEDV, left ventricular end‐diastolic volume; LVEDVI, left ventricular end‐iastolic volume index; LVESV, left ventricular end‐systolic volume; LVESVI, left ventricular end‐systolic volume index; LVM, left ventricular mass; LVMI, left ventricular mass index; PASP, estimated pulmonary artery systolic pressure; QoL, quality of life; RHI, reactive hyperaemia index; RV, right ventricular; TAPSE, tricuspid annular plane systolic excursion.
OPLS‐DA analysis: clinical, proteomic and echocardiographic phenotypes
The OPLS‐DA model explained 15% of the data variation (4.2% predictive of EAT; 11% independent of EAT) and 50% group differences (17% after full jack‐knife cross‐validation). Figure 1 displays the distribution of clinical, proteomic and echocardiographic variables (n = 579) in relation to and independent of EAT ≥9 mm. Parameters that are more to the right were associated with lower EAT and more to the left with higher EAT. Figure 2 illustrates the scores of the individual participants along the discriminant and orthogonal components. The scores of the two populations are relatively well‐separated, suggesting that the variable pattern is informative for discriminating participants with EAT ≥9 or <9 mm. Figure 3 shows the most discriminating variables arranged by descending predictive value. The most discriminant variables associated with EAT ≥9 mm were: BMI, weight, waist circumference and leptin, and the most discriminant variables associated with EAT <9 mm were insulin‐like growth factor binding protein (IGFBP)‐1, BNP, IGFBP2 and NT‐proBNP.
Figure 1.
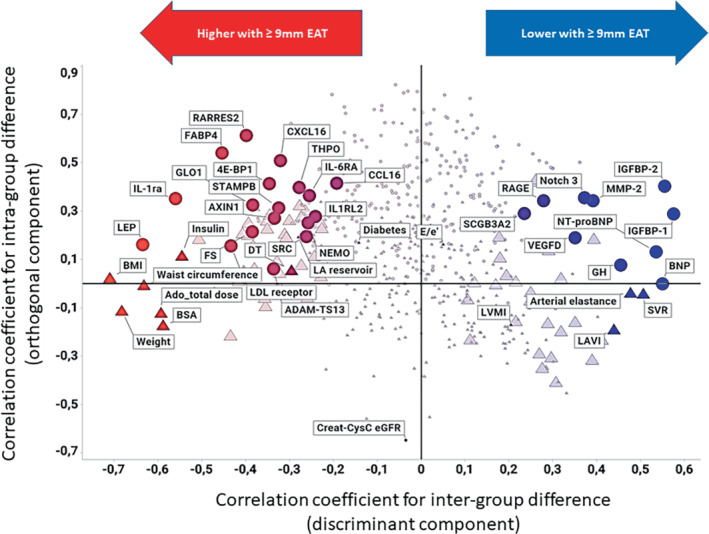
Correlation coefficients for the predictive value (x‐axis) and the orthogonal variation (y‐axis) of all variables assessed in PROMIS‐HFpEF. Significant predictors are indicated with a large symbol. OLINK variables (circles) are highlighted together other clinical, laboratory or echocardiographic discriminant variables (triangles). In addition, the following variables are included for comparison: E/e', left ventricular mass index, deceleration time, left atrial reservoir strain and diabetes. Creatinine–cystatin C estimated glomerular filtration rate (Creat‐CysC eGFR) is highlighted as a potential explanation for the orthogonal variation of the OLINK variables loading with high orthogonal correlation coefficients in the model.
Figure 2.
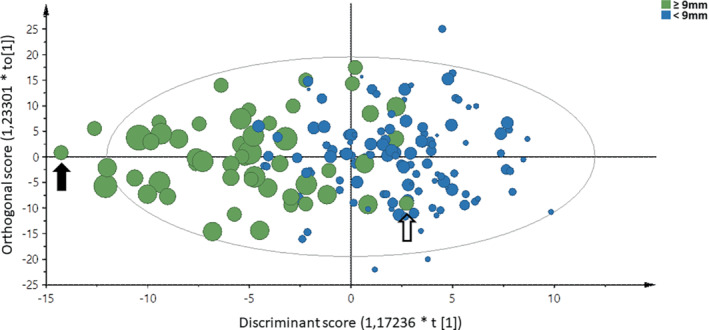
Scores of subjects based on the variable pattern shown in Figure 1 along the discriminant component (x‐axis) and the orthogonal component (y‐axis). Symbols are coloured by class (epicardial adipose tissue ≥9 mm in green, <9 mm in blue) and sized proportionally by individual epicardial adipose tissue (mm). The subject highlighted with an closed arrow is thus predicted to have the most extreme phenotype, whereas the subject marked with an open arrow is predicted to have a phenotype not different from the group of subjects having epicardial adipose tissue <9 mm.
Figure 3.
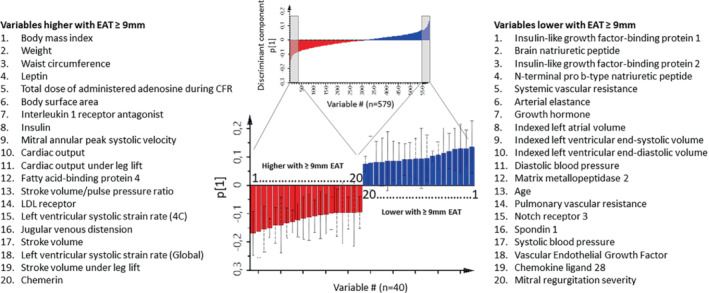
Top 40 variables associated with epicardial adipose tissue (EAT) ≥9 mm in OPLS‐DA separating subjects with EAT ≥9 versus <9 mm. The selected bars (top 20 in each direction) represent the variables with the highest numerical loading scores (p [1]) along the discriminant component, meaning variables with the best predictive value. Red bars and list on the left are variables that are higher, and blue bars and list on the right are variables that are lower in subjects with EAT ≥9 mm. The lists are sorted by the numerical loading score, meaning that body mass index and insulin‐like growth factor‐binding protein 1 are the top positive and negative predictor, respectively. CFR, coronary flow reserve; LDL, low‐density lipoprotein.
The OPLS‐DA demonstrated obesity‐associated variables (weight, waist circumference, body surface area and BMI) had the highest loading scores. Increased EAT was associated with increased adipokines, like interleukin‐1 receptor antagonist (IL1‐RA), leptin, fatty acid binding protein 4 (FABP4) and chemerin (RARRES2); and with lower insulin sensitivity and endothelial dysfunction (lower IGFBP1 and IGFBP2), diabetes (increased HbA1c and serum insulin) and dyslipidaemia (increased LDL receptor and lower HDL). Participants with EAT ≥9 mm had smaller indexed LA and LV volumes, better LV systolic function (EF, fractional shortening, LV systolic strain, s' velocity), and more significant diastolic aberrations (increased mitral E wave deceleration time) (Figure 3 ). In addition, this group demonstrated lower systemic and pulmonary vascular resistance, lower arterial elastance, and increased arterial compliance. To dissect variables that were associated with EAT, but not with general adiposity, we performed OPLS‐DA models comparing variables significantly associated with BMI ≥30 kg/m2 to those significantly associated with EAT ≥9 mm. Online supplementary Figure S1 shows a comparison of the OPLS‐DA models, highlighting proteins with more selective discriminative power for EAT ≥9 mm: higher glyoxalase I (GLO1) reflecting hyperglycaemia, eukaryotic initiation factor 4E binding protein 1(4E‐BP1) reflecting protein synthesis, A disintegrin and metalloproteinase with thrombospondin motifs 13 (ADAM‐TS13), a metalloproteinase involved in blood clotting, STAM‐binding protein (STAMPB) and the anti‐inflammatory protein AXIN1. The two latter both modulators of cell haemostasis added by lower concentrations of matrix metalloproteinase 2 (MMP‐2) controlling extracellular matrix and neurogenic locus notch homolog protein 3 (Notch 3) regulating cell survival were associated with EAT ≥9 mm. Also, higher EF and global strain (during leg lift) and lower LAVI and pulmonary artery systolic pressure had higher discriminative power for EAT ≥9 mm. In summary, EAT was associated with an obese, pre‐diabetic, dyslipidaemic phenotype that demonstrated cardiac structural and functional alterations and increased proteomic markers of adipose biology and inflammation, insulin resistance, endothelial dysfunction, and dyslipidaemia.
Epicardial adipose tissue associations with echocardiography, coronary flow reserve and quality of life on regression analysis
Online supplementary Table S 3 shows the results of uni‐ and multivariable regression analyses. In univariable regression analysis, increased EAT was positively associated with EF, stroke volume, systolic myocardial velocity, mitral A‐wave velocity, E/A ratio, and deceleration time. However, only septal wall thickness and deceleration time remained significantly (and positively) associated with EAT after adjusting for BMI. No significant sex interactions were observed for any relationships in this analysis. Additional regression analysis was performed selecting patients with EF ≥50%, and demonstrated largely similar findings to analysis performed in the total cohort (online supplementary Table S 6 ).
Discussion
In PROMIS‐HFpEF, 30% of patients with HFpEF had elevated EAT. Patients with more EAT were more likely obese, demonstrated cardiac structural alterations, haemodynamic derangement and proteomic markers associated with adiposity, systemic inflammation, insulin resistance, endothelial dysfunction and dyslipidaemia. Together, our results demonstrate the possible contribution of EAT to HFpEF, although this may be mediated by obesity.
Patient characteristics, coronary microvascular dysfunction and quality of life
Increased EAT was common in our HFpEF population and associated with obesity and a poorer metabolic profile, consistent with recent studies employing cardiac magnetic resonance imaging. 8 , 19 , 20 Absence of association between coronary microvascular dysfunction and EAT in this study should, however, be interpreted with caution given that patients with increased EAT were comparatively younger, keeping in mind inherent differences in resistive‐vessel function related to aging. 21 The tendency to lower KCCQ seen in our analysis is consistent with studies suggesting that HFpEF patients with poorer health‐related QoL indices are more likely obese and display lower NT‐proBNP. 22
Epicardial adipose tissue associations with left heart structure and function
While indexed LV and LA volumes were significantly lower in patients with elevated EAT in this study, no significant differences were observed when non‐indexed volumes were considered. EAT is comprised mainly of white adipose tissue that is directly related to both visceral and total body fat and strongly associated with BMI, 5 suggesting that indexing LV size to body surface area (which incorporates weight) may be problematic. A speculative explanation for smaller indexed LA volumes in the increased EAT group may be compression of compliant atrial structures leading to smaller volumes in keeping with the hypothesis of lower natriuretic peptide levels due to cardiac constraint. Although natriuretic peptide concentrations were lower in the high EAT group, diuretic use was more common indicating a clinical impression of congestion. Natriuretic peptide deficiency has been documented in the obese and attributed to elevated natriuretic peptide degradation in fat tissue, insulin resistance 23 and more recently to a relative reduction in wall stress owing to pericardial restraint caused by elevated EAT in the obese HFpEF phenotype. 4 Furthermore, an uncoupling between cardiac wall stress and intravascular pressures has been documented in the obese, 24 supporting a mechanistic external compression role of EAT in HF and a potential underestimation of congestion in obese patients due to lower natriuretic peptides levels.
Epicardial adipose tissue has been hypothesized to exert a paracrine effect on cardiac tissue 7 mediated by unobstructed access to coronary microcirculation and the absence of an intervening fascial plane. Excessive EAT is associated with elevated cardiac output and stroke volume 25 and higher indices of LV systolic function have been reported in participants with moderate weight gain, 26 largely consistent with the findings in the present study. Further, patients with increased EAT demonstrated biventricular diastolic aberrations in keeping with earlier studies. 9 , 10 Given that the increased EAT subgroup was relatively younger in this study, one can argue that age‐dependent measures of increased filling pressure such as E/e' 27 may have actually been underestimated. Age‐ and BMI‐matched studies would perhaps clarify this further. Further, echocardiographic indices at rest do not capture more profound haemodynamic derangements and poorer peak aerobic capacity provoked by exercise as reported in recent studies. 9 Importantly, almost all associations between EAT and indices of LV function turned non‐significant when adjusted for body mass making any conclusion regarding direct impact of EAT rather than obesity in general difficult.
Recent studies have also suggested that differential risk of HFpEF with obesity may be pronounced in women. 28 , 29 , 30 Absence of significant sex interactions in our regression models may be owing to smaller numbers available for interaction analysis and needs to be further investigated. Further, proteomic associations with general obesity‐linked characteristics makes it difficult to differentiate between direct effects of EAT as opposed to general effects of obesity.
Epicardial adipose tissue associations with proteomics
To the best of our knowledge, this is the first study to extensively evaluate associations between EAT and proteomics and contributes to available information on its impact on cardiovascular haemodynamics and metabolic profile. 11 The proteomic profile of patients with increased EAT expressed adiposity, inflammation, oxidative stress and endothelial dysfunction paired with dysglycaemia and dyslipidaemia. These conditions are also central components of HFpEF pathophysiology. 31 , 32
Earlier Mendelian randomization studies suggest a causal role for some of these proteins, such as IL1‐RA inducing dyslipidaemia, 33 and IGFBP1 and RAGE reducing BMI. In contrast, other proteomic markers such as FABP4 and chemerin are more likely to be secondary to adiposity. 34 Inflammation as a driver of the dyslipidaemic phenotype associated with EAT is also consistent with data showing that infection and inflammation increase levels of triglyceride‐rich lipoproteins, which are intended to play a protective role for the host, by neutralizing inflammatory triggers, such as lipopolysaccharides. 35
The protein with the highest discriminative power for EAT ≥9 mm but not for increased BMI, was GLO1, a protein associated with oxidative stress and previously found to be increased in HF distinguishing between HFpEF and pulmonary arterial hypertension. 36 Interestingly downregulation of GLO1 in a hypertensive rat model was associated with reduced ectopic fat accumulation, possibly mediated by AMPK activation in the heart. 37
We also found a negative association between MMP‐2 and EAT ≥9 mm. Previously, MMP‐2 activity in EAT has been reported to be increased in patients undergoing coronary bypass surgery 38 and associated with atrial myocardial fibrosis in patients with atrial fibrillation. 39 Nevertheless, our findings in HFpEF patients are based on circulating plasma proteins which may potentially originate from biological processes outside the myocardium with impact on associations with EAT. We and others have previously demonstrated coronary microvascular and endothelial dysfunction and rarefaction in HFpEF implicating them as components in HFpEF disease development. 12 , 40 In the present study, there was a tendency to lower levels of vascular endothelial growth factor‐D, a modulator of growth of blood and lymphatic vessels, in patients with EAT ≥9 mm.
Study limitations
We evaluated EAT using two‐dimensional transthoracic echocardiography in this study. Studies which posed challenges to accurate measurement owing to near‐field reverberations and/or unclear distinction between EAT and pericardial fat needed to be excluded. Cardiac magnetic resonance imaging permits more precise, volumetric quantification and is considered the reference standard method for EAT assessment. However, echocardiography, in addition to being fast, low‐cost and widely available, has demonstrated good agreement with magnetic resonance imaging in earlier studies. 41 Systemic circulation proteins may not reflect pathophysiological processes within the heart, but provide hypotheses for future research. Lower representation from very obese patients in this multinational HFpEF cohort needs to be considered when interpreting the results. Further, a relatively small number of participants in the subgroup analysis of patients with lower BMI may also be considered as a limitation, which was an attempt to discern any obesity independent effects of EAT. Thus, establishing any causal relationships between EAT and echocardiographic or proteomic variables was limited by the correlative nature of data, in particular that between EAT and BMI.
Conclusion
Heart failure with preserved EF patients with increased EAT deposition had higher BMI and signs of cardiac structural alterations and proteomic markers associated with general adiposity, systemic inflammation, insulin resistance, endothelial dysfunction, and dyslipidaemia. EAT may contribute to HFpEF but it remains unclear whether this is simply mediated by obesity, or if EAT also exerts direct effects independent of its association with obesity.
Funding
PROMIS‐HFpEF is an AstraZeneca sponsored study.
Carolyn S.P. Lam is supported by a Clinician Scientist Award from the National Medical Research Council of Singapore. Sanjiv J. Shah is supported by research grants from the National Institutes of Health (U54 HL160273, R01 HL107577, R01 HL127028, R01, HL140731, R01 HL149423), Actelion, AstraZeneca, Corvia, Novartis, and Pfizer. Lars H. Lund is supported by the Swedish Research Council [grants 2013–23 897 104 604‐ 23 and 523–2014‐2336], and the Swedish Heart Lung Foundation [grants 20 120 321 and 20 150 557].
Conflict of interest: U.L.F. has received consulting fees from Orion Pharma and Anacardio. C.H. has received consulting fees from Novartis, Roche Diagnostics and AnaCardio, research grants from Bayer and speaker and honoraria from MSD and Novartis; Supported by the Swedish Research Council [grant 20 180 899]. A.S. has received research grants from Academy of Finland and Finnish Foundation for Cardiovascular Research during the conduct of the study; and consulting fees from GE Healthcare, Novartis, Abbot, AstraZeneca. C.S.P.L. has received research support from Bayer and Roche Diagnostics; has served as consultant or on the Advisory Board/Steering Committee/Executive Committee for Abbott, Actelion, Alleviant Medical, Allysta Pharma, Amgen, AnaCardio AB, Applied Therapeutics, AstraZeneca, Bayer, Boehringer Ingelheim, Boston Scientific, Cytokinetics, Darma Inc., EchoNous Inc, Impulse Dynamics, Ionis Pharmaceutical, Janssen Research & Development LLC, Medscape/WebMD Global LLC, Merck, Novartis, Novo Nordisk, Prosciento Inc, Radcliffe Group Ltd., Roche Diagnostics, Sanofi, Siemens Healthcare Diagnostics and Us2.ai; and serves as co‐founder and nonexecutive director of Us2.ai. Patent pending: PCT/SG2016/050217 Method for diagnosis and prognosis of chronic heart failure. US Patent No. 10702, 247. Automated clinical workflow that recognizes and analyses 2‐dimensional and Doppler echo images for cardiac measurements and the diagnosis, prediction and prognosis of heart disease. S.J.S. has received consulting fees from Abbott, Actelion, AstraZeneca, Amgen, Aria CV, Axon Therapies, Bayer, Boehringer‐Ingelheim, Boston Scientific, Bristol‐Myers Squibb, Cardiora, Coridea, CVRx, Cyclerion, Cytokinetics, Edwards Lifesciences, Eidos, Eisai, Imara, Impulse Dynamics, Intellia, Ionis, Ironwood, Lilly, Merck, MyoKardia, Novartis, Novo Nordisk, Pfizer, Prothena, Regeneron, Rivus, Sanofi, Shifamed, Tenax, Tenaya, and United Therapeutics. L.H.L. has received research grants from Novartis, Boehringer Ingelheim, Vifor Pharma, AstraZeneca, Mundipharma and Relypsa and consulting fees from Novartis, Merck, Boehringer Ingelheim, Sanofi, Bayer, Pharmacosmos, Myokardia, Medscape and AstraZeneca; stock owner in Anacardio. All other authors have nothing to disclose.
Supporting information
Appendix S1. Supporting informationUnique and shared variables for EAT ≥9 mm and BMI ≥30. The X‐axis represents the correlation coefficients (p(corr)) of variables in the OPLS‐DA describing patients with EAT ≥9 mm (same as shown in figure 1) and the y‐axis represents a corresponding OPLS‐DA model describing variables associated with BMI ≥30. Variables along the diagonal (y = x) are similarly associated to EAT and BMI (shared), whereas variables with an offset to this diagonal may be discriminant (unique). Variables that are significantly discriminating subjects with EAT ≥ vs <9 mm (but not those with BMI ≥ vs <30) are highlighted by red triangles and are ranked by EAT‐association in lists to the left (20 positively associated variables) and right (19 negatively associated variables). Variables uniquely associated to BMI are highlighted by blue triangles and EAT/BMI‐shared variables by green squares. Variables marked as grey circles are not discriminative for neither EAT ≥9 mm nor BMI ≥30.
A disintegrin and metalloproteinase with thrombospondin motifs 13 = ADAM‐TS13; eukaryotic initiation factor 4E binding protein 1 = 4E‐BP1; GLO1 = Glyxoalase I; Interleukin‐1 receptor‐like 2 = IL1RL2; C‐C motif chemokine 16 (CCL16); Interleukin‐6 receptor subunit alpha = IL‐6RA; left ventricle = LV; metalloproteinase 2 = MMP‐2; neurogenic locus notch homolog protein 3 = Notch 3; NF‐kappa‐B essential modulator = NEMO; NT‐pro brain natriuretic peptide = NT‐proBNP; Proto‐oncogene tyrosine‐protein kinase Src = SRC; pulmonary arterial = PA; Receptor for advanced glycosylation end products = RAGE; right ventricle = RV; Secretoglobin family 3A member 2 = SCGB3A2; STAM‐binding protein = STAMPB; Thrombopoietin = THPO; tricuspid regurgitation = TR
Appendix Table 1 Patient characteristics by EAT <9 mm and ≥9 mm stratified by obesity (<30 vs ≥30 kg/m2)
Appendix Table 2. Echocardiographic and functional parameters by EAT <9 mm and ≥9 mm, stratified by obesity (<30 vs ≥30 kg/m2)
Appendix Table 3. Linear regression analyses between echocardiographic and functional parameters (dependent variable) and EAT.
Appendix table 4. Baseline characteristics according to EAT < vs ≥9 mm in patients with EF≥50%
Appendix table 5 Echocardiographic and functional parameters according to EAT < vs ≥9 mm in patiens with EF≥50%
Appendix Table 6. Linear regression analyses between echocardiographic and functional parameters (dependent variable) and EAT in patients with EF≥50%.
References
- 1. Lam CS, Voors AA, de Boer RA, Solomon SD, van Veldhuisen DJ. Heart failure with preserved ejection fraction: from mechanisms to therapies. Eur Heart J. 2018;39:2780–92. [DOI] [PubMed] [Google Scholar]
- 2. Shah SJ, Kitzman DW, Borlaug BA, van Heerebeek L, Zile MR, Kass DA, et al. Phenotype‐specific treatment of heart failure with preserved ejection fraction: a multiorgan roadmap. Circulation. 2016;134:73–90. [DOI] [PMC free article] [PubMed] [Google Scholar]
- 3. Reddy YN, Borlaug BA. Heart failure with preserved ejection fraction. Curr Probl Cardiol. 2016;41:145–88. [DOI] [PubMed] [Google Scholar]
- 4. Obokata M, Reddy YN, Pislaru SV, Melenovsky V, Borlaug BA. Evidence supporting the existence of a distinct obese phenotype of heart failure with preserved ejection fraction. Circulation. 2017;136:6–19. [DOI] [PMC free article] [PubMed] [Google Scholar]
- 5. Rabkin S. Epicardial fat: properties, function and relationship to obesity. Obes Rev. 2007;8:253–61. [DOI] [PubMed] [Google Scholar]
- 6. Paulus WJ, Tschope C. A novel paradigm for heart failure with preserved ejection fraction: comorbidities drive myocardial dysfunction and remodeling through coronary microvascular endothelial inflammation. J Am Coll Cardiol. 2013;62:263–71. [DOI] [PubMed] [Google Scholar]
- 7. Packer M. Epicardial adipose tissue may mediate deleterious effects of obesity and inflammation on the myocardium. J Am Coll Cardiol. 2018;71:2360–72. [DOI] [PubMed] [Google Scholar]
- 8. van Woerden G, Gorter TM, Westenbrink BD, Willems TP, van Veldhuisen DJ, Rienstra M. Epicardial fat in heart failure patients with mid‐range and preserved ejection fraction. Eur J Heart Fail. 2018;20:1559–66. [DOI] [PMC free article] [PubMed] [Google Scholar]
- 9. Koepp KE, Obokata M, Reddy YN, Olson TP, Borlaug BA. Hemodynamic and functional impact of epicardial adipose tissue in heart failure with preserved ejection fraction. JACC Heart Fail. 2020;8:657–66. [DOI] [PMC free article] [PubMed] [Google Scholar]
- 10. Gorter TM, van Woerden G, Rienstra M, Dickinson MG, Hummel YM, Voors AA, et al. Epicardial adipose tissue and invasive hemodynamics in heart failure with preserved ejection fraction. JACC Heart Fail. 2020;8:667–76. [DOI] [PubMed] [Google Scholar]
- 11. Pugliese NR, Paneni F, Mazzola M, De Biase N, Del Punta L, Gargani L, et al. Impact of epicardial adipose tissue on cardiovascular haemodynamics, metabolic profile, and prognosis in heart failure. Eur J Heart Fail. 2021;23:1858–71. [DOI] [PubMed] [Google Scholar]
- 12. Shah SJ, Lam CS, Svedlund S, Saraste A, Hage C, Tan RS, et al. Prevalence and correlates of coronary microvascular dysfunction in heart failure with preserved ejection fraction: PROMIS‐HFpEF. Eur Heart J. 2018;39:3439–50. [DOI] [PMC free article] [PubMed] [Google Scholar]
- 13. Iacobellis G, Willens HJ. Echocardiographic epicardial fat: a review of research and clinical applications. J Am Soc Echocardiogr. 2009;22:1311–9. [DOI] [PubMed] [Google Scholar]
- 14. Iacobellis G, Willens HJ, Barbaro G, Sharma AM. Threshold values of high‐risk echocardiographic epicardial fat thickness. Obesity. 2008;16:887–92. [DOI] [PubMed] [Google Scholar]
- 15. Wittfeldt A, Emanuelsson H, Brandrup‐Wognsen G, van Giezen JJ, Jonasson J, Nylander S, et al. Ticagrelor enhances adenosine‐induced coronary vasodilatory responses in humans. J Am Coll Cardiol. 2013;61:723–7. [DOI] [PubMed] [Google Scholar]
- 16. Lang RM, Badano LP, Mor‐Avi V, Afilalo J, Armstrong A, Ernande L, et al. Recommendations for cardiac chamber quantification by echocardiography in adults: an update from the American Society of Echocardiography and the European Association of Cardiovascular Imaging. Eur Heart J Cardiovasc Imaging. 2015;16:233–70. [DOI] [PubMed] [Google Scholar]
- 17. Burke MA, Katz DH, Beussink L, Selvaraj S, Gupta DK, Fox J, et al. Prognostic importance of pathophysiologic markers in patients with heart failure and preserved ejection fraction. Circ Heart Fail. 2014;7:288–99. [DOI] [PMC free article] [PubMed] [Google Scholar]
- 18. Inker L, Schmid C, Tighiouart H, et al.; CKD‐EPI Investigators. Estimating glomerular filtration rate from serum creatinine and cystatin C. N Engl J Med. 2012;367:20–9. [DOI] [PMC free article] [PubMed] [Google Scholar]
- 19. Wu CK, Lee JK, Hsu JC, Su MYM, Wu YF, Lin TT, et al. Myocardial adipose deposition and the development of heart failure with preserved ejection fraction. Eur J Heart Fail. 2020;22:445–54. [DOI] [PubMed] [Google Scholar]
- 20. Tromp J, Bryant JA, Jin X, van Woerden G, Asali S, Yiying H, et al. Epicardial fat in heart failure with reduced versus preserved ejection fraction. Eur J Heart Fail. 2021;23:835–8. [DOI] [PubMed] [Google Scholar]
- 21. Uren NG, Camici PG, Melin JA, Bol A, de Bruyne B, Radvan J, et al. Effect of aging on myocardial perfusion reserve. J Nucl Med. 1995;36:2032–6. [PubMed] [Google Scholar]
- 22. Reddy YN, Rikhi A, Obokata M, Shah SJ, Lewis GD, AbouEzzedine OF, et al. Quality of life in heart failure with preserved ejection fraction: importance of obesity, functional capacity, and physical inactivity. Eur J Heart Fail. 2020;22:1009–18. [DOI] [PubMed] [Google Scholar]
- 23. Khan AM, Cheng S, Magnusson M, Larson MG, Newton‐Cheh C, McCabe EL, et al. Cardiac natriuretic peptides, obesity, and insulin resistance: evidence from two community‐based studies. J Clin Endocrinol Metab. 2011;96:3242–9. [DOI] [PMC free article] [PubMed] [Google Scholar]
- 24. Obokata M, Reddy YN, Melenovsky V, Sorimachi H, Jarolim P, Borlaug BA. Uncoupling between intravascular and distending pressures leads to underestimation of circulatory congestion in obesity. Eur J Heart Fail. 2022;24:353–61. [DOI] [PubMed] [Google Scholar]
- 25. Messerli F. Cardiovascular effects of obesity and hypertension. Lancet. 1982;319:1165–8. [DOI] [PubMed] [Google Scholar]
- 26. Pascual M, Pascual D, Soria F, Vicente T, Hernandez A, Tebar F, et al. Effects of isolated obesity on systolic and diastolic left ventricular function. Heart. 2003;89:1152–6. [DOI] [PMC free article] [PubMed] [Google Scholar]
- 27. Munagala VK, Jacobsen SJ, Mahoney DW, Rodeheffer RJ, Bailey KR, Redfield MM. Association of newer diastolic function parameters with age in healthy subjects: a population‐based study. J Am Soc Echocardiogr. 2003;16:1049–56. [DOI] [PubMed] [Google Scholar]
- 28. Savji N, Meijers WC, Bartz TM, Bhambhani V, Cushman M, Nayor M, et al. The association of obesity and cardiometabolic traits with incident HFpEF and HFrEF. JACC Heart Fail. 2018;6:701–9. [DOI] [PMC free article] [PubMed] [Google Scholar]
- 29. Sorimachi H, Obokata M, Takahashi N, Reddy YN, Jain CC, Verbrugge FH, et al. Pathophysiologic importance of visceral adipose tissue in women with heart failure and preserved ejection fraction. Eur Heart J. 2021;42:1595–605. [DOI] [PMC free article] [PubMed] [Google Scholar]
- 30. Sorimachi H, Omote K, Omar M, Popovic D, Verbrugge FH, Reddy YN, et al. Sex and central obesity in heart failure with preserved ejection fraction. Eur J Heart Fail. 2022;24:1359–70. [DOI] [PubMed] [Google Scholar]
- 31. Borlaug BA, Jensen MD, Kitzman DW, Lam CS, Obokata M, Rider OJ. Obesity and heart failure with preserved ejection fraction: new insights and pathophysiologic targets. Cardiovasc Res. 2022. 10.1093/cvr/cvac120 [DOI] [PMC free article] [PubMed] [Google Scholar]
- 32. Paulus WJ, Zile MR. From systemic inflammation to myocardial fibrosis: the heart failure with preserved ejection fraction paradigm revisited. Circ Res. 2021;128:1451–67. [DOI] [PMC free article] [PubMed] [Google Scholar]
- 33. Interleukin 1 Genetics Consortium . Cardiometabolic effects of genetic upregulation of the interleukin 1 receptor antagonist: a Mendelian randomisation analysis. Lancet Diabetes Endocrinol. 2015;3:243–53. [DOI] [PMC free article] [PubMed] [Google Scholar]
- 34. Zaghlool SB, Sharma S, Molnar M, Matías‐García PR, Elhadad MA, Waldenberger M, et al. Revealing the role of the human blood plasma proteome in obesity using genetic drivers. Nat Commun. 2021;12:1279. [DOI] [PMC free article] [PubMed] [Google Scholar]
- 35. Vreugdenhil AC, Snoek AP, van't Veer C, Greve JWM, Buurman WA. LPS‐binding protein circulates in association with apoB‐containing lipoproteins and enhances endotoxin‐LDL/VLDL interaction. J Clin Invest. 2001;107:225–34. [DOI] [PMC free article] [PubMed] [Google Scholar]
- 36. Ahmed S, Ahmed A, Rådegran G. Plasma tumour and metabolism related biomarkers AMBP, LPL and glyoxalase I differentiate heart failure with preserved ejection fraction with pulmonary hypertension from pulmonary arterial hypertension. Int J Cardiol. 2021;345:68–76. [DOI] [PubMed] [Google Scholar]
- 37. Šilhavý J, Malínská H, Hüttl M, Marková I, Oliyarnyk O, Mlejnek P, et al. Downregulation of the Glo1 gene is associated with reduced adiposity and ectopic fat accumulation in spontaneously hypertensive rats. Antioxidants (Basel). 2020;9:1179. [DOI] [PMC free article] [PubMed] [Google Scholar]
- 38. Miksztowicz V, Morales C, Barchuk M, Lopez G, Póveda R, Gelpi R, et al. Metalloproteinase 2 and 9 activity increase in epicardial adipose tissue of patients with coronary artery disease. Curr Vasc Pharmacol. 2017;15:135–43. [DOI] [PubMed] [Google Scholar]
- 39. Abe I, Teshima Y, Kondo H, Kaku H, Kira S, Ikebe Y, et al. Association of fibrotic remodeling and cytokines/chemokines content in epicardial adipose tissue with atrial myocardial fibrosis in patients with atrial fibrillation. Heart Rhythm. 2018;15:1717–27. [DOI] [PubMed] [Google Scholar]
- 40. Mohammed SF, Hussain S, Mirzoyev SA, Edwards WD, Maleszewski JJ, Redfield MM. Coronary microvascular rarefaction and myocardial fibrosis in heart failure with preserved ejection fraction. Circulation. 2015;131:550–9. [DOI] [PMC free article] [PubMed] [Google Scholar]
- 41. Parisi V, Petraglia L, Formisano R, Caruso A, Grimaldi MG, Bruzzese D, et al. Validation of the echocardiographic assessment of epicardial adipose tissue thickness at the Rindfleisch fold for the prediction of coronary artery disease. Nutr Metab Cardiovasc Dis. 2020;30:99–105. [DOI] [PubMed] [Google Scholar]
Associated Data
This section collects any data citations, data availability statements, or supplementary materials included in this article.
Supplementary Materials
Appendix S1. Supporting informationUnique and shared variables for EAT ≥9 mm and BMI ≥30. The X‐axis represents the correlation coefficients (p(corr)) of variables in the OPLS‐DA describing patients with EAT ≥9 mm (same as shown in figure 1) and the y‐axis represents a corresponding OPLS‐DA model describing variables associated with BMI ≥30. Variables along the diagonal (y = x) are similarly associated to EAT and BMI (shared), whereas variables with an offset to this diagonal may be discriminant (unique). Variables that are significantly discriminating subjects with EAT ≥ vs <9 mm (but not those with BMI ≥ vs <30) are highlighted by red triangles and are ranked by EAT‐association in lists to the left (20 positively associated variables) and right (19 negatively associated variables). Variables uniquely associated to BMI are highlighted by blue triangles and EAT/BMI‐shared variables by green squares. Variables marked as grey circles are not discriminative for neither EAT ≥9 mm nor BMI ≥30.
A disintegrin and metalloproteinase with thrombospondin motifs 13 = ADAM‐TS13; eukaryotic initiation factor 4E binding protein 1 = 4E‐BP1; GLO1 = Glyxoalase I; Interleukin‐1 receptor‐like 2 = IL1RL2; C‐C motif chemokine 16 (CCL16); Interleukin‐6 receptor subunit alpha = IL‐6RA; left ventricle = LV; metalloproteinase 2 = MMP‐2; neurogenic locus notch homolog protein 3 = Notch 3; NF‐kappa‐B essential modulator = NEMO; NT‐pro brain natriuretic peptide = NT‐proBNP; Proto‐oncogene tyrosine‐protein kinase Src = SRC; pulmonary arterial = PA; Receptor for advanced glycosylation end products = RAGE; right ventricle = RV; Secretoglobin family 3A member 2 = SCGB3A2; STAM‐binding protein = STAMPB; Thrombopoietin = THPO; tricuspid regurgitation = TR
Appendix Table 1 Patient characteristics by EAT <9 mm and ≥9 mm stratified by obesity (<30 vs ≥30 kg/m2)
Appendix Table 2. Echocardiographic and functional parameters by EAT <9 mm and ≥9 mm, stratified by obesity (<30 vs ≥30 kg/m2)
Appendix Table 3. Linear regression analyses between echocardiographic and functional parameters (dependent variable) and EAT.
Appendix table 4. Baseline characteristics according to EAT < vs ≥9 mm in patients with EF≥50%
Appendix table 5 Echocardiographic and functional parameters according to EAT < vs ≥9 mm in patiens with EF≥50%
Appendix Table 6. Linear regression analyses between echocardiographic and functional parameters (dependent variable) and EAT in patients with EF≥50%.