

Abstract
Background
The American Cancer Society, the Centers for Disease Control and Prevention, the National Cancer Institute, and the North American Association of Central Cancer Registries collaborate to provide annual updates on cancer occurrence and trends in the United States.
Methods
Data on new cancer diagnoses during 2001–2018 were obtained from the North American Association of Central Cancer Registries’ Cancer in North America Incidence file, which is comprised of data from Centers for Disease Control and Prevention‐funded and National Cancer Institute‐funded, population‐based cancer registry programs. Data on cancer deaths during 2001–2019 were obtained from the National Center for Health Statistics' National Vital Statistics System. Five‐year average incidence and death rates along with trends for all cancers combined and for the leading cancer types are reported by sex, racial/ethnic group, and age.
Results
Overall cancer incidence rates were 497 per 100,000 among males (ranging from 306 among Asian/Pacific Islander males to 544 among Black males) and 431 per 100,000 among females (ranging from 309 among Asian/Pacific Islander females to 473 among American Indian/Alaska Native females) during 2014–2018. The trend during the corresponding period was stable among males and increased 0.2% on average per year among females, with differing trends by sex, racial/ethnic group, and cancer type. Among males, incidence rates increased for three cancers (including pancreas and kidney), were stable for seven cancers (including prostate), and decreased for eight (including lung and larynx) of the 18 most common cancers considered in this analysis. Among females, incidence rates increased for seven cancers (including melanoma, liver, and breast), were stable for four cancers (including uterus), and decreased for seven (including thyroid and ovary) of the 18 most common cancers. Overall cancer death rates decreased by 2.3% per year among males and by 1.9% per year among females during 2015–2019, with the sex‐specific declining trend reflected in every major racial/ethnic group. During 2015–2019, death rates decreased for 11 of the 19 most common cancers among males and for 14 of the 20 most common cancers among females, with the steepest declines (>4% per year) reported for lung cancer and melanoma. Five‐year survival for adenocarcinoma and neuroendocrine pancreatic cancer improved between 2001 and 2018; however, overall incidence (2001–2018) and mortality (2001–2019) continued to increase for this site. Among children (younger than 15 years), recent trends were stable for incidence and decreased for mortality; and among, adolescents and young adults (aged 15–39 years), recent trends increased for incidence and declined for mortality.
Conclusions
Cancer death rates continued to decline overall, for children, and for adolescents and young adults, and treatment advances have led to accelerated declines in death rates for several sites, such as lung and melanoma. The increases in incidence rates for several common cancers in part reflect changes in risk factors, screening test use, and diagnostic practice. Racial/ethnic differences exist in cancer incidence and mortality, highlighting the need to understand and address inequities. Population‐based incidence and mortality data inform prevention, early detection, and treatment efforts to help reduce the cancer burden in the United States.
Keywords: cancer, cancer death rate, incidence, mortality, pancreas
Short abstract
The American Cancer Society, the Centers for Disease Control and Prevention, the National Cancer Institute, and the North American Association of Central Cancer Registries collaborate annually to provide updated information about cancer occurrence and trends in the United States. Part 1 of this year's report provides information on cancer incidence and mortality rates and trends for males and females and by race/ethnicity for common cancer sites, with an in‐depth look at pancreatic cancer.
INTRODUCTION
The Centers for Disease Control and Prevention (CDC), the American Cancer Society, the National Cancer Institute (NCI), and the North American Association of Central Cancer Registries (NAACCR) have collaborated annually since 1998 to provide updated information about cancer occurrence and trends by cancer type, sex, age group, and racial/ethnic group in the United States. Part 1 of this report focuses on national cancer statistics and highlights incidence, mortality, and survival trends in pancreatic cancer—for which the prognosis remains poor, with few of the advances in screening or treatment that are seen in other cancer sites. The pancreas is one of the few cancer sites for which incidence and death rates have been increasing in recent years. Statistics are presented overall and by subtype. Part 2 focuses on the impact of coronavirus disease 2019 (COVID‐19) on cancer diagnosis in 2020.
MATERIALS AND METHODS
Data sources
Cancer incidence data
Population‐based cancer incidence data by age, sex, and racial/ethnic group were obtained from the NAACCR using the Cancer in North America database, which was submitted December 2020 and is comprised of data that include population‐based registries that participate in the CDC's National Program of Cancer Registries and/or the NCI's Surveillance, Epidemiology, and End Results (SEER) Program. Only registries for which data satisfied the NAACCR's criteria for data quality and completeness were included in this study. 1 For rate analyses, 49 states, the District of Columbia, and the territory of Puerto Rico met data criteria for every year during 2014–2018; whereas, for trend analyses, 46 states and the District of Columbia met data criteria for every year during 2001–2018, representing 99% and 92% of the population of the United States and Puerto Rico, respectively. States that were included in specific analyses for this report are listed in corresponding figure legends and table footnotes.
Anatomic site and histology were coded according to the International Classification of Diseases for Oncology, third edition (ICD‐O‐3) 2 , 3 and were categorized according to SEER site groups. 4 Only cases defined as malignant were included in this report, except that in situ and malignant bladder cancers were both included when reporting bladder cancer incidence rates, which is standard in cancer surveillance. Malignant behavior was based on the definition in place during the year of diagnosis. 2 , 3 , 5 , 6 Pancreatic cancers were classified by histology into three main groupings: adenocarcinomas (including ductal adenocarcinomas and other specified carcinomas), neuroendocrine neoplasms, and unspecified/other pancreas tumors (Table S1).
Cancer mortality data
Cause of death by age, sex, and racial/ethnic group (2001–2019) from all 50 states and the District of Columbia was based on death certificate information reported to state vital statistics offices and compiled through the CDC's National Center for Health Statistics' National Vital Statistics System. 7 The underlying causes of death were selected according to the ICD‐10, then categorized according to SEER site groups to maximize comparability with ICD‐O classifications. 2
Survival data for pancreatic cancer
Survival data for cases of malignant pancreatic cancer diagnosed from 2001–2017 were based on Cancer in North America data compiled by the NAACCR from 39 state registries (covering 79% of the US population) that met the NAACCR's vital status follow‐up standard for survival analyses during the entire study period, i.e., death ascertainment through the study cutoff date of December 31, 2017, or follow‐up dates on or after January 1, 2018, for a minimum of 90% of patients. 8 Cases were censored at an achieved age of 100 years. Cases identified by death certificate or autopsy only or without survival data were excluded from the survival analysis.
Population data
Population estimates by age, sex, race, and Hispanic origin were a modification of intercensal (for July 1, 2001–2009) and Vintage 2019 (for July 1, 2010–2019) annual county population estimates produced by the US Bureau of the Census Population Estimates Program, in collaboration with the National Center for Health Statistics and with support from the NCI. 9 The estimates incorporate bridged, single‐race estimates derived from the original multiple‐race categories in the 2000 and 2010 censuses. 10
Demographic characteristics
Rates and trends are presented by sex, racial/ethnic group, and age (all ages, children aged 0–14 years, and adolescents and young adults [AYAs] aged 15–39 years). Information about race and ethnicity was based on information abstracted from medical records for incidence and from death certificates for mortality. This information could either be self‐reported by the patient or inferred from data reported by the provider. In the current report, information about race and ethnicity was combined to create five mutually exclusive racial and ethnic (racial/ethnic) groups: non‐Hispanic White (White), non‐Hispanic Black (Black), non‐Hispanic American Indian/Alaska Native (AI/AN), non‐Hispanic Asian/Pacific Islander (API), and Hispanic (any race). For brevity, throughout the remainder of this report, these groups are referred to as White, Black, AI/AN, API, and Hispanic, respectively. Race information for AI/AN persons was considered reliable only for geographic areas covered by the Indian Health Service Purchased/Referred Care Delivery Areas (PRCDA); therefore, to minimize racial misclassification for AI/AN persons, incidence and mortality data for this group were based only on counties covered by PRCDA in states that provided county‐level information. 11 Persons with other or unknown race or unknown ethnicity were included in overall rates but were not included in separate racial/ethnic categories.
Statistical methods
Cross‐sectional incidence (2014–2018) and death (2015–2019) rates for all ages combined, for children, and for AYAs by cancer type and racial/ethnic group were calculated using SEER*Stat software, version 8.3.9.2. 12 All rates were age standardized to the 2000 US standard population and were expressed per 100,000 standard population. Corresponding 95% confidence intervals (CIs) were calculated as modified gamma intervals and allowed for informal comparisons between groups without specifying a referent group. Rates based on fewer than 20 cases or deaths during the 5‐year period were deemed to be statistically unreliable and were suppressed. Because delays in reporting cancer cases to cancer registries can cause incidence rates to be underestimated, all case counts and incidence rates were adjusted for reporting delay. 13 Incidence and death rates and trends are reported for males and females for each cancer type that ranked in the top 15 incident cancers or causes of cancer death for any racial/ethnic group, resulting in 18 cancer sites for males and females when reporting incidence and 19 cancer sites for males and 20 cancer sites for females when reporting death rates. For children, incidence and death rates and trends are presented for the third and second most common cancer types, respectively; for AYAs, these numbers were the sixth and fourth most common cancer types, respectively.
Temporal trends in delay‐adjusted and age‐adjusted incidence (2001–2018) and age‐adjusted death (2001–2019) rates were estimated using joinpoint regression. 14 A maximum of three joinpoints (four line segments) were allowed for both incidence and deaths. The annual percent change (APC) characterizes the slope of a single segment fit to the log of the rates, and the average APC (AAPC) is a summary measure over a fixed interval. Two‐sided, statistically significant (p < .05) tests for line segment differences from zero were determined using a t‐test for the APC and the AAPC when they were entirely within the last joinpoint segment and a z‐test when the last joinpoint fell within the last 5 years of data. When the slope of the trend (APC or AAPC) was statistically significant, the trend was considered increasing (slope >0) or decreasing (slope <0). The trend was considered stable when the slope was not significantly different from zero. Trends based on fewer than 10 cases/deaths in any of the data years were considered statistically unreliable and were suppressed. Corresponding 95% CIs for trends were calculated using the parametric method and allowed for informal, conservative comparisons between groups.
One‐year relative survival for pancreatic cancer cases diagnosed between 2001 and 2017 and 5‐year survival for pancreatic cancer cases diagnosed between 2001 and 2013—with all cases followed through 2018—were calculated based on complete dates and monthly intervals using the Ederer II actuarial method. 8 Annual trends in age‐standardized relative survival and 95% CIs were estimated by fitting a proportional hazard joinpoint model to survival data using the NCI's JPSurv software, with a maximum of two joinpoints (three line segments). 15 The modeled trend predicts the relative survival through diagnosis year 2018.
RESULTS
Cancer incidence rates and trends
The overall cancer incidence rate (per 100,000 population) during 2014–2018 was 457.5, with higher rates in males (497.4 per 100,000) than in females (430.9 per 100,000; Table 1). Trends in cancer incidence rates varied by sex (Table 2, Figure 1). Among males, incidence rates were stable during 2001–2007, decreased an average of 2.1% per year during 2007–2013, and became stable again during 2013–2018. Among females, incidence rates were stable during 2001–2003 and increased slightly during 2003–2018 (APC, 0.2%). During the most recent 5 years (2014–2018), incidence rates were stable in both sexes combined and among males but increased slightly among females (AAPC, 0.2%; Table 1, Figure 1).
TABLE 1.
Age‐standardized, delay‐adjusted incidence rates a and fixed‐interval trends (2014–2018) b for the most common cancers, c all ages, by sex, age group, and racial/ethnic group d for areas in the United States with high‐quality incidence data e
| Sex/cancer site or type | All racial/ethnic groups | Non‐Hispanic White | Non‐Hispanic Black | Non‐Hispanic API | Non‐Hispanic AI/AN, PRCDA | Hispanic | |||||||||||||
|---|---|---|---|---|---|---|---|---|---|---|---|---|---|---|---|---|---|---|---|
| Rank | Rate (95% CI) | AAPC (95% CI) | p | Rate (95% CI) | AAPC (95% CI) | p | Rate (95% CI) | AAPC (95% CI) | p | Rate (95% CI) | AAPC (95% CI) | p | Rate (95% CI) | AAPC (95% CI) | p | Rate (95% CI) | AAPC (95% CI) | p | |
| All sites f | |||||||||||||||||||
| Both sexes | 457.5 (457.2–457.8) | −0.2 (−0.5, 0.1) | .19 | 477.9 (477.5–478.3) | 0.0 (−0.4, 0.3) | .91 | 467.8 (466.8–468.8) | −0.7 (−1.1, −0.4) g | < .001 | 305.5 (304.3–306.6) | −0.3 (−0.3, −0.2) g | < .001 | 488.3 (482.9–493.8) | 0.6 (0.4–0.8) g | < .001 | 358.7 (357.9–359.6) | −0.1 (−0.4, 0.2) | .58 | |
| Males | 497.4 (497.0–497.9) | −0.4 (−1.2, 0.3) | .22 | 514.2 (513.6–514.7) | −0.2 (−0.9, 0.5) | .55 | 544.0 (542.4–545.7) | −1.2 (−1.8, −0.5) g | .004 | 306.3 (304.5–308.1) | −1.2 (−1.4, −1.1) g | < .001 | 515.0 (506.5–523.6) | 0.0 (−0.3, 0.3) | .86 | 384.0 (382.7–385.4) | −0.9 (−1.3, −0.5) g | < .001 | |
| Females | 430.9 (430.4–431.3) | 0.2 (0.1–0.3) g | < .001 | 454.0 (453.5–454.5) | 0.3 (0.2–0.4) g | < .001 | 416.7 (415.4–417.9) | −0.3 (−0.7, 0.0) | .07 | 309.1 (307.5–310.6) | 0.6 (0.6–0.7) g | < .001 | 473.3 (466.1–480.5) | 1.1 (0.9–1.3) g | < .001 | 346.7 (345.6–347.8) | 0.7 (0.5–0.9) g | < .001 | |
| Children, ages 0–14 years | 17.8 (17.7–18.0) | 0.0 (−1.6, 1.6) | 1.00 | 18.7 (18.5–18.9) | 1.0 (0.8–1.2) g | < .001 | 13.8 (13.5–14.2) | 0.0 (−1.1, 1.1) | .97 | 17.2 (16.6–17.9) | 2.3 (1.9–2.7) g | < .001 | 19.2 (17.4–21.2) | 1.9 (0.6–3.2) g | .006 | 17.6 (17.3–17.9) | 0.8 (0.6–1.1) g | < .001 | |
| AYAs, ages 15–39 years | 77.9 (77.6–78.1) | 0.9 (0.8–1.0) g | < .001 | 86.0 (85.7–86.4) | −0.2 (−1.5, 1.2) | .82 | 64.8 (64.2–65.4) | −0.7 (−2.2, 0.8) | .34 | 58.8 (58.0–59.6) | 1.0 (0.3–1.6) g | .008 | 90.0 (86.4–93.7) | 2.1 (1.6–2.6) g | < .001 | 65.8 (65.3–66.3) | 2.4 (2.0–2.9) g | < .001 | |
| Males | |||||||||||||||||||
| Prostate | 1 | 110.5 (110.3–110.7) | 3.0 (−1.1, 7.2) | .13 | 104.9 (104.6–105.1) | 3.7 (−0.8, 8.3) | .09 | 182.0 (181.1–183.0) | 1.6 (−1.1, 4.5) | .22 | 58.8 (58.0–59.6) | 4.4 (1.1–7.7) g | .01 | 89.1 (85.5–92.7) | 0.7 (−2.8, 4.3) | .67 | 96.0 (95.4–96.7) | 0.5 (−2.0, 3.2) | .65 |
| Lung and bronchus | 2 | 66.1 (66.0, 66.3) | −2.6 (−2.7, −2.4) g | < .001 | 70.0 (69.8–70.2) | −2.8 (−3.2, −2.3) g | < .001 | 78.3 (77.7–79.0) | −3.2 (−3.5, −2.9) g | < .001 | 43.3 (42.7–44.0) | −1.5 (−1.7, −1.3) g | < .001 | 73.0 (69.7–76.3) | −5.3 (−9.9, −0.6) g | .03 | 34.9 (34.5–35.3) | −2.7 (−2.9, −2.5) g | < .001 |
| Colon and rectum | 3 | 44.2 (44.0–44.3) | −1.2 (−1.6, −0.7) g | < .001 | 43.9 (43.7–44.0) | −1.2 (−1.5, −0.8) g | < .001 | 52.6 (52.0–53.1) | −2.7 (−2.9, −2.5) g | < .001 | 35.9 (35.3–36.5) | −2.0 (−2.3, −1.8) g | < .001 | 60.6 (57.7–63.6) | −0.2 (−0.9, 0.4) | .48 | 41.9 (41.4–42.3) | −2.0 (−2.3, −1.8) g | < .001 |
| Urinary bladder | 4 | 34.6 (34.4–34.7) | −2.1 (−2.9, −1.2) g | < .001 | 39.0 (38.9–39.2) | −2.0 (−2.8, −1.2) g | < .001 | 19.8 (19.5–20.1) | −1.7 (−2.9, −0.4) g | .01 | 15.2 (14.8–15.7) | −0.7 (−0.9, −0.4) g | < .001 | 27.0 (24.9–29.2) | 1.8 (0.9–2.7) g | .001 | 18.8 (18.5–19.1) | −1.4 (−1.6, −1.2) g | < .001 |
| Melanoma of the skin | 5 | 29.3 (29.2–29.4) | 0.5 (−1.6, 2.6) | .62 | 37.9 (37.7–38.0) | 2.5 (2.2–2.7) g | < .001 | 1.1 (1.1–1.2) | −0.3 (−1.3, 0.6) | .50 | 1.6 (1.5–1.8) | −0.1 (−0.7, 0.4) | .62 | 13.6 (12.2–15.2) | −4.1 (−10.1, 2.3) | .20 | 5.1 (5.0–5.3) | 0.3 (−0.2, 0.9) | .23 |
| Non‐Hodgkin lymphoma | 6 | 23.7 (23.6–23.8) | −0.9 (−1.7, −0.1) g | .03 | 25.0 (24.9–25.2) | −0.8 (−1.5, −0.1) g | .02 | 17.9 (17.6–18.2) | 0.2 (−0.1, 0.4) | .15 | 16.5 (16.1–16.9) | 0.4 (0.1–0.7) g | .03 | 20.1 (18.5–21.9) | 0.0 (−1.0, 1.0) | .97 | 20.4 (20.1–20.7) | 0.1 (−0.2, 0.4) | .54 |
| Kidney and renal pelvis | 7 | 23.6 (23.5–23.7) | 0.7 (0.4–1.1) g | < .001 | 24.0 (23.9–24.2) | 1.0 (0.4–1.6) g | .001 | 26.7 (26.3–27.1) | −1.4 (−3.3, 0.5) | .15 | 11.7 (11.3–12.0) | 0.7 (−0.4, 1.7) | .19 | 41.7 (39.4–44.1) | 2.6 (1.7–3.5) g | < .001 | 21.8 (21.5–22.1) | 0.8 (−1.0, 2.7) | .37 |
| Leukemia | 8 | 19.5 (19.4–19.6) | −0.6 (−1.4, 0.1) | .10 | 20.9 (20.8–21.0) | −1.0 (−2.3, 0.3) | .11 | 14.8 (14.5–15.1) | 0.9 (0.4–1.3) g | < .001 | 11.0 (10.7–11.3) | 0.6 (−0.7, 1.9) | .33 | 17.7 (16.2–19.4) | 1.4 (0.4–2.5) g | .01 | 14.4 (14.2–14.7) | 0.7 (0.3–1.1) g | .002 |
| Oral cavity and pharynx | 9 | 18.4 (18.3–18.5) | 0.2 (−1.2, 1.7) | .73 | 20.5 (20.3–20.6) | 0.7 (−0.7, 2.1) | .34 | 14.0 (13.8–14.3) | −1.9 (−2.1, −1.6) g | < .001 | 12.2 (11.8–12.5) | 0.9 (0.5–1.3) g | < .001 | 19.6 (18.1–21.3) | 2.3 (1.2–3.4) g | < .001 | 11.2 (11.0–11.4) | −0.5 (−0.8, −0.1) g | .01 |
| Pancreas | 10 | 15.1 (15.0–15.2) | 1.1 (1.0–1.2) g | < .001 | 15.3 (15.2–15.4) | 1.3 (1.2–1.4) g | < .001 | 18.0 (17.7–18.3) | 0.7 (0.4–0.9) g | < .001 | 10.5 (10.2–10.9) | 0.6 (0.3–0.9) g | .001 | 16.7 (15.2–18.3) | 2.6 (1.2–4.0) g | .001 | 12.3 (12.0–12.5) | 0.6 (0.3–0.8) g | < .001 |
| Liver and intrahepatic bile duct | 11 | 13.4 (13.3–13.4) | 0.4 (−0.5, 1.3) | .42 | 11.2 (11.1–11.3) | 1.3 (0.5–2.1) g | .003 | 18.2 (17.9–18.5) | −2.3 (−4.7, 0.2) | .07 | 19.6 (19.1–20.0) | −2.1 (−3.1, −1.1) g | .001 | 27.9 (26.1–29.8) | 4.6 (3.3–6.0) g | < .001 | 20.1 (19.8–20.4) | 0.4 (−0.3, 1.1) | .25 |
| Myeloma | 12 | 9.2 (9.1–9.2) | 0.0 (−0.8, 0.9) | .97 | 8.3 (8.3–8.4) | 0.0 (−1.2, 1.1) | .96 | 18.0 (17.7–18.3) | 0.1 (−1.8, 2.0) | .92 | 5.3 (5.0–5.5) | −1.2 (−3.4, 1.1) | .28 | 10.8 (9.6–12.2) | 2.4 (0.9–4.0) g | .004 | 8.4 (8.2–8.6) | 1.2 (0.7–1.7) g | < .001 |
| Stomach | 13 | 8.8 (8.8–8.9) | −1.8 (−2.5, −1.1) g | < .001 | 7.5 (7.4–7.6) | −1.6 (−2.0, −1.2) g | < .001 | 13.5 (13.3–13.8) | −1.9 (−2.1, −1.7 g ) | < .001 | 12.8 (12.5–13.2) | −2.9 (−3.2, −2.5) g | < .001 | 13.4 (12.0–14.8) | −2.0 (−2.9, −1.0) g | .001 | 11.9 (11.6–12.1) | −1.9 (−2.2, −1.7) g | < .001 |
| Esophagus | 14 | 7.9 (7.8–8.0) | −0.2 (−0.7, 0.2) | .26 | 8.8 (8.7–8.9) | 0.3 (−0.2, 0.9) | .22 | 6.1 (5.9–6.2) | −4.6 (−4.9, −4.4) g | < .001 | 3.6 (3.4–3.8) | −1.0 (−1.8, −0.2) g | .02 | 9.5 (8.5–10.7) | 0.6 (−1.0, 2.2) | .42 | 4.9 (4.7–5.1) | −1.5 (−1.9, −1.1) g | < .001 |
| Brain and other nervous system | 15 | 7.8 (7.7–7.8) | −0.3 (−0.4, −0.2) g | < .001 | 8.8 (8.8–8.9) | 0.0 (−0.1, 0.1) | .51 | 4.9 (4.7–5.1) | 0.1 (−0.3, 0.5) | .68 | 4.6 (4.4–4.8) | 0.3 (−0.3, 0.9) | .29 | 6.8 (5.9–7.8) | 1.2 (−0.4, 2.8) | .13 | 5.8 (5.6–5.9) | −0.6 (−0.9, −0.4) g | < .001 |
| Thyroid | 16 | 7.4 (7.4–7.5) | −1.7 (−3.0, −0.4) g | .02 | 8.2 (8.2–8.3) | −1.7 (−3.0, −0.3) g | .02 | 3.9 (3.8–4.0) | −5.8 (−9.7, −1.8) g | .009 | 7.6 (7.4–7.9) | −0.5 (−2.8, 1.9) | .66 | 6.1 (5.3–7.0) | 4.7 (2.8–6.7) g | < .001 | 6.3 (6.2–6.5) | −0.3 (−3.7, 3.2) | .86 |
| Testis | 17 | 5.8 (5.8–5.9) | 0.5 (0.4–0.7) g | < .001 | 7.1 (7.0–7.2) | 0.5 (0.3–0.7) g | < .001 | 1.6 (1.5–1.7) | 1.1 (0.4–1.7) g | .003 | 2.1 (2.0–2.3) | 2.2 (1.3–3.1) g | < .001 | 7.5 (6.6–8.4) | 2.4 (0.9–4.0) g | .004 | 5.3 (5.2–5.5) | 3.7 (2.9–4.5) g | < .001 |
| Larynx | 18 | 5.5 (5.4–5.5) | −2.4 (−2.5, −2.3) g | < .001 | 5.6 (5.5–5.6) | −2.5 (−2.9, −2.0) g | < .001 | 7.9 (7.8–8.2) | −3.2 (−3.4, −2.9) g | < .001 | 2.0 (1.9–2.2) | −2.4 (−3.5, −1.3) g | < .001 | 6.7 (5.8–7.7) | −0.6 (−2.0, 0.8) | .39 | 4.5 (4.3–4.6) | −3.2 (−3.6, −2.9) g | < .001 |
| Females | |||||||||||||||||||
| Breast | 1 | 128.5 (128.2–128.7) | 0.5 (0.4–0.6) g | < .001 | 134.7 (134.4–135.0) | 0.6 (0.4–0.7) g | < .001 | 129.7 (129.0–130.4) | −0.3 (−1.3, 0.7) | .59 | 102.1 (101.2–103.0) | 1.9 (1.6, 2.1) g | < .001 | 119.1 (115.6–122.8) | −1.8 (−5.3, 1.9) | .31 | 98.7 (98.1–99.3) | 1.1 (0.7–1.5) g | < .001 |
| Lung and bronchus | 2 | 51.0 (50.9–51.1) | −1.1 (−1.2, −0.9) g | < .001 | 56.8 (56.6–56.9) | −0.8 (−1.0, −0.7) g | < .001 | 47.8 (47.4–48.3) | −1.6 (−1.9, −1.3) g | < .001 | 28.6 (28.1–29.1) | 0.1 (−0.1, 0.3) | .33 | 61.5 (59.0–64.2) | 0.3 (−0.1, 0.8) | .14 | 23.1 (22.8–23.4) | −0.7 (−0.9, −0.5) g | < .001 |
| Colon and rectum | 3 | 33.9 (33.7–34.0) | −1.2 (−1.9, −0.5) g | .001 | 33.9 (33.8–34.0) | −1.1 (−1.6, −0.7) g | < .001 | 39.1 (38.7–39.5) | −1.9 (−2.5, −1.3) g | < .001 | 26.0 (25.6–26.5) | −2.3 (−2.5, −2.0) g | < .001 | 48.4 (46.1–50.7) | −0.2 (−0.7, 0.3) | .41 | 30.0 (29.7–30.3) | 0.0 (−0.7, 0.8) | .89 |
| Corpus and uterus, NOS | 4 | 27.7 (27.6–27.8) | 0.8 (−0.1, 1.7) | .07 | 28.1 (28.0–28.3) | 0.4 (−0.4, 1.1) | .32 | 28.5 (28.1–28.8) | 2.4 (2.2–2.5) g | < .001 | 21.0 (20.6–21.4) | 2.5 (2.2–2.7) g | < .001 | 29.8 (28.1–31.6) | 2.1 (1.5–2.8) g | < .001 | 25.2 (25.0–25.5) | 2.2 (1.9–2.4) g | < .001 |
| Thyroid | 5 | 21.2 (21.1–21.3) | −2.9 (−3.9, −1.8) g | < .001 | 22.3 (22.2–22.4) | −3.1 (−4.4, −1.8) g | < .001 | 13.5 (13.2–13.7) | −5.3 (−7.8, −2.7) g | .001 | 22.6 (22.2–23.1) | −1.1 (−2.4, 0.2) | .08 | 21.7 (20.2–23.2) | 5.5 (4.5–6.5) g | < .001 | 23.1 (22.8–23.4) | −0.6 (−2.5, 1.4) | .55 |
| Melanoma of the skin | 6 | 18.2 (18.2–18.3) | 1.8 (1.6–2.0) g | < .001 | 25.0 (24.9–25.1) | 2.4 (2.1–2.7) g | < .001 | 0.9 (0.9–1.0) | −0.9 (−1.6, −0.1) g | .03 | 1.3 (1.2–1.4) | −0.4 (−1.4, 0.6) | .42 | 9.4 (8.3–10.5) | 3.3 (2.1–4.5) g | < .001 | 4.6 (4.4, 4.7) | 0.7 (0.1, 1.3) g | .04 |
| Non‐Hodgkin lymphoma | 7 | 16.3 (16.2–16.4) | −0.1 (−0.2, 0.0) g | .03 | 17.0 (16.9–17.1) | −0.2 (−0.3, 0.0) g | .01 | 12.7 (12.5–12.9) | 0.5 (0.2–0.7) g | < .001 | 11.4 (11.1–11.7) | 0.2 (−0.2, 0.7) | .28 | 16.4 (15.0–17.8) | −0.1 (−0.8, 0.7) | .83 | 15.7 (15.4, 15.9) | 0.3 (0.1–0.6) g | .005 |
| Kidney and renal pelvis | 8 | 12.0 (12.0–12.1) | 1.2 (0.8–1.7) g | < .001 | 12.1 (12.0–12.2) | 1.3 (0.7–1.9) g | .001 | 13.8 (13.6–14.0) | 0.5 (0.0–1.0) g | .05 | 5.6 (5.4–5.9) | 1.4 (0.7–2.1) g | .001 | 23.4 (21.8–25.0) | 2.3 (1.4–3.2) g | < .001 | 12.3 (12.1, 12.5) | 1.6 (1.4–1.9) g | < .001 |
| Leukemia | 9 | 11.9 (11.8–11.9) | 0.1 (−0.3, 0.6) g | .54 | 12.5 (12.4–12.6) | 0.2 (−0.4, 0.8) | .41 | 9.7 (9.6–9.9) | 0.1 (−0.8, 1.0) | .86 | 7.0 (6.7–7.2) | 1.2 (0.8–1.6) g | < .001 | 11.0 (9.9–12.1) | 1.6 (0.4–2.9) g | .01 | 10.1 (9.9, 10.3) | 1.0 (0.7–1.3) g | < .001 |
| Pancreas | 10 | 11.6 (11.5–11.7) | 1.0 (1.0–1.1) g | < .001 | 11.4 (11.3–11.5) | 1.1 (1.0–1.2) g | < .001 | 15.2 (15.0–15.5) | 0.7 (0.5–1.0) g | < .001 | 9.0 (8.7–9.2) | 0.8 (0.5–1.1) g | < .001 | 12.6 (11.4–13.8) | 1.0 (0.0–2.1) g | .05 | 10.5 (10.3–0.7) | 0.9 (0.6–1.1) g | < .001 |
| Ovary | 11 | 10.9 (10.9–11.0) | −2.5 (−3.5, −1.5) g | < .001 | 11.3 (11.2–11.4) | −2.9 (−4.2, −1.7) g | < .001 | 9.0 (8.8–9.2) | −1.0 (−1.3, −0.7) g | < .001 | 9.4 (9.2–9.7) | −0.2 (−0.6, 0.1) | .22 | 13.1 (11.9–14.3) | −0.3 (−1.5, 1.0) | .68 | 10.0 (9.9–10.2) | −1.2 (−1.5, −1.0) g | < .001 |
| Urinary bladder | 12 | 8.6 (8.5–8.6) | −0.9 (−1.1, −0.8) g | < .001 | 9.6 (9.6–9.7) | −0.7 (−0.9, −0.6) g | < .001 | 6.7 (6.5–6.8) | −0.6 (−0.8, −0.3) g | < .001 | 3.7 (3.5–3.9) | −0.7 (−1.4, 0.0) g | .04 | 6.5 (5.6–7.4) | 1.7 (0.2–3.1) g | .03 | 5.0 (4.8–5.1) | −1.1 (−1.5, −0.6) g | < .001 |
| Cervix | 13 | 7.9 (7.8–7.9) | 0.1 (−2.5, 2.8) | .92 | 7.4 (7.3–7.5) | 0.1 (−2.8, 3.1) | .95 | 9.0 (8.8–9.2) | −1.7 (−2.2, −1.2) g | < .001 | 6.2 (6.0–6.5) | −1.5 (−2.1, −0.9) g | < .001 | 11.5 (10.4–12.7) | 0.5 (−0.4, 1.4) | .27 | 9.9 (9.8–10.1) | 0.3 (−0.9, 1.5) | .61 |
| Oral cavity and pharynx | 14 | 6.6 (6.5–6.6) | 0.5 (0.4–0.6) g | < .001 | 7.2 (7.1–7.3) | 0.9 (0.7–1.0) g | < .001 | 5.2 (5.0–5.3) | −0.7 (−1.0, −0.5) g | < .001 | 5.3 (5.1–5.5) | 0.1 (−0.6, 0.7) | .82 | 7.0 (6.2–7.9) | 0.5 (−1.1, 2.1) | .52 | 4.5 (4.3–4.6) | 0.5 (0.0–1.0) | .06 |
| Myeloma | 15 | 6.0 (6.0–6.1) | 1.4 (1.0–1.7) g | < .001 | 5.1 (5.0–5.1) | 1.0 (0.5–1.5) g | .002 | 13.3 (13.1–13.5) | 2.1 (1.8–2.4) g | < .001 | 3.3 (3.1–3.5) | 0.9 (0.3–1.6) g | .006 | 7.8 (6.9–8.8) | 1.4 (−0.1, 2.9) | .07 | 6.1 (6.0–6.3) | 2.2 (1.5–2.8) g | < .001 |
| Brain and other nervous system | 16 | 5.6 (5.5–5.6) | −0.5 (−0.7, −0.3) g | < .001 | 6.4 (6.3–6.4) | −0.3 (−0.5, −0.1) g | .008 | 3.6 (3.5–3.7) | −0.4 (−0.8, 0.0) | .07 | 3.3 (3.2–3.5) | 0.3 (−0.3, 0.8) | .32 | 4.7 (4.1–5.5) | 0.7 (−1.3, 2.8) | .45 | 4.6 (4.5–4.7) | −0.3 (−0.7, 0.0) | .06 |
| Liver and intrahepatic bile duct | 17 | 4.8 (4.7–4.8) | 1.6 (0.3–3.0) g | .02 | 4.0 (4.0–4.1) | 3.8 (3.5–4.1) g | < .001 | 5.6 (5.5–5.8) | 0.7 (−1.9, 3.3) | .59 | 7.3 (7.0–7.5) | −4.6 (−7.7, −1.4) g | .009 | 11.8 (10.7–12.9) | 3.3 (2.0–4.6) g | < .001 | 7.9 (7.7–8.0) | 2.3 (2.0–2.6) g | < .001 |
| Stomach | 18 | 4.7 (4.7–4.8) | 0.1 (−0.2, 0.4) | .36 | 3.5 (3.5–3.6) | 0.0 (−0.5, 0.4) | .83 | 7.6 (7.4–7.7) | −1.2 (−1.4, −0.9) g | < .001 | 7.5 (7.3–7.8) | −2.6 (−3.1, −2.2) g | < .001 | 7.9 (7.0–8.9) | −0.3 (−1.6, 1.1) | .68 | 7.7 (7.5–7.8) | −1.0 (−1.4, −0.7) g | < .001 |
| Children | |||||||||||||||||||
| Leukemia | 5.3 (5.2–5.4) | 0.7 (0.4–1.0) g | < .001 | 5.2 (5.1–5.4) | 0.5 (0.3–0.8) g | .001 | 3.3 (3.1–3.5) | 1.2 (0.6–1.7) g | < .001 | 5.8 (5.4–6.1) | 1.1 (0.4–1.8) g | .006 | 6.6 (5.6–7.9) | 1.0 (−1.0, 2.9) | .31 | 6.4 (6.2–6.6) | 0.8 (0.3–1.2) g | .002 | |
| Brain and other nervous system | 3.8 (3.7–3.9) | 0.7 (0.4–1.0) g | < .001 | 4.3 (4.2–4.4) | 0.8 (0.5–1.2) g | < .001 | 3.0 (2.8–3.2) | 1.3 (0.7–2.0) g | < .001 | 3.1 (2.8–3.3) | 1.4 (0.4–2.4) g | .01 | 3.6 (2.8–4.5) | — h | 3.1 (2.9–3.2) | 0.1 (−0.3, 0.5) | .62 | ||
| Lymphoma | 1.7 (1.6–1.7) | 0.9 (0.6–1.3) g | < .001 | 1.7 (1.7–1.8) | 1.0 (0.4–1.5) g | .001 | 1.6 (1.5–1.8) | 1.4 (0.6–2.1) g | .001 | 1.6 (1.4–1.8) | 1.0 (−0.2, 2.3) | .09 | 1.5 (1.0–2.1) | — h | 1.5 (1.4–1.6) | 0.2 (−0.3, 0.7) | .35 | ||
| AYAs | |||||||||||||||||||
| Thyroid | 12.0 (11.9–12.0) | −2.0 (−3.6, −0.3) g | .02 | 13.6 (13.4–13.7) | −2.7 (−4.5, −0.7) g | .007 | 5.5 (5.3–5.6) | −6.0 (−9.7, −2.2) g | .005 | 12.7 (12.3–13.0) | 0.1 (−1.7, 1.9) | .92 | 13.2 (11.8–14.6) | 5.2 (4.1–6.3) g | < .001 | 10.8 (10.6–11.0) | 0.7 (−2.7, 4.3) | .65 | |
| Female breast | 22.8 (22.6–23.0) | 1.0 (0.6–1.4) g | < .001 | 23.5 (23.2–23.7) | 0.6 (0.5–0.8) g | < .001 | 27.0 (26.5–27.6) | 0.3 (0.1–0.6) g | .02 | 20.4 (19.8–21.1) | 0.9 (0.5–1.4) g | < .001 | 21.7 (19.2–24.4) | 1.3 (−0.2, 2.8) | .10 | 18.3 (17.9–18.7) | 1.8 (0.9–2.8) g | .001 | |
| Lymphoma | 7.7 (7.6–7.8) | −0.4 (−0.5, −0.3) g | < .001 | 8.2 (8.1–8.3) | −0.4 (−0.6, −0.3) g | < .001 | 8.3 (8.1–8.5) | −0.8 (−1.3, −0.4) g | .001 | 5.6 (5.3–5.8) | 2.0 (1.6–2.5) g | < .001 | 6.0 (5.2–7.0) | 1.4 (−0.6, 3.4) | .17 | 6.2 (6.1–6.4) | 0.8 (0.0–1.7) g | .05 | |
| Melanoma of the skin | 6.7 (6.6–6.7) | −0.8 (−1.2, −0.5) g | < .001 | 10.6 (10.4–10.7) | −0.5 (−1.0, 0.0) g | .05 | 0.2 (0.2–0.3) | −1.8 (−3.4, −0.1) g | .04 | 0.5 (0.4–0.6) | −1.7 (−3.2, −0.3) g | .02 | 4.1 (3.3–5.0) | 0.8 (−0.8, 2.4) | .29 | 1.2 (1.2–1.3) | −1.6 (−2.2, −0.9) g | < .001 | |
| Testis | 11.1 (11.0–11.3) | 0.8 (0.6–0.9) g | < .001 | 13.5 (13.3–13.7) | 0.5 (0.3–0.7) g | < .001 | 2.6 (2.5–2.8) | 0.8 (−0.2, 1.7) | .10 | 4.2 (3.9–4.5) | 2.8 (1.7–3.8) g | < .001 | 14.6 (12.7–16.7) | 1.3 (−0.1, 2.7) | .07 | 11.6 (11.3–11.8) | 3.0 (2.7–3.4) g | < .001 | |
| Colon and rectum | 5.1 (5.0–5.2) | 5.0 (3.7–6.4) g | < .001 | 5.6 (5.5–5.7) | 3.2 (0.8–5.7) g | .009 | 4.9 (4.8–5.1) | 3.1 (2.1–4.1) g | < .001 | 3.4 (3.2–3.6) | 1.2 (0.3–2.1) g | .01 | 7.6 (6.6–8.8) | 3.4 (1.2–5.6) g | .005 | 4.1 (4.0–4.3) | 8.4 (6.1–10.8) g | < .001 | |
Abbreviations: AAPC, average annual percent change; AI/AN, American Indian/Alaska Native; APC, annual percent change; API, Asian/Pacific Islander; AYA, adolescents and young adults; NOS, not otherwise specified; PRCDA, Indian Health Service Purchased/Referred Care Delivery Area.
Rates are per 100,000 persons and were age standardized to the 2000 US standard population (19 age groups; US Bureau of the Census. Current Population Report P25‐1130. US Government Printing Office; 2000).
The AAPC is the average APC and is a weighted average of the APCs over the fixed interval 2014–2018 using the underlying joinpoint model for the period of 2001–2018. Joinpoint models with up to three joinpoints are based on rates per 100,000 persons and are age standardized to the 2000 US standard population (19 age groups; US Bureau of the Census, Current Population Report P25‐1130; National Cancer Institute; Joinpoint Regression Program, version 4.9.0.0; Surveillance Research Program, National Cancer Institute; 2021).
Cancers are sorted in descending order according to sex‐specific rates for all racial/ethnic groups. More than 15 cancers may appear under males and females to include the top 15 cancers in every racial/ethnic group.
White, Black, API, and AI/AN (PRCDA 2017 counties) include non‐Hispanic; the racial/ethnic categories are mutually exclusive.
Source: National Program of Cancer Registries and Surveillance, Epidemiology, and End Results Program areas reported by the North American Association of Central Cancer Registries as meeting high‐quality incidence data standards for the specified time periods. Registries included in the joinpoint models (2001–2018) for all racial/ethnic groups, White, Black, AI/AN, API, Hispanic, and non‐Hispanic (46 states): Alabama, Alaska, Arizona, Arkansas, California, Colorado, Connecticut, Delaware, Florida, Georgia, Hawaii, Idaho, Illinois, Indiana, Iowa, Kansas, Kentucky, Louisiana, Maine, Maryland, Massachusetts, Michigan, Minnesota, Missouri, Montana, Nebraska, New Hampshire, New Jersey, New Mexico, New York, North Carolina, North Dakota, Ohio, Oklahoma, Oregon, Pennsylvania, Rhode Island, South Carolina, South Dakota, Texas, Utah, Vermont, Washington, West Virginia, Wisconsin, and Wyoming. Registries included in the incidence rates (2014–2018) for all racial/ethnic groups, White, Black, AI/AN, API, Hispanic, and non‐Hispanic (49 states, the District of Columbia, and one territory): Alabama, Alaska, Arizona, Arkansas, California, Colorado, Connecticut, District of Columbia, Delaware, Florida, Georgia, Hawaii, Idaho, Illinois, Indiana, Iowa, Kansas, Kentucky, Louisiana, Maine, Maryland, Massachusetts, Michigan, Minnesota, Mississippi, Missouri, Montana, Nebraska, New Hampshire, New Jersey, New Mexico, New York, North Carolina, North Dakota, Ohio, Oklahoma, Oregon, Pennsylvania, Puerto Rico, Rhode Island, South Carolina, South Dakota, Tennessee, Texas, Utah, Vermont, Virginia, Washington, West Virginia, Wisconsin, and Wyoming.
For all sites, myelodysplastic syndromes are included for the rate and APC calculations; they are excluded from cancer‐specific analysis. Ovary excludes borderline tumors.
The AAPC is statistically significantly different from zero (two‐sided p < .05).
The statistic could not be calculated. The AAPC is based on <10 cases for at least 1 year within the time interval.
TABLE 2.
Joinpoint trends a in age‐standardized, delay‐adjusted incidence rates for the most common cancers, b all racial/ethnic groups combined by sex and age group, for areas in the United States with high‐quality incidence data, c 2001–2018
| Joinpoint analyses: 2001–2018 | ||||||||||||||
|---|---|---|---|---|---|---|---|---|---|---|---|---|---|---|
| Trend 1 | Trend 2 | Trend 3 | Trend 4 | Fixed interval 2014–2018 | ||||||||||
| Sex/cancer site or type | Years | APC (95% CI) | p | Years | APC (95% CI) | p | Years | APC (95% CI) | p | Years | APC (95% CI) | p | AAPC (95% CI) d | p |
| All sites e | ||||||||||||||
| Both sexes | 2001–2004 | −1.1 (−2.1, −0.1) f | .03 | 2004–2007 | 0.7 (−1.3, 2.7) | .44 | 2007–2012 | −1.1 (−1.7, −0.5) f | .003 | 2012–2018 | −0.2 (−0.5, 0.1) | .19 | −0.2 (−0.5, 0.1) | .19 |
| Males | 2001–2004 | −1.6 (−3.3, 0.2) | .07 | 2004–2007 | 0.5 (−2.9, 4.0) | .75 | 2007–2013 | −2.1 (−2.8, −1.3) f | < .001 | 2013–2018 | −0.4 (−1.2, 0.3) | .22 | −0.4 (−1.2, 0.3) | .22 |
| Females | 2001–2003 | −0.9 (−2.7, 0.9) | .28 | 2003–2018 | 0.2 (0.1–0.3) f | < .001 | 0.2 (0.1–0.3) f | < .001 | ||||||
| Children, ages 0–14 years | 2001–2015 | 1.2 (0.9–1.4) f | < .001 | 2015–2018 | −0.4 (−2.7, 1.9) | .72 | 0.0 (−1.6, 1.6) | 1.00 | ||||||
| AYA, ages 15–39 years | 2001–2018 | 0.9 (0.8–1.0) f | < .001 | 0.9 (0.8–1.0) f | < .001 | |||||||||
| Males | ||||||||||||||
| Prostate | 2001–2004 | −5.1 (−10.8, 0.9) | .08 | 2004–2007 | 2.9 (−8.9, 16.3) | .59 | 2007–2014 | −6.5 (−8.5, −4.5) f | < .001 | 2014–2018 | 3.0 (−1.1, 7.2) | .13 | 3.0 (−1.1, 7.2) | .13 |
| Lung and bronchus | 2001–2007 | −1.5 (−1.9, −1.2) f | < .001 | 2007–2018 | −2.6 (−2.7, −2.4) f | < .001 | −2.6 (−2.7, −2.4) f | < .001 | ||||||
| Colon and rectum | 2001–2012 | −3.2 (−3.4, −3.1) f | < .001 | 2012–2018 | −1.2 (−1.6, −0.7) f | < .001 | −1.2 (−1.6, −0.7) f | < .001 | ||||||
| Urinary bladder | 2001–2005 | 0.1 (−0.6, 0.7) | .81 | 2005–2016 | −0.9 (−1.0, −0.7) f | < .001 | 2016–2018 | −3.3 (−5.1, −1.4) f | .003 | −2.1 (−2.9, −1.2) f | < .001 | |||
| Melanoma of the skin | 2001–2016 | 2.2 (2.0–2.4) f | < .001 | 2016–2018 | −1.1 (−5.6, 3.5) | .60 | 0.5 (−1.6, 2.6) | .62 | ||||||
| Non‐Hodgkin lymphoma | 2001–2014 | 0.2 (0.1–0.4) f | .004 | 2014–2018 | −0.9 (−1.7, −0.1) f | .03 | −0.9 (−1.7, −0.1) f | .03 | ||||||
| Kidney and renal pelvis | 2001–2007 | 3.0 (2.9–3.2) f | < .001 | 2007–2011 | −0.1 (−0.5, 0.3) | .66 | 2011–2016 | 1.7 (1.5–2.0) f | < .001 | 2016–2018 | −0.2 (−1.0, 0.5) | .48 | 0.7 (0.4–1.1) f | < .001 |
| Leukemia | 2001–2008 | 0.0 (−0.6, 0.5) | .89 | 2008–2013 | 2.6 (1.5–3.8) f | < .001 | 2013–2018 | −0.6 (−1.4, 0.1) | .10 | −0.6 (−1.4, 0.1) | .10 | |||
| Oral cavity and pharynx | 2001–2005 | −0.1 (−1.3, 1.1) | .83 | 2005–2016 | 1.2 (0.9–1.5) f | < .001 | 2016–2018 | −0.7 (−3.8, 2.5) | .64 | 0.2 (−1.2, 1.7) | .73 | |||
| Pancreas | 2001–2018 | 1.1 (1.0–1.2) f | < .001 | 1.1 (1.0–1.2) f | < .001 | |||||||||
| Liver and intrahepatic bile duct | 2001–2009 | 4.5 (4.1–5.0) f | < .001 | 2009–2015 | 2.9 (2.2–3.6) f | < .001 | 2015–2018 | −0.4 (−1.8, 0.9) | .48 | 0.4 (−0.5, 1.3) | .42 | |||
| Myeloma | 2001–2007 | 0.7 (0.1–1.3) f | .02 | 2007–2014 | 2.7 (2.2–3.3) f | < .001 | 2014–2018 | 0.0 (−0.8, 0.9) | .97 | 0.0 (−0.8, 0.9) | .97 | |||
| Stomach | 2001–2007 | −1.9 (−2.5, −1.4) f | < .001 | 2007–2013 | −0.2 (−0.9, 0.5) | .56 | 2013–2018 | −1.8 (−2.5, −1.1) f | < .001 | −1.8 (−2.5, −1.1) f | < .001 | |||
| Esophagus | 2001–2008 | 0.3 (−0.2, 0.8) | .26 | 2008–2011 | −3.0 (−6.4, 0.4) | .08 | 2011–2018 | −0.2 (−0.7, 0.2) | .26 | −0.2 (−0.7, 0.2) | .26 | |||
| Brain and other nervous system | 2001–2018 | −0.3 (−0.4, −0.2) f | < .001 | −0.3 (−0.4, −0.2) f | < .001 | |||||||||
| Thyroid | 2001–2009 | 7.0 (6.4–7.6) f | < .001 | 2009–2014 | 2.3 (0.9–3.7) f | .004 | 2014–2018 | −1.7 (−3.0, −0.4) f | .02 | −1.7 (−3.0, −0.4) f | .02 | |||
| Testis | 2001‐2018 | 0.5 (0.4–0.7) f | < .001 | 0.5 (0.4–0.7) f | < .001 | |||||||||
| Larynx | 2001‐2018 | −2.4 (−2.5, −2.3) f | < .001 | −2.4 (−2.5, −2.3) f | < .001 | |||||||||
| Females | ||||||||||||||
| Breast | 2001–2004 | −2.9 (−4.3, −1.6) f | .001 | 2004–2018 | 0.5 (0.4–0.6) f | < .001 | 0.5 (0.4–0.6) f | < .001 | ||||||
| Lung and bronchus | 2001–2006 | 0.6 (0.2–1.1) f | .01 | 2006–2018 | −1.1 (−1.2, −0.9) f | < .001 | −1.1 (−1.2, −0.9) f | < .001 | ||||||
| Colon and rectum | 2001–2007 | −2.4 (−2.6, −2.2) f | < .001 | 2007–2012 | −3.4 (−3.9, −2.9) f | < .001 | 2012–2016 | −0.3 (−1.0, 0.5) | .45 | 2016–2018 | −2.1 (−3.6, −0.6) f | .01 | −1.2 (−1.9, −0.5) f | .001 |
| Corpus and uterus, NOS | 2001–2003 | −2.1 (−3.8, −0.4) f | .02 | 2003–2013 | 1.3 (1.1–1.4) f | < .001 | 2013–2016 | 1.8 (0.3–3.3) f | .02 | 2016–2018 | −0.2 (−1.6, 1.2) | .74 | 0.8 (−0.1, 1.7) | .07 |
| Thyroid | 2001–2009 | 7.3 (6.9–7.8) f | < .001 | 2009–2014 | 2.0 (1.0–3.1) f | .002 | 2014–2018 | −2.9 (−3.9, −1.8) f | < .001 | −2.9 (−3.9, −1.8) f | < .001 | |||
| Melanoma of the skin | 2001–2018 | 1.8 (1.6–2.0) f | < .001 | 1.8 (1.6–2.0) f | < .001 | |||||||||
| Non‐Hodgkin lymphoma | 2001–2018 | −0.1 (−0.2, 0.0) f | .03 | −0.1 (−0.2, 0.0) f | .03 | |||||||||
| Kidney and renal pelvis | 2001–2007 | 3.6 (2.9–4.2) f | < .001 | 2007–2011 | −0.4 (−2.1, 1.2) | .57 | 2011–2018 | 1.2 (0.8–1.7) f | < .001 | 1.2 (0.8–1.7) f | < .001 | |||
| Leukemia | 2001–2008 | 0.2 (−0.3, 0.7) | .36 | 2008–2011 | 3.7 (0.1–7.5) f | .05 | 2011–2018 | 0.1 (−0.3, 0.6) | .54 | 0.1 (−0.3, 0.6) | .54 | |||
| Pancreas | 2001–2018 | 1.0 (1.0–1.1) f | < .001 | 1.0 (1.0–1.1) f | < .001 | |||||||||
| Ovary | 2001–2015 | −1.5 (−1.7, −1.4) f | < .001 | 2015–2018 | −2.8 (−4.4, −1.3) f | .001 | −2.5 (−3.5, −1.5) f | < .001 | ||||||
| Urinary bladder | 2001–2018 | −0.9 (−1.1, −0.8) f | < .001 | −0.9 (−1.1, −0.8) f | < .001 | |||||||||
| Cervix | 2001–2003 | −3.7 (−7.7, 0.5) | .08 | 2003–2013 | −1.1 (−1.5, −0.7) f | < .001 | 2013–2016 | 1.9 (−2.5, 6.6) | .35 | 2016–2018 | −1.6 (−5.9, 2.9) | .42 | 0.1 (−2.5, 2.8) | .92 |
| Oral cavity and pharynx | 2001–2018 | 0.5 (0.4–0.6) f | < .001 | 0.5 (0.4–0.6) f | < .001 | |||||||||
| Myeloma | 2001–2007 | 0.2 (−0.4, 0.8) | .50 | 2007–2011 | 3.4 (1.8–5.1) f | .001 | 2011–2018 | 1.4 (1.0–1.7) f | < .001 | 1.4 (1.0–1.7) f | < .001 | |||
| Brain and other nervous system | 2001–2005 | 0.8 (−0.4, 2.0) | .18 | 2005–2018 | −0.5 (−0.7, −0.3) f | < .001 | −0.5 (−0.7, −0.3) f | < .001 | ||||||
| Liver and intrahepatic bile duct | 2001–2015 | 3.8 (3.6–4.1) f | < .001 | 2015–2018 | 0.9 (−1.1, 2.9) | .34 | 1.6 (0.3–3.0) f | .02 | ||||||
| Stomach | 2001–2008 | −1.1 (−1.6, −0.6) f | .001 | 2008–2018 | 0.1 (−0.2, 0.4) | .36 | 0.1 (−0.2, 0.4) | .36 | ||||||
| Children | ||||||||||||||
| Leukemia | 2001–2018 | 0.7 (0.4–1.0) f | < .001 | 0.7 (0.4–1.0) f | < .001 | |||||||||
| Brain and other nervous system | 2001–2018 | 0.7 (0.4–1.0) f | <. 001 | 0.7 (0.4–1.0) f | < .001 | |||||||||
| Lymphoma | 2001–2018 | 0.9 (0.6–1.3) f | <. 001 | 0.9 (0.6–1.3) f | < .001 | |||||||||
| AYAs | ||||||||||||||
| Thyroid | 2001–2006 | 5.0 (3.4–6.6) f | < .001 | 2006–2009 | 7.4 (1.1–14.2) f | .03 | 2009–2015 | 2.4 (1.1–3.7) f | .003 | 2015–2018 | −3.4 (−6.0, −0.7) f | .02 | −2.0 (−3.6, −0.3) f | .02 |
| Female breast | 2001–2010 | 0.0 (−0.3, 0.4) | .77 | 2010–2018 | 1.0 (0.6–1.4) f | < .001 | 1.0 (0.6–1.4) f | < .001 | ||||||
| Lymphoma | 2001–2018 | −0.4 (−0.5, −0.3) f | < .001 | −0.4 (−0.5, −0.3) f | < .001 | |||||||||
| Melanoma of the skin | 2001–2018 | −0.8 (−1.2, −0.5) f | < .001 | −0.8 (−1.2, −0.5) f | < .001 | |||||||||
| Testis | 2001–2018 | 0.8 (0.6–0.9) f | < .001 | 0.8 (0.6–0.9) f | < .001 | |||||||||
| Colon and rectum | 2001–2011 | 1.9 (1.1–2.8) f | < .001 | 2011–2018 | 5.0 (3.7–6.4) f | <.001 | 5.0 (3.7–6.4) f | < .001 | ||||||
Abbreviations: AAPC, average annual percent change; APC, annual percent change; AYAs, adolescents and young adults; NOS, not otherwise specified.
Joinpoint models with up to three joinpoints are based on rates per 100,000 persons and are age standardized to the 2000 US standard population (19 age groups [US Bureau of the Census. Current Population Report P25‐1130. US Government Printing Office; 2000]; National Cancer Institute Joinpoint Regression Program, version 4.9.0.0 [Surveillance Research Program, National Cancer Institute; 202114]).
Cancers are listed in descending rank order of sex‐specific, age‐adjusted incidence rates for 2014–2018 for all racial/ethnic groups combined (using data from the National Program of Cancer Registries and Surveillance, Epidemiology, and End Results Program areas reported by the North American Association of Central Cancer Registries as meeting high‐quality incidence data standards for 2001–2018). More than 15 cancers may appear under men and women to include the top 15 cancers in each racial/ethnic group.
Source: The National Program of Cancer Registries and Surveillance, Epidemiology, and End Results Program areas reported by the North American Association of Central Cancer Registries as meeting high‐quality incidence data standards for the specified time periods. Registries included in the joinpoint models (2001–2018) for all racial/ethnic groups (46 states): Alabama, Alaska, Arizona, Arkansas, California, Colorado, Connecticut, Delaware, Florida, Georgia, Hawaii, Idaho, Illinois, Indiana, Iowa, Kansas, Kentucky, Louisiana, Maine, Maryland, Massachusetts, Michigan, Minnesota, Missouri, Montana, Nebraska, New Hampshire, New Jersey, New Mexico, New York, North Carolina, North Dakota, Ohio, Oklahoma, Oregon, Pennsylvania, Rhode Island, South Carolina, South Dakota, Texas, Utah, Vermont, Washington, West Virginia, Wisconsin, and Wyoming.
The AAPC is the average APC and is a weighted average of the APCs over the fixed interval 2014–2018 using the underlying joinpoint model for the period of 2001–2018.
For all sites, myelodysplastic syndromes are included for the APC calculations; they are excluded from cancer‐specific analysis. Ovary excludes borderline tumors.
The APC or AAPC is statistically significantly different from zero (two‐sided t‐test; p < .05).
FIGURE 1.
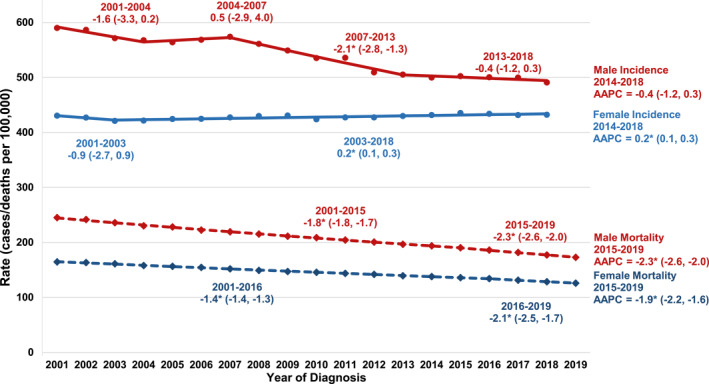
Trends in age‐standardized incidence (2001−2018) and mortality (2001−2019) rates are illustrated for all cancer sites combined, all ages and all racial/ethnic groups combined, by sex. Trends were estimated using joinpoint regression and characterized by using the annual percent change (APC), the slope of a single segment, and the average APC (AAPC), a summary measure of the APCs over a fixed 5‐year interval. Joinpoint models with up to three joinpoints are based on rates per 100,000 population and are age standardized to the 2000 US standard population (19 age groups; US Bureau of the Census. Current Population Report P25‐1130. US Government Printing Office; 2000). Incidence rates were delay‐adjusted and covered 92% of the US population, and mortality covered the entire United States. Registries included in the joinpoint models (2001–2018) for all races/ethnicities (46 states): Alabama, Alaska, Arizona, Arkansas, California, Colorado, Connecticut, Delaware, Florida, Georgia, Hawaii, Idaho, Illinois, Indiana, Iowa, Kansas, Kentucky, Louisiana, Maine, Maryland, Massachusetts, Michigan, Minnesota, Missouri, Montana, Nebraska, New Hampshire, New Jersey, New Mexico, New York, North Carolina, North Dakota, Ohio, Oklahoma, Oregon, Pennsylvania, Rhode Island, South Carolina, South Dakota, Texas, Utah, Vermont, Washington, West Virginia, Wisconsin, and Wyoming. Scattered points were observed rates; lines were fitted rates according to joinpoint regression. An asterisk (*) indicates that the APC or AAPC is statistically significantly different from zero (p < .05); 95% confidence limits are given in parentheses
By racial/ethnic group, cancer incidence rates for all sites combined in the most recent 5 years (2014–2018) were stable among White males, AI/AN males, and Black females; but decreased among Black, API, and Hispanic males; and increased among White, API, AI/AN, and Hispanic females (Table 1). The overall cancer incidence rate was highest among AI/AN persons, closely followed by White and Black persons, and it was lowest among API and Hispanic persons (Figure 2). The overall cancer incidence rate was higher among males than among females in every racial/ethnic group except API persons, in whom the rates were similar. Overall male incidence rates were highest among Black males, and overall female rates were highest among AI/AN females.
FIGURE 2.
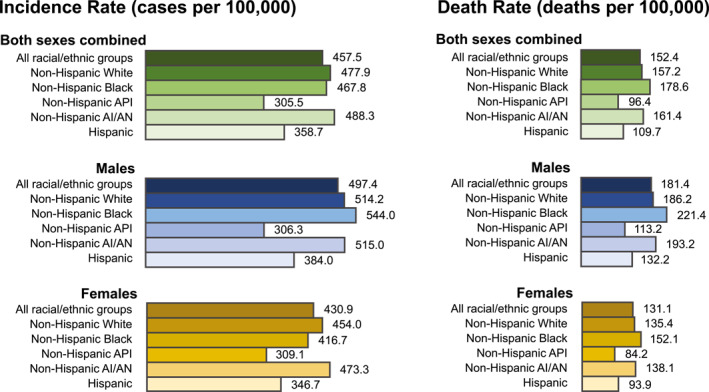
Age‐standardized, delay‐adjusted overall cancer incidence rates (2014–2018) and age‐standardized overall cancer death rates (2015–2019) are illustrated for all cancer sites combined, all ages, by sex and racial/ethnic group. Racial/ethnic groups are mutually exclusive. Data for non‐Hispanic AI/AN individuals are restricted to counties with Indian Health Service Purchased/Referred Care Delivery Areas. AI/AN indicates American Indian/Alaska Native; API, Asian/Pacific Islander
During 2014–2018, incidence rates among males increased for three of the 18 most common cancers (pancreas, kidney and renal pelvis [kidney], and testis), were stable for seven cancers (liver and intrahepatic bile duct [liver], myeloma, prostate, esophagus, leukemia, oral cavity and pharynx, and melanoma of the skin [melanoma]), and decreased for eight cancers (lung and bronchus [lung], larynx, urinary bladder [bladder], stomach, colon and rectum [colorectum], brain and other nervous systems [ONS], non‐Hodgkin lymphoma [NHL], and thyroid; Table 1, Figure 3A). The steepest increasing trend was for pancreatic cancer (AAPC, 1.1%), and the steepest decreasing trend was for lung cancer (AAPC, −2.6%). Prostate cancer incidence trends were stable in all racial/ethnic groups except API males, in whom rates increased. Lung cancer incidence rates among males decreased in all racial/ethnic groups, with the greatest declines among AI/AN and Black males. Colorectal cancer incidence rates among males declined in all racial/ethnic groups except AI/AN males, among whom rates were stable. Incidence rates for the fourth most common cancer in males (bladder) declined in White, Black, API, and Hispanic males and increased among AI/AN males (Table 1).
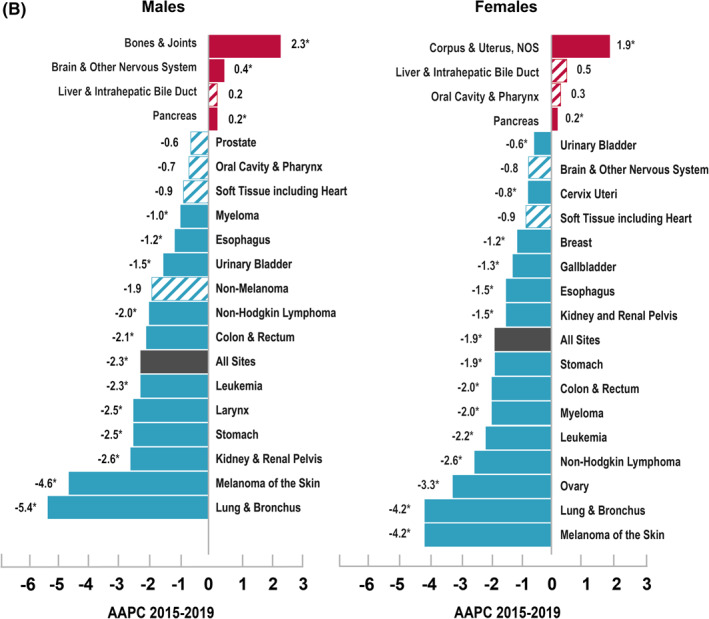
FIGURE 3.
Average annual percent changes (AAPCs) in (A) age‐standardized, delay‐adjusted incidence rates for 2014–2018 are illustrated for all sites and for the 18 most common cancers in men and women; and (B) the age‐standardized death rates for 2015–2019 are illustrated for all sites and for the 19 most common cancer deaths in men and for the 20 most common cancer deaths in women, all ages, all racial/ethnic groups combined, by sex. The AAPC was a weighted average of the annual percent changes (APCs) over the fixed 5‐year interval (incidence, 2014–2018; mortality, 2015–2019) using the underlying joinpoint regression model, which allowed up to three different APCs, for the 17‐year period 2001–2018 for incidence and the 18‐year period 2001–2019 for mortality. AAPCs with an asterisk (*) were statistically significantly different from zero (p < .05) and are depicted as solid‐colored bars; AAPCs with hash marks were not statistically significantly different from zero (stable). NOS indicates not otherwise specified
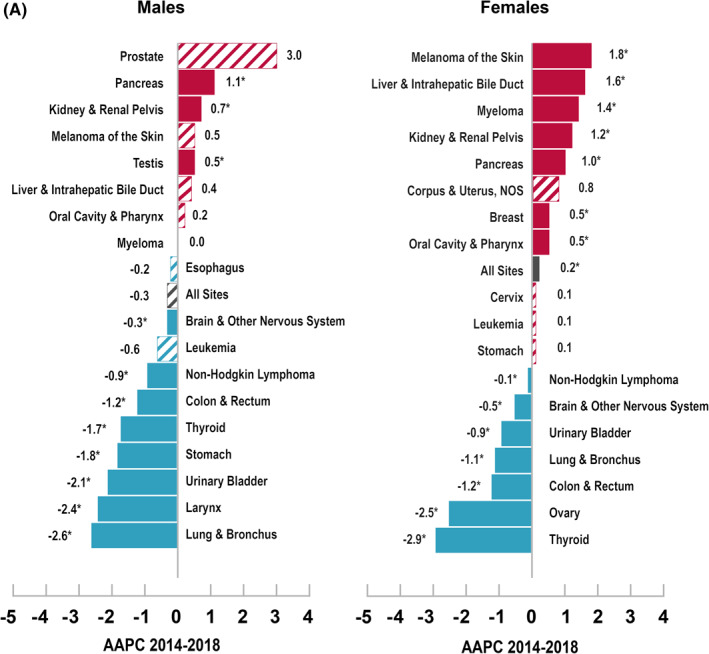
Among females, incidence rates increased during 2014–2018 for seven of the 18 most common cancers (liver, melanoma, kidney, myeloma, pancreas, breast, and oral cavity and pharynx), were stable for four cancers (cervix; leukemia; stomach; and corpus and uterus, not otherwise specified [uterus]), and decreased for seven cancers (thyroid, ovary, lung, colorectum, bladder, NHL, and brain and ONS; Table 1, Figure 3A). The steepest increasing trend was for melanoma (AAPC, 1.8%), and the steepest decreasing trend was for thyroid cancer (AAPC, −2.9%). Breast cancer incidence rates increased among White, API, and Hispanic females and were stable among Black and AI/AN females. Lung cancer incidence rates decreased among White, Black, and Hispanic females, with the greatest declines seen in Black females, and were stable among API and AI/AN females. Colorectal cancer incidence rates decreased in White, Black, and API females and remained stable among AI/AN and Hispanic females. Declines in colorectal cancer incidence rates were greatest among API females. Incidence rates for the fourth most common cancer among females (uterus) increased in every racial/ethnic group by an average of >2% per year except in White females, among whom rates were stable (Table 1).
Cancer death rates and trends
The overall cancer death rate (per 100,000 population) during 2015–2019 was 152.4, with a higher rate in males (181.4 per 100,000) than in females (131.1 per 100,000; Table 3).14 Trends in cancer death rates during 2001–2019 show that average declines accelerated from 1.8% per year during 2001–2015 to 2.3% per year during 2015–2019 among males and from 1.4% per year during 2001–2016 to 2.1% per year during 2016–2019 among females (Table 4, Figure 1).14 During the most recent 5 years (2015–2019), cancer death rates decreased on average in both sexes combined (AAPC, −2.1%) and among males (AAPC, −2.3%) and females (AAPC, −1.9%; Table 3, Figure 1).
TABLE 3.
Age‐standardized death rates a and fixed‐interval trends (2015–2019) b for the most common causes of cancer death, c by sex and racial/ethnic group, d United States e
| Sex/cancer site or type | All racial/ethnic groups | Non‐Hispanic White | Non‐Hispanic Black | Non‐Hispanic API | Non‐Hispanic AI/AN, PRCDA | Hispanic | |||||||||||||
|---|---|---|---|---|---|---|---|---|---|---|---|---|---|---|---|---|---|---|---|
| Rank | Rate (95% CI) | AAPC (95% CI) | p | Rate (95% CI) | AAPC (95% CI) | p | Rate (95% CI) | AAPC (95% CI) | p | Rate (95% CI) | AAPC (95% CI) | p | Rate (95% CI) | AAPC (95% CI) | p | Rate (95% CI) | AAPC (95% CI) | p | |
| All sites | |||||||||||||||||||
| Both sexes | 152.4 (152.3–152.6) | −2.1 (−2.3, −1.8) f | < .001 | 157.2 (157.0–157.4) | −2.0 (−2.2, −1.7) f | < .001 | 178.6 (178.0–179.2) | −2.0 (−2.1, −2.0) f | < .001 | 96.4 (95.8–97.0) | −2.2 (−3.0, −1.5) f | < .001 | 161.4 (158.4–164.5) | −2.4 (−4.3, −0.4) f | .02 | 109.7 (109.2–110.2) | −1.2 (−1.3, −1.2) f | < .001 | |
| Males | 181.4 (181.1–181.7) | −2.3 (−2.6, −2.0) f | < .001 | 186.2 (185.8–186.5) | −2.1 (−2.4, −1.9) f | < .001 | 221.4 (220.3–222.5) | −2.6 (−2.7, −2.6) f | < .001 | 113.2 (112.1–114.3) | −2.7 (−3.7, −1.7) f | < .001 | 193.2 (188.1–198.5) | −3.2 (−6.2, −0.1) f | .04 | 132.2 (131.3–133.0) | −1.6 (−1.7, −1.5) f | < .001 | |
| Females | 131.1 (130.9–131.3) | −1.9 (−2.2, −1.6) f | < .001 | 135.4 (135.1–135.7) | −1.8 (−2.1, −1.6) f | < .001 | 152.1 (151.4–152.8) | −1.6 (−1.6, −1.5) f | < .001 | 84.2 (83.4–85.0) | −1.1 (−1.2, −0.9) f | < .001 | 138.1 (134.4–141.9) | −0.9 (−1.2, −0.7) f | < .001 | 93.9 (93.3–94.5) | −0.9 (−1.0, −0.8) f | < .001 | |
| Children, ages 0−14 years | 2.0 (2.0–2.1) | −1.5 (−1.8, −1.2) f | < .001 | 2.0 (1.9–2.1) | −1.5 (−1.9, −1.2) f | < .001 | 2.1 (2.0–2.3) | −1.1 (−1.6, −0.6) f | < .001 | 1.9 (1.7–2.1) | −1.5 (−2.8, −0.1) f | .03 | 2.6 (2.0–3.4) | — g | 2.0 (1.9–2.1) | −1.7 (−2.1, −1.2) f | < .001 | ||
| AYAs, ages 15−39 years | 8.8 (8.7–8.9) | −0.9 (−1.1, −0.8) f | < .001 | 8.7 (8.6–8.8) | −1.2 (−1.4, −1.0) f | < .001 | 11.2 (11.0–11.5) | −1.1 (−1.4, −0.8) f | < .001 | 6.7 (6.5–7.0) | −0.9 (−1.3, −0.5) f | < .001 | 10.7 (9.6–12.0) | −0.8 (−2.1, 0.5) | .22 | 8.2 (8.1–8.4) | 1.1 (0.7–1.5) f | < .001 | |
| Males | |||||||||||||||||||
| Lung and bronchus | 1 | 44.5 (44.4–44.7) | −5.4 (−5.8, −5.0) f | < .001 | 47.0 (46.9–47.2) | −5.0 (−5.2, −4.8) f | < .001 | 54.0 (53.4–54.5) | −5.6 (−6.0, −5.2) f | < .001 | 26.9 (26.4–27.5) | −6.1 (−7.9, −4.2) f | < .001 | 42.3 (39.9–44.8) | −4.9 (−7.2, −2.5) f | .001 | 22.1 (21.7–22.4) | −4.9 (−5.9, −3.8) f | < .001 |
| Prostate | 2 | 18.9 (18.8–19.0) | −0.6 (−1.2, 0.1) | .09 | 17.8 (17.7–17.9) | −0.3 (−0.9, 0.4) | .39 | 37.9 (37.4–38.4) | −1.5 (−3.1, 0.2) | .08 | 8.6 (8.3–9.0) | −2.0 (2.5, −1.5) f | < .001 | 21.0 (19.2–23.0) | −1.1 (−2.0, −0.2) f | .02 | 15.6 (15.3–15.9) | −1.1 (−1.9, −0.3) f | .01 |
| Colon and rectum | 3 | 16.0 (15.9–16.1) | −2.1 (−2.3, −1.9) f | < .001 | 15.8 (15.7–15.9) | −1.8 (−2.1, −1.4) f | < .001 | 22.7 (22.4–23.1) | −2.6 (−2.8, −2.5) f | < .001 | 11.1 (10.8–11.4) | −2.0 (−2.3, −1.7) f | < .001 | 21.3 (19.6–23.0) | −0.3 (−1.4, 0.7) | .50 | 13.7 (13.5–14.0) | −1.6 (−1.8, −1.4) f | < .001 |
| Pancreas | 4 | 12.7 (12.7–12.8) | 0.2 (0.2–0.3) f | < .001 | 13.0 (13.0–13.1) | 0.4 (0.3–0.5) f | < .001 | 15.4 (15.1–15.7) | −0.1 (−0.3, 0.0) | .11 | 8.3 (8.0–8.6) | 0.0 (−0.3, 0.3) | .99 | 11.6 (10.4–12.9) | −0.1 (−1.4, 1.1) | .82 | 9.6 (9.4–9.8) | 0.1 (−0.2, 0.5) | .45 |
| Liver and intrahepatic bile duct | 5 | 9.7 (9.6–9.7) | 0.2 (−0.4, 0.8) | .46 | 8.5 (8.4–8.5) | 0.4 (−0.1, 0.9) | .08 | 13.3 (13.0–13.5) | −1.2 (−2.1, −0.4) f | .008 | 12.9 (12.5–13.2) | −2.8 (−3.4, −2.2) f | < .001 | 17.1 (15.7–18.6) | 2.5 (1.6–3.5) f | < .001 | 13.2 (13.0–13.5) | −0.2 (−1.2, 0.7) | .65 |
| Leukemia | 6 | 8.2 (8.1–8.2) | −2.3 (−2.6, −2.0) f | < .001 | 8.7 (8.6–8.8) | −2.1 (−2.5, −1.7) f | < .001 | 6.8 (6.6–7.0) | −1.9 (−2.2, −1.5) f | < .001 | 4.7 (4.5–4.9) | −0.7 (−1.4, −0.1) f | .04 | 6.1 (5.3–7.1) | −0.5 (−2.1, 1.2) | .54 | 5.4 (5.3–5.6) | −1.2 (−1.7, −0.7) f | < .001 |
| Urinary bladder | 7 | 7.3 (7.2–7.3) | −1.5 (−2.0, −1.0) f | < .001 | 8.1 (8.0–8.1) | −2.1 (−3.1, −1.0) f | < .001 | 5.3 (5.1–5.5) | −0.4 (−0.8, 0.1) | .09 | 2.8 (2.7–3.0) | −0.3 (−1.0, 0.4) | .35 | 4.5 (3.7–5.4) | — g | 3.9 (3.8–4.1) | −0.5 (−1.0, 0.0) | .07 | |
| Non‐Hodgkin lymphoma | 8 | 6.9 (6.8–6.9) | −2.0 (−2.1, −1.8) f | < .001 | 7.2 (7.2–7.3) | −2.0 (−2.1, −1.8) f | < .001 | 5.2 (5.0–5.4) | −1.7 (−2.2, −1.3) f | < .001 | 4.8 (4.6–5.0) | −1.2 (−1.7, −0.8) f | < .001 | 6.4 (5.5–7.4) | 0.1 (−1.4, 1.5) | .94 | 5.7 (5.5–5.9) | −1.4 (−1.7, −1.0) f | < .001 |
| Esophagus | 9 | 6.8 (6.8–6.9) | −1.2 (−1.4, −1.0) f | < .001 | 7.7 (7.7–7.8) | −0.6 (−0.7, −0.4) f | < .001 | 5.0 (4.8–5.1) | −4.8 (−5.1, −4.5) f | < .001 | 2.7 (2.5–2.8) | −1.4 (−2.1, −0.7) f | .001 | 6.7 (5.8–7.6) | −1.0 (−2.4, 0.5) | .19 | 3.6 (3.5–3.8) | −1.3 (−1.9, −0.8) f | < .001 |
| Brain and other nervous system | 10 | 5.4 (5.3–5.4) | 0.4 (0.1–0.6) f | .007 | 6.2 (6.1–6.2) | 0.6 (0.3–0.8) f | < .001 | 3.3 (3.2–3.4) | 0.4 (−0.1, 1.0) | .13 | 2.7 (2.6–2.9) | 0.6 (−0.3, 1.6) | .19 | 3.5 (2.9–4.2) | 0.8 (−1.1, 2.7) | .40 | 3.6 (3.4–3.7) | 0.4 (0.0–0.9) | .06 |
| Kidney and renal pelvis | 11 | 5.2 (5.2–5.3) | −2.6 (−3.4, −1.7) f | < .001 | 5.4 (5.3–5.5) | −2.3 (−3.5, −1.1) f | .001 | 5.3 (5.1–5.4) | −1.1 (−1.5, −0.8) f | < .001 | 2.4 (2.3–2.6) | −2.9 (−4.5, −1.2) f | .002 | 9.4 (8.3–10.7) | −0.6 (−1.8, 0.7) | .33 | 4.9 (4.7–5.0) | −0.9 (−1.4, −0.5) f | .001 |
| Myeloma | 12 | 4.0 (4.0–4.0) | −1.0 (−1.1, −0.8) f | < .001 | 3.8 (3.8–3.9) | −0.9 (−1.1, −0.7) f | < .001 | 7.4 (7.2–7.7) | −0.9 (−1.2, −0.7) f | < .001 | 1.9 (1.8–2.1) | −2.5 (−3.9, −1.0) f | .003 | 4.3 (3.6–5.2) | −0.5 (−2.3, 1.4) | .60 | 3.3 (3.1–3.4) | −0.7 (−1.3, −0.1) f | .04 |
| Oral cavity and pharynx | 13 | 3.9 (3.9–4.0) | −0.7 (−2.3, 0.9) | .39 | 4.1 (4.0–4.1) | 0.9 (0.6–1.3) f | < .001 | 4.4 (4.2–4.5) | −2.8 (−3.3, −2.3) f | < .001 | 3.2 (3.0–3.4) | 0.8 (−0.2, 1.8) | .10 | 3.8 (3.2–4.5) | −0.7 (−2.7, 1.3) | .45 | 2.4 (2.3–2.5) | −0.8 (−1.3, −0.4) f | .002 |
| Stomach | 14 | 3.9 (3.8–3.9) | −2.5 (−2.7, −2.3) f | < .001 | 3.0 (2.9–3.0) | −2.8 (−3.1, −2.5) f | < .001 | 7.5 (7.3–7.7) | −3.2 (−3.4, −2.9) f | < .001 | 6.2 (5.9–6.4) | −3.7 (−4.2, −3.3) f | < .001 | 7.2 (6.3–8.3) | −2.6 (−4.1, −1.0) f | .003 | 6.1 (5.9–6.3) | −2.7 (−3.0, −2.3) f | < .001 |
| Melanoma of the skin | 15 | 3.2 (3.1–3.2) | −4.6 (−7.3, −1.7) f | .002 | 4.0 (4.0–4.1) | −4.3 (−7.2, −1.3) f | .005 | 0.4 (0.3–0.4) | −1.6 (−3.1, −0.1) f | .04 | 0.3 (0.3–0.4) | — g | 1.0 (0.7–1.5) | — g | 0.9 (0.8–0.9) | −2.2 (−3.6, −0.9) f | .003 | ||
| Nonmelanoma skin | 16 | 1.7 (1.7–1.8) | −1.9 (−4.2, 0.5) | .10 | 2.0 (2.0–2.0) | −1.7 (−3.7, 0.3) | .09 | 0.7 (0.6–0.7) | −2.2 (−3.1, −1.3) f | < .001 | 0.4 (0.3–0.5) | — g | 1.2 (0.8–1.6) | — g | 0.7 (0.7–0.8) | 0.3 (−0.9, 1.4) | .64 | ||
| Larynx | 17 | 1.6 (1.6–1.7) | −2.5 (−2.6, −2.3) f | < .001 | 1.6 (1.6–1.6) | −2.1(−2.2, −1.9) f | < .001 | 2.9 (2.8–3.0) | −3.7 (−4.0, −3.3) f | < .001 | 0.6 (0.5–0.6) | −3.3 (−4.9, −1.7) f | .001 | 1.8 (1.3–2.3) | — g | 1.3 (1.2–1.4) | −4.2 (−5.6, −2.8) f | < .001 | |
| Soft tissue, including heart | 18 | 1.5 (1.5–1.6) | −0.9 (−2.3, 0.4) | .16 | 1.6 (1.5–1.6) | −1.1 (−2.9, 0.6) | .18 | 1.6 (1.5–1.7) | 0.5 (−0.2, 1.2) | .19 | 1.0 (0.9–1.1) | 0.6 (−0.9, 2.0) | .43 | 1.3 (0.9–1.7) | — g | 1.2 (1.2–1.3) | 1.0 (0.3–1.8) f | .01 | |
| Bones and joints | 19 | 0.6 (0.6–0.6) | 2.3 (0.7–3.9) f | .007 | 0.6 (0.6–0.6) | 0.6 (0.1–1.0) f | .01 | 0.6 (0.6–0.7) | 0.5 (−0.3, 1.3) | .22 | 0.4 (0.3–0.5) | 3.8 (1.8–5.9) f | .001 | 0.6 (0.4–0.9) | — g | 0.5 (0.4–0.5) | 0.3 (−0.8, 1.5) | .57 | |
| Females | |||||||||||||||||||
| Lung and bronchus | 1 | 30.7 (30.6–30.8) | −4.2 (−4.6, −3.9) f | < .001 | 34.2 (34.1–34.3) | −3.9 (−4.3, −3.6) f | < .001 | 29.2 (28.8–29.5) | −4.4 (−5.0, −3.9) f | < .001 | 15.9 (15.6–16.3) | −3.3 (−4.5, −2.1) f | < .001 | 31.0 (29.3–32.8) | −2.2 (2.8, −1.5) f | <.001 | 11.8 (11.6–12.0) | −4.7 (−6.5, −2.9) f | < .001 |
| Breast | 2 | 19.9 (19.8–20.0) | −1.2 (−1.3, −1.0) f | < .001 | 19.9 (19.8–20.0) | −1.1 (−1.3, −0.9) f | < .001 | 28.0 (27.7–28.3) | −1.4 (−1.5, −1.3) f | < .001 | 11.7 (11.4–12.0) | 0.5 (−0.3, 1.3) | .24 | 17.8 (16.5–19.2) | 3.4 (0.0–6.9) f | .05 | 13.7 (13.5–14.0) | −1.0 (−1.2, −0.8) f | < .001 |
| Colon and rectum | 3 | 11.3 (11.2–11.4) | −2.0 (−2.3, −1.7) f | < .001 | 11.3 (11.2–11.4) | −1.7 (−2.1, −1.4) f | < .001 | 14.8 (14.6–15.1) | −3.1 (−3.3, −3.0) f | < .001 | 7.9 (7.7–8.2) | −2.1 (−2.5, −1.7) f | < .001 | 14.4 (13.2–15.6) | −0.9 (−1.9, 0.2) | .10 | 8.5 (8.3–8.7) | −2.0 (−2.2, −1.8) f | < .001 |
| Pancreas | 4 | 9.6 (9.6–9.7) | 0.2 (0.1–0.3) f | < .001 | 9.6 (9.6–9.7) | 0.1 (0.0–0.3) | .07 | 12.4 (12.1–12.6) | −0.2 (−0.4, −0.1) f | .01 | 7.0 (6.8, 7.3) | −1.2 (−2.2, −0.1) f | .03 | 8.7 (7.8, 9.7) | 0.0 (−1.3, 1.4) | .94 | 7.9 (7.8–8.1) | 0.2 (0.0–0.4) | .11 |
| Ovary | 5 | 6.5 (6.4–6.5) | −3.3 (−4.6, −2.0) f | < .001 | 6.9 (6.8–6.9) | −3.5 (−5.1, −1.8) f | < .001 | 5.9 (5.7–6.0) | −1.7 (−2.0, −1.4) f | < .001 | 4.4 (4.2–4.6) | −0.9 (−1.3, −0.5) f | < .001 | 6.6 (5.8–7.5) | −1.8 (−3.0, −0.5) f | .008 | 5.0 (4.8–5.1) | −1.5 (−1.8, −1.2) f | < .001 |
| Corpus and uterus, NOS | 6 | 5.0 (4.9–5.0) | 1.9 (1.6–2.2) f | < .001 | 4.6 (4.5–4.6) | 1.6 (1.2–2.0) f | < .001 | 9.0 (8.8–9.2) | 1.3 (0.6–2.0) f | .001 | 3.4 (3.3–3.6) | 2.6 (2.0–3.2) f | < .001 | 4.4 (3.7–5.1) | — g | 4.2 (4.1–4.3) | 2.4 (1.9–3.0) f | < .001 | |
| Leukemia | 7 | 4.6 (4.5–4.6) | −2.2 (−2.9, −1.5) f | < .001 | 4.8 (4.7–4.8) | −2.2 (−2.8, −1.5) f | < .001 | 4.3 (4.2–4.5) | −1.5 (−1.7, −1.2) f | < .001 | 2.6 (2.5–2.7) | 1.0 (−3.6, 5.8) | .65 | 3.3 (2.7–3.9) | −1.8 (−3.6, 0.0) | .05 | 3.6 (3.4–3.7) | −0.9 (−1.3, −0.5) f | < .001 |
| Liver and intrahepatic bile duct | 8 | 4.1 (4.0–4.1) | 0.5 (−0.1, 1.0) | .09 | 3.6 (3.6–3.6) | 0.6 (−0.5, 1.7) | .24 | 4.8 (4.7–5.0) | −1.4 (−6.8, 4.2) | .61 | 5.3 (5.1–5.5) | −1.5 (−2.1, −0.9) f | < .001 | 8.3 (7.4–9.2) | 1.0 (−0.6, 2.6) | .21 | 6.0 (5.9–6.2) | 1.1 (0.8–1.4) f | < .001 |
| Non‐Hodgkin lymphoma | 9 | 4.0 (4.0–4.0) | −2.6 (−2.8, −2.5) f | < .001 | 4.2 (4.2–4.3) | −2.8 (−2.9, −2.7) f | < .001 | 3.1 (3.0–3.2) | −2.1 (−2.4, −1.8) f | < .001 | 2.8 (2.7–3.0) | −2.1 (−2.6, −1.6) f | < .001 | 3.7 (3.1–4.4) | −2.9 (−4.4, −1.3) f | .001 | 3.6 (3.4–3.7) | −2.1 (−2.5, −1.6) f | < .001 |
| Brain and other nervous system | 10 | 3.6 (3.5–3.6) | −0.8 (−2.6, 1.0) | .37 | 4.1 (4.0–4.1) | −0.9 (−2.6, 0.8) | .29 | 2.3 (2.2–2.4) | 0.6 (0.0–1.1) f | .04 | 1.9 (1.8–2.0) | 1.6 (0.7–2.6) f | .002 | 2.6 (2.1–3.1) | — g | 2.7 (2.6–2.8) | 0.8 (0.4–1.2) f | .001 | |
| Myeloma | 11 | 2.5 (2.5–2.5) | −2.0 (−2.6, −1.4) f | < .001 | 2.3 (2.2–2.3) | −1.9 (−2.5, −1.3) f | < .001 | 5.1 (5.0–5.2) | −3.1 (−4.8, −1.4) f | .002 | 1.3 (1.2–1.4) | −1.0 (−2.2, 0.1) | .08 | 2.8 (2.3–3.4) | −1.2 (−3.9, −1.5) | .36 | 2.2 (2.1–2.3) | −1.3 (−1.8, −0.8) f | < .001 |
| Kidney and renal pelvis | 12 | 2.2 (2.2–2.3) | −1.5 (−1.7, −1.3) f | < .001 | 2.3 (2.3–2.3) | −1.5 (−1.6, −1.3) f | < .001 | 2.2 (2.1–2.3) | −1.8 (−2.3, −1.4) f | < .001 | 1.0 (0.9–1.1) | −1.4 (−2.3, −0.5) f | .006 | 3.8 (3.2–4.4) | −1.7 (3.1, −0.2) f | .03 | 2.2 (2.1–2.3) | −0.7 (−1.2, −0.2) f | .005 |
| Cervix uteri | 13 | 2.2 (2.2–2.2) | −0.8 (−0.9, −0.6) f | < .001 | 2.0 (2.0–2.1) | −0.2 (−0.4, 0.1) | .12 | 3.4 (3.3–3.5) | −2.4 (−2.6, −2.1) f | < .001 | 1.7 (1.6–1.8) | −2.2 (−3.1, −1.4) f | < .001 | 3.1 (2.6–3.7) | −1.7 (−3.2, −0.2) f | .03 | 2.5 (2.4–2.6) | −1.8 (−2.1, −1.4) f | < .001 |
| Stomach | 14 | 2.1 (2.1–2.2) | −1.9 (−2.1, −1.6) f | < .001 | 1.5 (1.5–1.5) | −3.0 (−3.1, −2.8) f | < .001 | 3.5 (3.4–3.6) | −3.3 (−3.6, −3.1) f | < .001 | 3.9 (3.7–4.1) | −3.2 (−3.7, −2.8) f | < .001 | 3.9 (3.3–4.6) | −2.2 (−3.7, −0.7) f | .008 | 3.9 (3.8–4.0) | −1.1 (−1.7, −0.6) f | .001 |
| Urinary bladder | 15 | 2.1 (2.1–2.1) | −0.6 (−0.8, −0.5) f | < .001 | 2.2 (2.2–2.3) | −0.3 (−0.5, −0.2) f | .001 | 2.3 (2.2–2.4) | −1.6 (−2.0, −1.2) f | < .001 | 0.9 (0.8–1.0) | −0.8 (−1.7, 0.0) | .06 | 1.7 (1.3–2.2) | — g | 1.3 (1.2–1.4) | −0.6 (−1.3, 0.0) | .07 | |
| Esophagus | 16 | 1.4 (1.4–1.4) | −1.5 (−1.7, −1.4) f | < .001 | 1.5 (1.5–1.5) | −0.8 (−1.0, −0.7) f | < .001 | 1.6 (1.5–1.6) | −4.1 (−4.5, −3.6) f | < .001 | 0.7 (0.6–0.7) | −1.9 (−3.2, −0.6) f | .006 | 1.7 (1.3–2.2) | — g | 0.7 (0.6–0.7) | −2.2 (−2.9, −1.6) f | < .001 | |
| Melanoma of the skin | 17 | 1.4 (1.3–1.4) | −4.2 (−5.4, −2.9) f | < .001 | 1.8 (1.7–1.8) | −3.7 (−5.1, −2.3) f | < .001 | 0.3 (0.2–0.3) | −2.6 (−3.9, −1.3) f | .001 | 0.3 (0.2–0.3) | −0.8 (−3.1, 1.5) | .45 | 0.6 (0.4–0.9) | — g | 0.5 (0.4–0.5) | −1.7 (−2.7, −0.7) f | .002 | |
| Oral cavity and pharynx | 18 | 1.4 (1.3–1.4) | 0.3 (−0.6, 1.3) | .46 | 1.5 (1.4–1.5) | 1.5 (0.3–2.8) f | .02 | 1.3 (1.2–1.3) | −2.2 (−2.7, −1.6) f | < .001 | 1.2 (1.1–1.2) | −1.4 (−2.4, −0.3) f | .02 | 1.3 (0.9–1.7) | — g | 0.8 (0.8–0.9) | −0.2 (−1.1, 0.7) | .63 | |
| Soft tissue, including heart | 19 | 1.2 (1.1–1.2) | −0.9 (−2.4, 0.6) | .23 | 1.1 (1.1–1.2) | 0.0 (−0.2, 0.2) | .92 | 1.5 (1.4–1.6) | −2.3 (−5.3, 0.8) | .15 | 0.8 (0.7–0.8) | 0.5 (−0.8, 1.8) | .42 | 1.0 (0.7–1.3) | — g | 1.0 (0.9–1.0) | 0.8 (−0.1, 1.6) | .06 | |
| Gallbladder | 20 | 0.7 (0.7–0.7) | −1.3 (−1.6, −1.0) f | < .001 | 0.6 (0.5–0.6) | −1.9 (−2.2, −1.6) f | < .001 | 1.0 (0.9–1.0) | −0.1 (−0.7, 0.6) | .79 | 0.7 (0.6–0.8) | −1.1 (−2.2, −0.1) f | .04 | 1.5 (1.1–1.9) | — g | 1.1 (1.0–1.1) | −1.7 (−2.4, −0.9) f | < .001 | |
| Children | |||||||||||||||||||
| Brain and other nervous system | 0.7 (0.7–0.7) | −0.4 (−0.8, 0.0) f | .03 | 0.7 (0.7–0.7) | −0.6 (−1.1, 0.0) f | .04 | 0.7 (0.7–0.8) | 0.4 (−0.7, 1.5) | .47 | 0.6 (0.5–0.7) | −0.9 (−2.7, 0.9) | .31 | 1.0 (0.6, 1.5) | — g | 0.6 (0.6–0.7) | −0.2 (−0.9, 0.5) | .51 | ||
| Leukemia | 0.5 (0.5–0.6) | −2.9 (−3.4, −2.3) f | < .001 | 0.5 (0.4–0.5) | −3.2 (−3.8, −2.6) f | < .001 | 0.5 (0.4–0.5) | −2.5 (−3.5, −1.5) f | < .001 | 0.5 (0.4–0.6) | −3.3 (−4.9, −1.7) f | < .001 | — h | — g | 0.7 (0.6–0.7) | −3.1 (−4.0, −2.3) f | < .001 | ||
| AYAs | |||||||||||||||||||
| Female breast | 2.2 (2.2–2.3) | 0.8 (−0.2, 1.7) | .11 | 2.1 (2.0–2.1) | 0.7 (−0.6, 2.1) | .28 | 4.1 (3.8–4.3) | 2.7 (−1.4, 6.9) | .20 | 1.3 (1.1–1.5) | −0.6 (−2.2, 1.0) | .42 | 1.9 (1.3–2.8) | — g | 1.9 (1.8–2.0) | 3.2 (0.8–5.6) f | .01 | ||
| Brain and other nervous system | 1.0 (0.9–1.0) | −0.1 (−0.5, 0.3) | .53 | 1.2 (1.2–1.2) f | 0.0 (−0.5, 0.4) | .85 | 0.7 (0.6–0.8) | 1.1 (0.0–2.2) | .06 | 0.6 (0.5–0.7) | 0.8 (−0.8, 2.5) | .30 | 0.8 (0.5–1.2) | — g | 0.7 (0.6–0.7) | 0.8 (0.0–1.6) f | .04 | ||
| Leukemia | 0.9 (0.9–0.9) | −2.2 (−2.6, −1.9) f | < .001 | 0.8 (0.7–0.8) | −2.9 (−3.4, −2.5) f | < .001 | 1.0 (0.9–1.0) | −2.2 (−2.9, −1.5) f | < .001 | 0.7 (0.6–0.8) | −1.7 (−3.0, −0.4) f | .01 | 1.0 (0.7–1.4) | — g | 1.2 (1.2–1.3) | −1.2 (−1.7, −0.6)f | < .001 | ||
| Colon and rectum | 0.9 (0.9–0.9) | 0.8 (0.4–1.2) f | < .001 | 0.9 (0.9–0.9) | −0.9 (−2.9, 1.2) | .38 | 1.2 (1.1–1.3) | 0.2 (−0.5, 1.0) | .52 | 0.7 (0.6–0.8) | −0.2 (−1.7, 1.3) | .80 | 1.5 (1.0–2.0) | — g | 0.7 (0.7–0.8) | 5.9 (0.8–11.3) f | .03 | ||
Abbreviations: AAPC, average annual percent change; AI/AN, American Indian/Alaska Native; APC, annual percent change; API, Asian/Pacific Islander; AYAs, adolescents and young adults; NOS, not otherwise specified; PRCDA, Indian Health Services Purchased/Referred Care Delivery Area.
Rates are per 100,000 persons and are age standardized to the 2000 US standard population (19 age groups [ages <1 year, 1–4 years, 5–9 years… 80–84 years, and 85 years]; US Bureau of the Census. Current Population Report P25‐1130. US Government Printing Office; 2000).
The AAPC is a weighted average of the APCs over the fixed interval 2015–2019 using the underlying joinpoint model for the period of 2001–2019. Joinpoint models with up to three joinpoints are based on rates per 100,000 persons (National Cancer Institute Joinpoint Regression Program, version 4.9.0.0. Statistical Research and Applications Branch, National Cancer Institute; 202114) and are age standardized to the 2000 US standard population (19 age groups; Current Population Report P25–1130).
Cancers are sorted in descending order according to sex‐specific rates for all racial/ethnic groups. More than 15 cancers may appear under males and females to include the top 15 cancers in every racial/ethnic group.
White, Black, API, and AI/AN (PRCDA 2017 counties) include non‐Hispanic; the racial/ethnic categories are mutually exclusive.
Source: National Center for Health Statistics public‐use data file for the total United States.
The AAPC is statistically significantly different from zero (two‐sided p < .05).
The statistic could not be calculated. The AAPC is based on <10 cases for at least 1 year within the time interval.
The statistic could not be calculated. The age‐adjusted rate was based on <20 cases for the 5‐year time period.
TABLE 4.
Joinpoint trends a for the most common causes of cancer death, b all racial/ethnic groups combined by sex and age group, United States, c 2001–2019
| Joinpoint analyses: 2001–2019 | ||||||||||||||
|---|---|---|---|---|---|---|---|---|---|---|---|---|---|---|
| Trend 1 | Trend 2 | Trend 3 | Trend 4 | Fixed interval 2015–2019 | ||||||||||
| Sex/cancer site or type | Years | APC (95% CI) | p | Years | APC (95% CI) | p | Years | APC (95% CI) | p | Years | APC (95% CI) | p | AAPC (95% CI) d | P |
| All sites | ||||||||||||||
| Both sexes | 2001–2016 | −1.5 (−1.5, −1.5) e | < .001 | 2016–2019 | −2.3 (−2.6, −1.9) e | < .001 | −2.1 (−2.3, −1.8) e | < .001 | ||||||
| Males | 2001–2015 | −1.8 (−1.8, −1.7) e | < .001 | 2015–2019 | −2.3 (−2.6, −2.0) e | < .001 | −2.3 (−2.6, −2.0) e | < .001 | ||||||
| Females | 2001–2016 | −1.4 (−1.4, −1.3) e | < .001 | 2016–2019 | −2.1 (−2.5, −1.7) e | < .001 | −1.9 (−2.2, −1.6) e | < .001 | ||||||
| Children, ages 0–14 years | 2001–2019 | −1.5 (−1.8, −1.2) e | < .001 | −1.5 (−1.8, −1.2) e | < .001 | |||||||||
| AYA, ages 15–39 years | 2001–2005 | −3.0 (−4.0, −2.0) e | < .001 | 2005–2019 | −0.9 (−1.1, −0.8) e | < .001 | −0.9 (−1.1, −0.8) e | < .001 | ||||||
| Males | ||||||||||||||
| Lung and bronchus | 2001–2005 | −2.0 (−2.4, −1.6) e | < .001 | 2005–2012 | −2.9 (−3.1, −2.7) e | < .001 | 2012–2015 | −4.1 (−5.2, −2.9) e | < .001 | 2015–2019 | −5.4 (−5.8, −5.0) e | < .001 | −5.4 (−5.8, −5.0) e | < .001 |
| Prostate | 2001–2013 | −3.4 (−3.7, −3.2) e | < .001 | 2013–2019 | −0.6 (−1.2, 0.1) | .09 | −0.6 (−1.2, 0.1) | .09 | ||||||
| Colon and rectum | 2001–2009 | −3.1 (−3.4, −2.8) e | <.001 | 2009–2019 | −2.1 (−2.3, −1.9) e | < .001 | −2.1 (−2.3, −1.9) e | < .001 | ||||||
| Pancreas | 2001–2019 | 0.2 (0.2–0.3) e | < .001 | 0.2 (0.2–0.3) e | < .001 | |||||||||
| Liver and intrahepatic bile duct | 2001–2013 | 2.7 (2.5–3.0) e | < .001 | 2013–2019 | 0.2 (−0.4, 0.8) | .46 | 0.2 (−0.4, 0.8) | .46 | ||||||
| Leukemia | 2001–2012 | −0.9 (−1.1, −0.7) e | < .001 | 2012–2019 | −2.3 (−2.6, −2.0) e | < .001 | −2.3 (−2.6, −2.0) e | < .001 | ||||||
| Urinary bladder | 2001–2013 | 0.1 (−0.1, 0.3) | .38 | 2013–2019 | −1.5 (−2.0, −1.0) e | < .001 | −1.5 (−2.0, −1.0) e | < .001 | ||||||
| Non‐Hodgkin lymphoma | 2001–2006 | −3.0 (−3.7, −2.4) e | < .001 | 2006–2019 | −2.0 (−2.1, −1.8) e | < .001 | −2.0 (−2.1, −1.8) e | < .001 | ||||||
| Esophagus | 2001–2006 | 0.0 (−0.8, 0.9) | .94 | 2006–2019 | −1.2 (−1.4, −1.0) e | < .001 | −1.2 (−1.4, −1.0) e | < .001 | ||||||
| Brain and other nervous system | 2001–2006 | −1.2 (−2.3, −0.1) e | .04 | 2006–2019 | 0.4 (0.1–0.6) e | .007 | 0.4 (0.1–0.6) e | .007 | ||||||
| Kidney and renal pelvis | 2001–2015 | −0.8 (−0.9, −0.6) e | < .001 | 2015–2019 | −2.6 (−3.4, −1.7) e | < .001 | −2.6 (−3.4, −1.7) e | < .001 | ||||||
| Myeloma | 2001–2019 | −1.0 (−1.1, −0.8) e | < .001 | −1.0 (−1.1, −0.8) e | < .001 | |||||||||
| Oral cavity and pharynx | 2001–2009 | −1.4 (−2.0, −0.8) e | < .001 | 2009–2016 | 1.1 (0.2–2.0) e | .02 | 2016–2019 | −1.3 (−3.7, 1.1) | .26 | −0.7 (−2.3, 0.9) | .39 | |||
| Stomach | 2001–2006 | −3.7 (−4.5, −2.9) e | < .001 | 2006–2019 | −2.5 (−2.7, −2.3) e | < .001 | −2.5 (−2.7, −2.3) e | < .001 | ||||||
| Melanoma of the skin | 2001–2009 | 1.0 (0.5–1.6) e | .003 | 2009–2014 | −1.4 (−2.8, 0.0) | .06 | 2014–2017 | −7.5 (−11.8, −3.0) e | .005 | 2017–2019 | −1.5 (−6.3, 3.4) | .49 | −4.6 (−7.3, −1.7) e | .002 |
| Nonmelanoma skin | 2001–2010 | 0.7 (−0.2, 1.6) | .10 | 2010–2015 | 3.5 (0.8–6.2) e | .01 | 2015–2019 | −1.9 (−4.2, 0.5) | .10 | −1.9 (−4.2, 0.5) | .10 | |||
| Larynx | 2001–2019 | −2.5 (−2.6, −2.3) e | < .001 | −2.5 (−2.6, −2.3) e | < .001 | |||||||||
| Soft tissue, including heart | 2001–2014 | 0.8 (0.4–1.1) e | < .001 | 2014–2019 | −0.9 (−2.3, 0.4) | .16 | −0.9 (−2.3, 0.4) | .16 | ||||||
| Bones and joints | 2001–2013 | −0.1 (−0.7, 0.5) | .74 | 2013–2019 | 2.3 (0.7–3.9) e | .007 | 2.3 (0.7–3.9) e | .007 | ||||||
| Females | ||||||||||||||
| Lung and bronchus | 2001–2007 | −0.6 (−0.8, −0.3) e | .001 | 2007–2014 | −2.0 (−2.3, −1.7) e | < .001 | 2014–2019 | −4.2 (−4.6, −3.9) e | < .001 | −4.2 (−4.6, −3.9) e | < .001 | |||
| Breast | 2001–2003 | −1.6 (−2.4, −0.7) e | .003 | 2003–2007 | −2.3 (−2.7, −1.9) e | < .001 | 2007–2013 | −1.6 (−1.8, −1.4) e | < .001 | 2013–2019 | −1.2 (−1.3, −1.0) e | < .001 | −1.2 (−1.3, −1.0) e | < .001 |
| Colon and rectum | 2001–2010 | −3.0 (−3.3, −2.7) e | < .001 | 2010–2019 | −2.0 (−2.3, −1.7) e | < .001 | −2.0 (−2.3, −1.7) e | < .001 | ||||||
| Pancreas | 2001–2019 | 0.2 (0.1, 0.3) e | < .001 | 0.2 (0.1–0.3) e | < .001 | |||||||||
| Ovary | 2001–2005 | −1.1 (−2.0, −0.2) e | .02 | 2005–2017 | −2.3 (−2.5, −2.1) e | < .001 | 2017–2019 | −4.3 (−7.1, −1.3) e | .009 | −3.3 (−4.6, −2.0) e | < .001 | |||
| Corpus and uterus, NOS | 2001–2008 | 0.3 (−0.4, 0.9) | .40 | 2008–2019 | 1.9 (1.6–2.2) e | < .001 | 1.9 (1.6–2.2) e | < .001 | ||||||
| Leukemia | 2001–2013 | −1.2 (−1.4, −0.9) e | < .001 | 2013–2019 | −2.2 (−2.9, −1.5) e | < .001 | −2.2 (−2.9, −1.5) e | < .001 | ||||||
| Liver and intrahepatic bile duct | 2001–2004 | 2.7 (1.1–4.3) e | .005 | 2004–2008 | 0.7 (−0.8, 2.2) | .33 | 2008–2014 | 3.2 (2.6–3.8) e | < .001 | 2014–2019 | 0.5 (−0.1, 1.0) | .09 | 0.5 (−0.1, 1.0) | .09 |
| Non‐Hodgkin lymphoma | 2001–2005 | −3.6 (−4.5, −2.7) e | < .001 | 2005–2019 | −2.6 (−2.8, −2.5) e | < .001 | −2.6 (−2.8, −2.5) e | < .001 | ||||||
| Brain and other nervous system | 2001–2006 | −1.2 (−2.2, −0.2) e | .03 | 2006–2017 | 0.5 (0.2–0.8) e | .008 | 2017–2019 | −2.1 (−6.0, 2.0) | .27 | −0.8 (−2.6, 1.0) | .37 | |||
| Myeloma | 2001–2009 | −2.5 (−3.0, −2.0) e | < .001 | 2009–2012 | 1.8 (−2.7, 6.5) | .40 | 2012–2019 | −2.0 (−2.6, −1.4) e | < .001 | −2.0 (−2.6, −1.4) e | < .001 | |||
| Kidney and renal pelvis | 2001–2019 | −1.5 (−1.7, −1.3) e | < .001 | −1.5 (−1.7, −1.3) e | < .001 | |||||||||
| Cervix uteri | 2001–2003 | −4.0 (−8.1, 0.3) | .06 | 2003–2019 | −0.8 (−0.9, −0.6) e | < .001 | −0.8 (−0.9, −0.6) e | < .001 | ||||||
| Stomach | 2001–2008 | −3.0 (−3.5, −2.4) e | < .001 | 2008–2019 | −1.9 (−2.1, −1.6) e | < .001 | −1.9 (−2.1, −1.6) e | < .001 | ||||||
| Urinary bladder | 2001–2019 | −0.6 (−0.8, −0.5) e | < .001 | −0.6 (−0.8, −0.5) e | < .001 | |||||||||
| Esophagus | 2001–2019 | −1.5 (−1.7, −1.4) e | < .001 | −1.5 (−1.7, −1.4) e | < .001 | |||||||||
| Melanoma of the skin | 2001–2012 | −0.3 (−1.0, 0.3) | .29 | 2012–2019 | −4.2 (−5.4, −2.9) e | < .001 | −4.2 (−5.4, −2.9) e | < .001 | ||||||
| Oral cavity and pharynx | 2001–2011 | −1.6 (−2.3, −0.9) e | < .001 | 2011–2019 | 0.3 (−0.6, 1.3) | .46 | 0.3 (−0.6, 1.3) | .46 | ||||||
| Soft tissue, including heart | 2001–2017 | 0.2 (0.0–0.3) e | .01 | 2017–2019 | −2.0 (−5.2, 1.3) | .21 | −0.9 (−2.4, 0.6) | .23 | ||||||
| Gallbladder | 2001–2019 | −1.3 (−1.6, −1.0) e | < .001 | −1.3 (−1.6, −1.0) e | < .001 | |||||||||
| Children | ||||||||||||||
| Brain and other nervous system | 2001–2019 | −0.4 (−0.8, 0.0) e | .03 | −0.4 (−0.8, 0.0) e | .03 | |||||||||
| Leukemia | 2001–2019 | −2.9 (−3.4, −2.3) e | < .001 | −2.9 (−3.4, −2.3) e | < .001 | |||||||||
| AYAs | ||||||||||||||
| Female breast | 2001–2010 | −3.3 (−4.1, −2.4) e | < .001 | 2010–2019 | 0.8 (−0.2, 1.7) | .11 | 0.8 (−0.2, 1.7) | .11 | ||||||
| Brain and other nervous system | 2001–2019 | −0.1 (−0.5, 0.3) | .53 | −0.1 (−0.5, 0.3) | .53 | |||||||||
| Leukemia | 2001–2019 | −2.2 (−2.6, −1.9) e | < .001 | −2.2 (−2.6, −1.9) e | < .001 | |||||||||
| Colon and rectum | 2001–2019 | 0.8 (0.4–1.2) e | < .001 | 0.8 (0.4–1.2) e | < .001 | |||||||||
Abbreviations: AAPC, average annual percent change; APC, annual percent change; AYAs, adolescents and young adults; NOS, not otherwise specified.
Joinpoint models with up to three joinpoints are based on rates per 100,000 persons and are age standardized to the 2000 US standard population (19 age groups [US Bureau of the Census. Current Population Report P25‐1130. US Government Printing Office; 2000]; National Cancer Institute Joinpoint Regression Program, version 4.9.0.0. [Statistical Research and Applications Branch, National Cancer Institute; 202114]).
Cancers are listed in descending rank order of sex‐specific, age‐adjusted death rates for 2015–2019 for all racial/ethnic groups combined. More than 15 cancers may appear under men and women to include the top 15 cancers in each racial/ethnic group.
Source: National Center for Health Statistics public‐use data file for the total United States.
The AAPC is the average APC and is a weighted average of the APCs over the fixed interval 2015–2019 using the underlying joinpoint model for the period of 2001–2019.
The APC or AAPC is statistically significantly different from zero (two‐sided t‐test; p < .05).
The overall cancer death rate (per 100,000 population) was highest among Black persons (178.6 per 100,000), followed by AI/AN (161.4 per 100,000), White (157.2 per 100,000), Hispanic (109.7 per 100,000), and API (96.4 per 100,000) persons (Table 3, Figure 2). During 2015–2019, overall cancer death rates decreased in every racial/ethnic group; the average annual pace ranged from −1.2% among Hispanic persons to −2.4% among AI/AN persons (Table 3). During the same period, death rates among males increased for three of the 19 most common cancers (pancreas, brain and ONS, and bones and joints), with the steepest increase for cancers of the bones and joints (2.3% per year), were stable for five cancers (prostate; liver; oral cavity and pharynx; nonmelanoma skin; and soft tissue, including heart), and decreased for 11 cancers (Table 3, Figure 3B). Death rates among females increased for two of the 20 most common cancers (pancreas and uterus), were stable for four of 20 sites (liver; brain and ONS; oral cavity and pharynx; and soft tissue, including heart), and decreased for 14 cancers (Table 3, Figure 3B). The steepest declines in death rates (4%–5% per year) among both men and women were for lung cancer and melanoma.
Lung cancer was the leading cause of cancer death in every racial/ethnic group among males, with colorectal and prostate cancer rating second or third, except in API males, among whom liver cancer ranked second (Table 3). During 2015–2019, lung cancer death rates among males decreased in each racial/ethnic group. Prostate cancer death rates were stable among White and Black males but decreased among API, AI/AN, and Hispanic males. Colorectal cancer death rates were stable among AI/AN males but decreased in all other racial/ethnic groups. Pancreatic cancer was the fourth most common cancer death among White and Black males, and death rates increased among White males but were stable in other racial/ethnic groups. Liver cancer was the fourth most common cancer death among AI/AN and Hispanic males (and second among API males); death rates increased among AI/AN males, were stable among White and Hispanic males, and decreased among Black and API males.
Among females, the three most common cancer deaths were lung, breast, and colorectum in each racial/ethnic group, except among Hispanic females, in whom breast cancer was the most common and lung cancer was the second most common (Table 3). Cancer death rates for these three cancers among females decreased during 2015–2019 in every racial/ethnic group except for breast cancer death rates among API females (stable), colorectal cancer death rates among AI/AN females (stable), and breast cancer death rates among AI/AN females (increased). Pancreatic cancer was the fourth most common cancer death among females in each racial/ethnic group. Pancreatic cancer death rates decreased among Black and API females and were stable in other racial/ethnic groups. The largest increases in death rates among females during 2015–2019 were observed for uterine cancer (AAPC, 1.9%), with increasing rates among all racial groups (the AAPC for AI/AN females could not be calculated because of the small number of deaths).
Mortality trends changed in direction or slope during 2001–2019 for many cancers, notably melanoma and cancers of the lung, kidney (males only), colorectum, female breast, prostate, liver, oral cavity and pharynx, and ovary (Table 4). Many of the recent changes in death rates were favorable. Declines in lung cancer death rates accelerated: among males: average declines in death rates were 2% per year on average during 2001–2005, 2.9% during 2005–2012, 4.1% during 2012–2015, and 5.4% during 2015–2019. Similarly, lung cancer death rates for females declined 4.2% per year on average during 2015–2019. Death rates for kidney cancer, which have declined since 2001 in both sexes, began declining more rapidly among males in 2015. Ovary cancer death rates also declined more rapidly in recent years, with a 4.3% per year decline since 2017. Myeloma death rates in females declined 2% per year on average since 2012 after a period of stable rates between 2009 and 2012. Liver cancer death rates are now stable in males and females after a period of increasing rates. Oral cavity and pharynx cancer death rates in males are also stable after a period of increasing rates.
In contrast, earlier declines in death rates decelerated for colorectal and female breast cancers and stabilized for melanoma (males only) and prostate cancer in recent years (Table 4). For example, female breast cancer death rates decreased 2.3% per year on average during 2003–2007, 1.6% per year during 2007‐2013, and 1.2% per year during 2013–2019. Prostate cancer death rates decreased 3.4% per year on average during 2001–2013 but then stabilized during 2013–2019, and melanoma death rates in males decreased 7.5% per year on average between 2014 and 2017 and then stabilized during 2017–2019.
Recent changes in death rates for several cancer types were consistent with changes in incidence rates, including decelerated declines in incidence rates for colorectal cancer and stabilized incidence trends for prostate and liver cancer among males (Table 2). Deceleration of declines in female breast cancer death rates coincided with a steady, slight increase in incidence rates during 2004–2018, which was preceded by a declining incidence trend during 2001–2004. However, for some cancers, such as lung, declines in cancer death rates exceeded declines in incidence rates; and, in some cancers, such as kidney and myeloma among females, declines in death rates were concurrent with increases in incidence (Tables 2 and 4).
Pancreatic cancer incidence, mortality, and survival by subtypes
Pancreas cancer is the tenth most common cancer type for incidence but the fourth most common type for deaths (Tables 1 and 3), reflecting the low survival rate. Incidence and mortality trends for pancreatic cancer were almost identical for males and females during the time period considered, with incidence rates increasing by 1% per year and death rates increasing by 0.2% per year in both sexes (Tables 1, 2, 3, 4 and Figures 4A,B). Although the trends were similar, males had approximately 30% higher rates than females for both incidence and mortality.
FIGURE 4.

Trends in age‐standardized incidence (2001–2018) and mortality (2001–2019) rates for pancreas cancer, for all racial/ethnic groups combined and all ages combined, are illustrated in (A) males and (B) females. Trends were estimated using joinpoint regression and characterized by using the annual percent change (APC), the slope of a single segment, and the average APC (AAPC), a summary measure of the APCs over a fixed 5‐year interval. Joinpoint models with up to three joinpoints are based on rates per 100,000 population and are age standardized to the 2000 US standard population (19 age groups; US Bureau of the Census. Current Population Report P25‐1130. US Government Printing Office; 2000). Incidence rates were delay‐adjusted and covered 92% of the US population, and mortality covered the entire United States. APCs and AAPCs with an asterisk (*) were statistically significantly different from zero (p < .05)
By subtype, incidence rates during 2001–2018 increased for adenocarcinomas and neuroendocrine pancreatic tumors, whereas they decreased for unspecified/other pancreas tumors (Figure 5A,B). Adenocarcinomas were more likely to be diagnosed at a late stage than other types during 2014–2018; 50.7% of cases were diagnosed with distant‐stage disease, and 34.8% were diagnosed with regional‐stage disease. In contrast, 46% of neuroendocrine cases were diagnosed at localized stage (Figure 5C). Differences were also seen in the age distribution of new cases during 2014–2018; neuroendocrine tumors were diagnosed at younger ages compared with other types. Also of note was the high percentage of unspecified/other cases reported at older ages, particularly among individuals older than 85 years (Figure 5D).
FIGURE 5.
Cancer statistics for pancreas cancer by subtype are illustrated, including (A) male incidence rates (2001–2018) for all racial/ethnic groups combined and all ages combined, (B) female incidence rates (2001–2018) for all racial/ethnic groups combined and all ages combined, (C) stage distribution for cases diagnosed between 2014 and 2018, (D) age distribution for cases diagnosed between 2014 and 2018, (E) trends in observed and modeled 1‐year relative survival rates (2001–2018) for all racial/ethnic groups combined and all ages combined, and (F) trends in observed and modeled 5‐year relative survival rates (2001–2018) for all racial/ethnic groups combined and all ages combined. Incidence rates are based on rates per 100,000 population and are age standardized to the 2000 US standard population (19 age groups; US Bureau of the Census. Current Population Report P25‐1130. US Government Printing Office; 2000) and were delay‐adjusted. Registries included in the calculation of incidence trends, and stage and age distributions covered 92% of the US population (46 states): Alabama, Alaska, Arizona, Arkansas, California, Colorado, Connecticut, Delaware, Florida, Georgia, Hawaii, Idaho, Illinois, Indiana, Iowa, Kansas, Kentucky, Louisiana, Maine, Maryland, Massachusetts, Michigan, Minnesota, Missouri, Montana, Nebraska, New Hampshire, New Jersey, New Mexico, New York, North Carolina, North Dakota, Ohio, Oklahoma, Oregon, Pennsylvania, Rhode Island, South Carolina, South Dakota, Texas, Utah, Vermont, Washington, West Virginia, Wisconsin, and Wyoming. Trends in relative survival were estimated using the joinpoint survival model JPSurv. Registries included in the survival calculation cover 78% of the US population (39 states): Alabama, Alaska, Arizona, Arkansas, California, Colorado, Connecticut, Delaware, Georgia, Hawaii, Idaho, Illinois, Iowa, Kansas, Kentucky, Louisiana, Maine, Maryland, Minnesota, Mississippi, Missouri, Montana, Nebraska, New Hampshire, New Jersey, New Mexico, New York, North Carolina, North Dakota, Ohio, Pennsylvania, Rhode Island, South Carolina, Texas, Utah, Washington, West Virginia, Wisconsin, and Wyoming
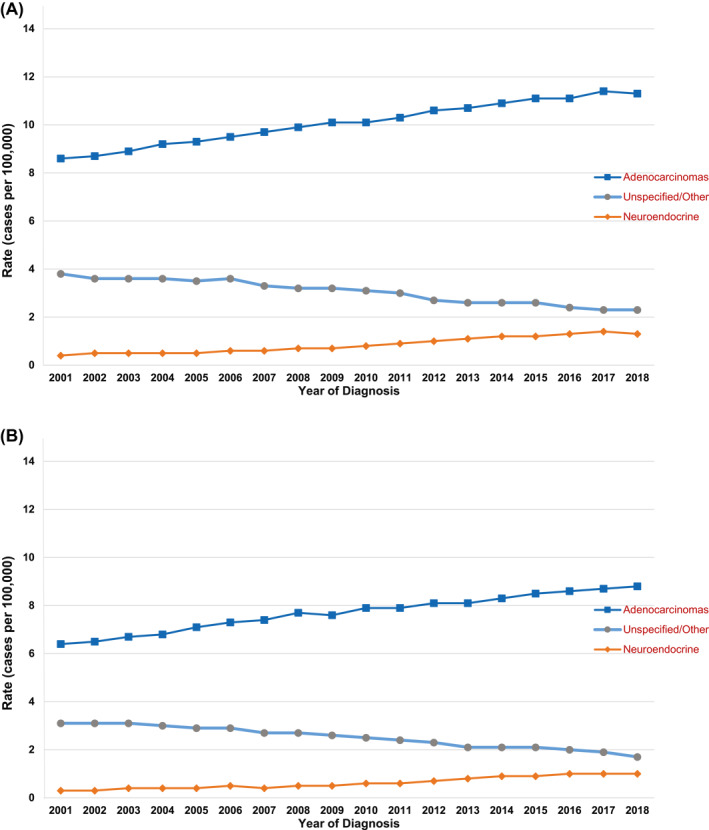
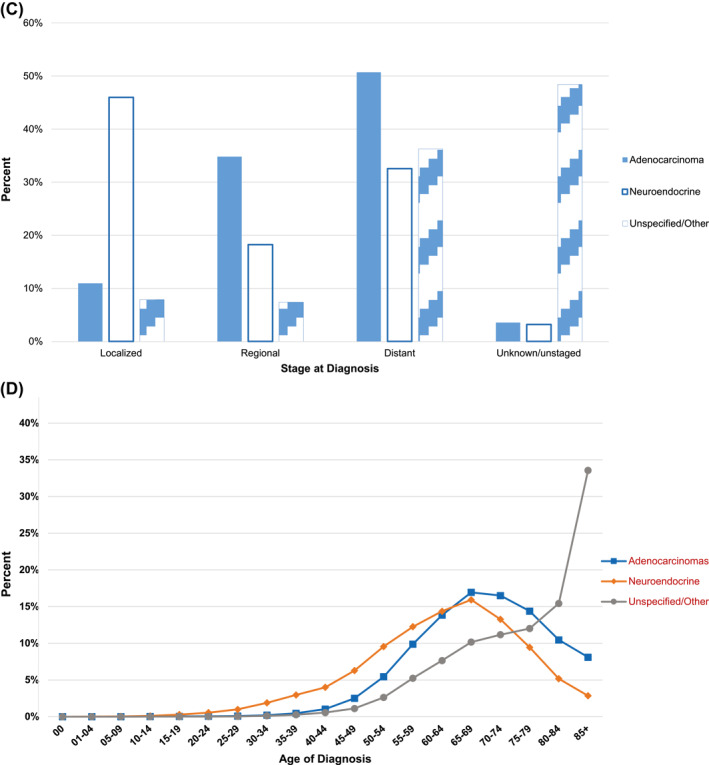
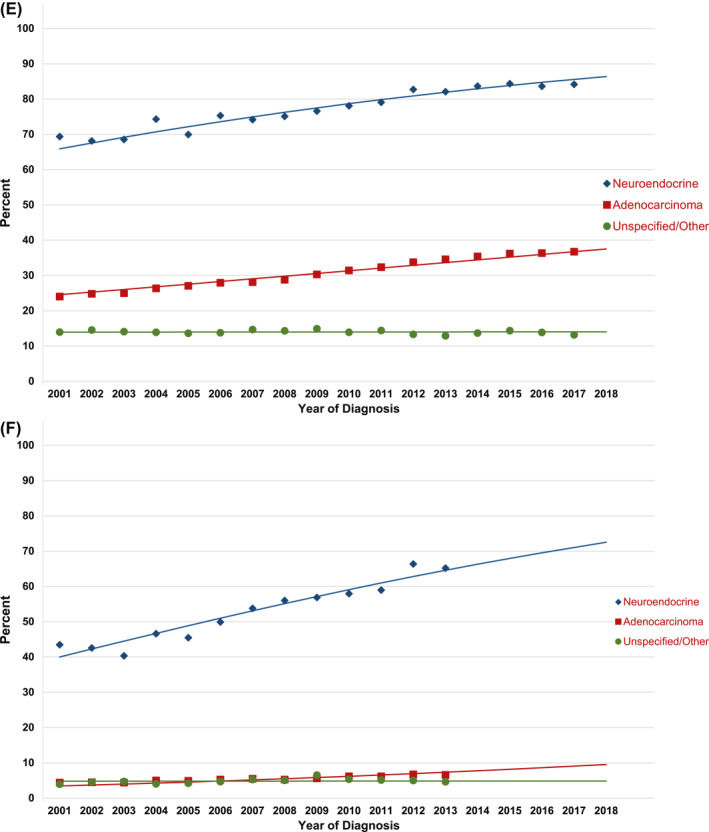
Figure 5E,F illustrate 1‐year and 5‐year relative survival trends for pancreatic cancer by subtype, including the observed relative survival by year of diagnosis and the fitted trend line. Relative survival at both 1 year and 5 years improved from 2001 to 2018 for adenocarcinomas and neuroendocrine tumors, although survival for adenocarcinoma has remained low. One‐year survival increased from 24% to 36.7% for adenocarcinomas and from 65.9% to 84.2% for neuroendocrine tumors between diagnosis years 2001 and 2017. Five‐year survival increased from 4.4% to 6.6% for adenocarcinomas and from 43.4% to 65.2% for neuroendocrine tumors between diagnosis years 2001 and 2013. One‐year and five‐year survival for unspecified/other tumors did not show an improvement over time, and the survival rates were lower than those for adenocarcinoma and neuroendocrine subtypes.
Cancer among children
Among children younger than 15 years, the incidence rate for all cancers combined during 2014–2018 was 17.8 cases per 100,000 children, ranging from 13.8 per 100,000 among Black children to 19.2 per 100,000 among AI/AN children (Table 1). Overall cancer incidence rates were stable during that period, but trends differed by racial/ethnic group. The rates were stable for Black children but increased for White, API, AI/AN, and Hispanic children (Table 1). The most common cancer types included leukemia (5.3 cases per 100,000 children), brain and ONS (3.8 cases per 100,000 children), and lymphoma (1.7 cases per 100,000 children), with increasing trends of 0.7%–0.9% per year on average for each of these cancers during 2001–2018 (Table 2). Leukemia rates showed the most variability among racial/ethnic groups, ranging from 3.3 cases per 100,000 children among Black children to 6.6 cases per 100,000 children among AI/AN children (Table 1). Leukemia incidence rates increased during the most recent 5 years (2014–2018) among White, Black, API, and Hispanic children but were stable among AI/AN children.
The cancer death rate among children during 2015–2019 was 2.0 deaths per 100,000 children, ranging from 1.9 per 100,000 among API children to 2.6 per 100,000 among AI/AN children (Table 3). The overall cancer death rate among children decreased during 2015–2019 (AAPC, −1.5%). The most common cancer deaths were from brain and ONS cancer (0.7 deaths per 100,000 children) and leukemia (0.5 deaths per 100,000 children). During 2001–2019, death rates among children declined an average of 0.4% per year for brain and ONS cancer, whereas death rates from leukemia declined an average of 2.9% per year (Table 4).
Cancer among adolescents and young adults
Among AYAs aged 15–39 years, the overall cancer incidence rate during 2014–2018 was 77.9 cases per 100,000 AYAs, ranging from 58.8 per 100,000 among API AYAs to 90.0 per 100,000 among AI/AN AYAs (Table 1). The most common cancer among AYAs was female breast cancer (22.8 per 100,000 AYAs), ranging from 18.3 per 100,000 among Hispanic AYAs to 27.0 per 100,000 among Black AYAs. The next most commonly diagnosed cancers were thyroid (12.0 per 100,000 AYAs) and testicular cancer (11.1 per 100,000 AYAs). These incidence rates varied substantially by racial/ethnic group and were lowest among Black AYAs (5.5 per 100,000 for thyroid cancer and 2.6 per 100,000 for testis cancer) and highest among White AYAs (13.6 per 100,000 for thyroid cancer) and AI/AN AYAs (14.6 per 100,000 for testis cancer). Overall cancer incidence rates among AYAs increased during 2014–2018 (AAPC, 0.9%; Table 1), as did incidence rates for colorectal, breast, and testicular cancer. Rates decreased for thyroid cancer, lymphoma, and melanoma. Trends differed during 2001–2018 for cancers of the colorectum, female breast, and thyroid (Table 2). The APC in AYA colorectal cancer incidence rates increased sharply from 1.9% on average during 2001–2011 to 5% on average during 2011–2018. AYA female breast cancer incidence rates were stable during 2001–2010, then increased by an average of 1% per year during 2010–2018, and AYA thyroid cancer incidence rates increased during 2001–2015 but decreased by an average of 3.4% per year during 2015–2018.
The cancer death rate among AYAs was 8.8 deaths per 100,000 AYAs and was highest among Black AYAs (11.2 per 100,000) and AI/AN AYAs (10.7 per 100,000) and lowest among API AYAs (6.7 per 100,000; Table 3). The most common cancer deaths among all AYAs were from female breast cancer (2.2 deaths per 100,000), brain and ONS cancer (1.0 per 100,000), leukemia (0.9 per 100,000), and colorectal cancer (0.9 per 100,000). Death rates from breast cancer among Black AYAs (4.1 per 100,000) were almost twice as high as rates among White AYAs (2.1 per 100,000); rates were lower among API (1.3 per 100,000), AI/AN (1.9 per 100,000), and Hispanic (1.9 per 100,000) AYAs. Overall cancer death rates among AYAs decreased by an average of 3% per year during 2001–2005 then slowed to 0.9% per year during 2005–2019 (Table 4). Death rates for AYA female breast cancer declined 3.3% per year on average during 2001–2010 and then stabilized during 2010–2019. During 2001–2019, death rates increased 0.8% per year on average for AYA colorectal cancer, whereas death rates decreased 2.2% per year on average for AYA leukemia and were stable for AYA brain and ONS cancer.
DISCUSSION
Progress in reducing overall cancer mortality has accelerated during the most recent period, largely driven by steep declines for lung cancer mortality. Liver cancer mortality has stabilized since 2013 among males and since 2014 among females after years of increasing rates. Mortality declines have slowed for colorectal and female breast cancer and have ceased for prostate cancer after periods of accelerated declines. Incidence trends largely reflect changes in risk factors in the population, screening behaviors, and diagnostic practices; whereas changes in risk factors, screening, and treatment all affect mortality trends. 16 Unlike mortality, incidence continues to increase among females and remains stable among males. The most rapid increases in incidence were seen for pancreas, kidney, and testis cancers among males and for melanoma, liver cancer, and myeloma among females. The AYA age group experienced increases in overall cancer incidence and the slowest mortality decline. The incidence trend for childhood cancers overall stabilized between 2015 and 2019, although it continued to increase in racial/ethnic groups. Because the number of childhood cancers is small and there is more variance in the rate estimates, it is harder to find statistically significant joinpoints than in other groups. Although there is some evidence that incidence may be leveling off for specific racial/ethnic groups, the joinpoint model has not found a significant joinpoint signaling a change in trend within racial/ethnic groups.
This report demonstrated that the incidence of pancreatic cancer increased among both males and females since 2001. Although pancreatic cancer accounts for only 3% of new cancer diagnoses, it accounts for 8% of cancer deaths and is now the fourth leading cause of cancer deaths in the United States for both males and females. 17 Approximately 10%–15% of pancreatic cancers may have a familial component. 18 Although no screening modality has demonstrated efficacy in reducing pancreatic cancer mortality in clinical trials, people with known genetic mutation syndromes may benefit from screening with endoscopic ultrasound or magnetic resonance imaging. 18
Increases in pancreatic adenocarcinomas and neuroendocrine tumors are partially explained by a decrease in unknown/other subtypes, which may be related to better access to pathology laboratory report sources by cancer registries. Pancreatic adenocarcinoma represented approximately 80% of pancreatic cancer cases diagnosed. There are very few symptoms until the disease has progressed, and pancreatic adenocarcinomas typically acquire invasive and metastatic capacity early in their course, explaining why greater than 85% of patients have regional or distant spread at the time of diagnosis. 19 Survival for pancreatic adenocarcinoma remains low, with a predicted 1‐year survival rate of 38% and a 5‐year survival rate of 10% for cases diagnosed in 2018. Pancreatic neuroendocrine tumors generally are slower growing, and approximately 50% are localized at the time of diagnosis. The current results indicate that neuroendocrine pancreatic cancers had higher survival than pancreatic adenocarcinomas, which tend to be diagnosed at a late stage, when surgical resection is not recommended. 19 Neuroendocrine pancreatic cancers also had higher survival than unspecified/other types, which were mostly diagnosed among older adults. Relative survival increased from 2001 to 2018 for both adenocarcinomas and neuroendocrine tumors, but this good news is tempered by the overall increase in pancreatic cancer incidence during this same period. This increase in incidence is generally attributed to the increase in obesity prevalence, which has offset declines in smoking prevalence. 20 Improvements in medical imaging techniques and increased use of imaging also may have contributed to improved detection and diagnosis of pancreatic cancer. 21
There have also been improvements in multimodality therapy for pancreatic adenocarcinoma, which have shown a small survival benefit. 22 Emerging data about the efficacy of neoadjuvant chemoradiotherapy followed by surgery and chemotherapy have shown improved 5‐year overall survival compared with surgery followed by chemotherapy. 23 Nonetheless, progress in treating pancreatic adenocarcinoma has been incremental at best, as demonstrated by the modest gains in survival over time. In contrast, pancreatic neuroendocrine tumors have shown sustained increases in 5‐year survival since 2000. These results are based on advances in multimodality therapies, including surgery, ablation/embolization, and a variety of chemotherapeutic approaches. 24 , 25
Lung cancer rates declined during the most recent period for both incidence and mortality, reflecting the continuous decline in smoking prevalence and improved treatments. Adult smoking prevalence declined from >40% during the early 1960s to 13% in 2019. 26 , 27 The decline in lung cancer death rates during the most recent period, however, was more than double the decline for incidence, in part reflecting recent advances in targeted and immune therapies for non‐small cell lung cancer (NSCLC). 28 The US Food and Drug Administration approved the first targeted therapy for NSCLC in 2003, 29 followed by the approval of several other targeted therapies, recommendations for genetic mutation testing of all individuals with nonsquamous NSCLC for relevant genetic targets in 2012, and approval of several immune checkpoint inhibitors in 2015–2016. 30 Other treatment advances for lung cancer include minimally invasive surgery 31 ; stereotactic body radiation therapy for inoperable, early stage cancer 32 ; adjuvant therapy; and supportive and palliative care. 33 Treatment advances that increase survival may delay or prevent cancer deaths; data on additional years of mortality rates will provide insight into the longer term benefits of these treatments.
Nontreatment factors that also may have contributed to the steep decline in lung cancer mortality during the most recent period include improved access to care, which followed the expansion of Medicaid to a broader group of low‐income adults beginning in 2014. 34 Lung cancer screening use slightly increased from 4% in 2014 to 6.5% in 2020 nationwide, 35 , 36 with the rate in 2020 as high as 18%–20% in states with comprehensive screening programs, such as Kentucky and Massachusetts. 36 Also, between 2013 and 2018, the proportion of lung cancer cases diagnosed at localized stage increased from 20% to 28%, perhaps in part because of increased screening. 17 Although there has been considerable progress in reducing mortality from lung cancer, it remains the leading cause of cancer death in every racial/ethnic group and greater than 30 million adults currently smoke cigarettes. 37 The broad and equitable application of proven tobacco control policies, such as raising excise tax on tobacco products, banning flavored tobacco products, and enacting and implementing smoke‐free laws to promote cessation and discourage initiation, may help to further reduce smoking prevalence. 38 , 39
Contrary to the rapid decline in the risk of tobacco‐related cancers, progress has stagnated for some cancers associated with metabolic factors, such as excess body weight, 40 physical inactivity, 41 , 42 and diabetes. 43 , 44 , 45 , 46 Increasing incidence trends continued for cancers of the female breast, colorectum (among AYAs), and pancreas, and trends have decelerated or stabilized since the mid‐2010s for myeloma and cancers of the uterus and kidney. A parallel rise in death rates occurred only for colorectal (among AYAs), pancreatic, and uterine cancers; however, the earlier declines in death rates slowed for breast cancer. The staggering rise in obesity, 47 diabetes, 48 and total sitting time 49 continues among adults and youth, highlighting opportunities to halt these unfavorable trends.
A more than decade‐long rise in uterine cancer incidence rates leveled off during 2014–2018 among White females but continued in all other groups by >2% per year during that period. The stabilization in the incidence rates among White females appeared to be driven by more common and less aggressive subtypes (i.e., endometrioid subtype), whereas nonendometrioid subtypes continued to rise rapidly in all groups. 50 Well established risk factors for uterine cancer include excess body weight, diabetes, physical inactivity, nulliparity (no births), fewer births, and earlier age at menarche, 51 which may have contributed to the increasing incidence trends; however, reasons for the more rapid rise of nonendometrioid subtypes remain unknown. 52 Uterine cancer death rates continued to increase in all groups, although there are indications that they have stabilized since 2016. 17 Despite the similar incidence of uterine cancer among Black and White females, uterine cancer death rates are twice as high in Black females, and this disparity is increasing. 53 Nonendometrioid subtypes account for 35% of all uterine cancers among Black females, which is considerably higher than the 16% among White females, 50 likely contributing to the disproportionately higher death rate among Black females—although Black females had worse survival across all stages and subtypes. 50 , 54 In addition to multilevel interventions to help females achieve and maintain a healthy body weight and physical activity level, identifying the factors associated with increasing trends in aggressive uterine cancers, the higher prevalence of aggressive disease among Black females, and the racial disparity in survival may help further inform public health programs aimed at reducing this burden. 52
The steady increase in breast cancer incidence since 2004 continued by 0.5% per year, which coincides with the deceleration of declining death rates, potentially slowing the progress against breast cancer death achieved since the early 1990s. 55 , 56 The increase in breast cancer incidence may reflect continuing decreases in parity rates 57 , 58 and advancing age at first birth 58 as well as increases in obesity 47 and alcohol consumption. 59 The racial gap in the breast cancer death rate persists; the death rate during 2015–2019 was 28.0 per 100,000 among Black females, which was 40% higher than the 19.9 per 100,000 among White females (who ranked second) and 140% higher than the 11.7 among API females (who have the lowest rates). The highest breast cancer death rates seen among Black females are partially caused by the significant barriers to providing access to timely, high‐quality medical care, which require addressing multiple dimensions of disparity across the continuum of cancer care. 60 , 61 , 62 , 63 , 64 , 65 , 66 , 67 , 68
Black females also experience the highest rates of aggressive breast cancer subtypes—estrogen‐receptor–negative or triple‐negative—of all populations. Ascribing underlying reasons for such high rates among Black females is complex, although premenopausal abdominal adiposity, 69 , 70 earlier age at menarche, 71 , 72 , 73 higher parity without breastfeeding, 74 and multiple genetic variants 75 , 76 , 77 , 78 have been identified as risk factors for estrogen receptor–negative breast cancer. Importantly, residential segregation, neighborhood disadvantage, and lower neighborhood socioeconomic status (SES) have been associated with increased risk for estrogen receptor–negative breast cancer among Black females, 79 , 80 , 81 , 82 , 83 even after controlling for multiple behavioral and lifestyle factors. 79 Findings from these studies point to structural factors as significant elements contributing to racial disparity in breast cancer subtypes. Addressing structural racism may contribute to health equity in breast cancer mortality. 84
Thyroid cancer incidence continued to decrease for both males and females overall, and this is the first year that it also decreased for AYAs after years of increasing rates. However, rates increased for AI/AN males and females. The declines are thought to reflect changes in diagnosis practices beginning in 2009. 85 Prior studies have shown increases in both incidence and death rates of distant‐stage thyroid cancer from the 1990s to the early 2010s, 86 , 87 suggesting that there is a genuine increase in the risk of thyroid cancer that likely reflects changes in the prevalence of underlying risk factors, such as excess body weight. 88
Prostate cancer incidence rates stabilized during 2014–2018 after sharply declining during 2007–2014. These trends coincided with changes in the use of prostate‐specific antigen (PSA) testing, which followed the US Preventive Services Task Force recommendations against PSA‐based prostate cancer screening for men aged 75 years or older in 2008 89 and for all men in 2012. 90 Routine PSA testing declined from 2007 to 2013 and remained unchanged from 2013 to 2018. 91 Prostate cancer incidence rates, however, continued to increase for regional‐stage and distant‐stage disease, 92 which may have contributed to the recent stabilization of prostate cancer mortality after years of a declining trend. 92 Other factors that also may have contributed to the stabilized mortality include the rise in obesity prevalence, 93 which is associated with advanced‐stage or aggressive forms of prostate cancer. 94 , 95 In 2018, the US Preventive Services Task Force recommended informed decision making for PSA‐based screening in men aged 55–69 years, 96 reversing its prior recommendations. Long‐term monitoring of prostate cancer incidence and mortality may help assess the effects of the 2018 recommendation.
Last year's report focused on increased survival and rapid declines in mortality for melanoma after the introduction of new treatments, including targeted treatments and immune checkpoint inhibitors. 97 After a period during which melanoma mortality was declining sharply and incidence was increasing, incidence rates among males have stabilized since 2016, and mortality among males has stabilized since 2017. Among females, incidence has increased for melanoma faster than for any other cancer site, whereas melanoma mortality has decreased. The AYA age group has experienced decreasing melanoma incidence rates since 2001, suggesting that public health efforts, such as limiting tanning bed use, are having an effect on this age group. 98
Death rates for cancers of the oral cavity and pharynx increased among White males and females but not among other racial/ethnic groups. This group of cancers is anatomically and histologically diverse, arising from exposure to different causal factors, such as alcohol use, tobacco use, and human papillomavirus infection. 99 Recent studies suggest that increases in oral cavity and pharynx cancer are caused primarily by increases in human papillomavirus‐associated types. 100 , 101
In previous annual reports to the nation, incidence rates for API and AI/AN persons included Hispanic and non‐Hispanic ethnicities, whereas this year's report is based on non‐Hispanic API and non‐Hispanic AI/AN ethnicities. This change in reporting resulted in a small increase in incidence rates among non‐Hispanic API persons compared with all API persons and a larger increase for non‐Hispanic AI/AN persons compared with all AI/AN persons (Table S2). 102 , 103 Population estimates are based on race and ethnicity reported by respondents or their proxies in the US census; however, methods are used to correct for missing responses. For example, individuals who self‐report as Hispanic may not see themselves captured in the race variable and may not answer the race question in the census. 104 In the 2010 census, those reporting Hispanic ethnicity were more likely to have missing race information than the total population. 105 When race is missing or is categorized as some other race, it is assigned by the US Bureau of the Census using other available information. 106 Changes in methodology with the 2010 census resulted in the US Bureau of the Census assigning more people with Hispanic ethnicity and missing or some other race to the AI/AN category than in previous years, artificially inflating the Hispanic AI/AN denominator and thus yielding lower cancer rates for all AI/AN persons. 102 , 107 In addition, there are issues of misclassification of race and ethnicity in medical records and death certificates, causing underestimation of cancer incidence and death rates, with the greatest impact on AI/AN and Hispanic populations. 102 , 103 , 108 , 109 , 110 Reporting cancer rates among non‐Hispanic AI/AN persons residing in PRCDA counties is considered to improve the accuracy of cancer burden estimates among AI/AN people. 110 In the current report, compared with other racial/ethnic groups, AI/AN persons residing in PRCDA counties had the highest cancer incidence rate overall, the second highest among males, and the highest among females.
In previous reports, the definition of malignant cases included when calculating rates and trends was restricted to those that would have been reportable to registries from 1975 and forward. For this report, a change was made to include reportable cases based on the definitions in place during the year of diagnosis. This includes changes that occurred with the release of the ICD‐O‐3, 2 which went into effect in 2001, and the release of ICD‐O‐3 Revision 1, which went into effect in 2010. 3 , 5 For example, in 2010, new morphology codes meant that more hematopoietic tumors were considered malignant. As a result of these changes, age‐adjusted incidence for all cancer sites combined in 2001 increased about 1% compared with the prior definition, and a smaller impact was seen in 2010 for age‐adjusted incidence rates compared with the prior definition. 6
The ICD‐O‐3 revision in 2010 affected mostly hematopoietic malignancies and thus had a larger impact on incidence rates of childhood cancer. The incidence rate for childhood cancers in last year's report gave an incidence rate of 16.8 per 100,000 for diagnosis years 2013–2017, while in this year's report the incidence rate for childhood cancers is 17.8 per 100,000 for diagnosis years 2014–2018. The rate would have been 17.0 per 100,000 if the old definition had been used. Comparable differences for childhood lymphoma were not observed because most new morphology codes reportable since 2010 were Langerhans cell histiocytosis, which were classified as miscellaneous in the SEER site categorization.
CONCLUSIONS
Cancer death rates continued to decline overall, for children, and for AYAs, and treatment advances have led to accelerated declines for several sites, such as lung and melanoma. Cancer incidence stabilized for males and children and increased for females and AYAs, reflecting changes in cancer risk factors, screening test use, and diagnostic practices. The continuous, large racial/ethnic disparities in cancer incidence and mortality underscore the need to fully understand contributing factors for addressing the inequalities. Population‐based incidence and mortality data inform prevention, early detection, and treatment efforts to help reduce the cancer burden in the United States.
AUTHOR CONTRIBUTIONS
Kathleen A. Cronin: Conceptualization; supervision; visualization; writing–original draft; writing–review and editing. Susan Scott: Writing–review and editing; project administration. Albert U. Firth: Data curation; formal analysis; investigation; resources; software; validation; visualization. Hyuna Sung: Writing–original draft; Writing–review and editing. S. Jane Henley: Conceptualization; Writing–review and editing. Recinda L. Sherman: Methodology; Resources; Writing–review and editing. Rebecca L. Siegel: Conceptualization; Writing–review and editing. Robert N. Anderson: Conceptualization; Writing–review and editing. Betsy A. Kohler: Conceptualization; supervision. Vicki B. Benard: Writing–review and editing. Serban Negoita: Conceptualization; Resources; Writing–review and editing; Validation. Charles Wiggins: Resources; Writing–review and editing. William G. Cance: Writing–original draft. Ahmedin Jemal: Conceptualization; writing–original draft; writing–review and editing.
CONFLICT OF INTEREST
Betsy A. Kohler reports personal fees from the National Firefighters Registry outside the submitted work and is a fiduciary officer of the North American Association of Central Cancer Registries. Charles Wiggins reports personal fees from the Northwest Portland Area Indian Health Board outside the submitted work and is a fiduciary officer of the International Association of Cancer Registries. William G. Cance reports personal fees from the University of North Carolina at Chapel Hill School of Medicine outside the submitted work, service on an ACRIN Data and Safety Monitoring Board, and has a spouse/partner who is a consultant for FAKnostics. The remaining authors made no disclosures.
Supporting information
Table S1
Table S2
ACKNOWLEDGEMENTS
This work was supported by the National Cancer Institute, the Centers for Disease Control and Prevention, the American Cancer Society, and the North American Association of Central Cancer Registries. The findings and conclusions in this report are those of the authors and do not necessarily represent the official position of the Centers for Disease Control and Prevention. The authors gratefully acknowledge the contributions of the state and regional cancer registry staff and health department personnel for their work in collecting the data used in this report. In addition, the authors thank Information Management Services, Inc., for assistance in compiling the data used in this report.
Cronin KA, Scott S, Firth AU, et al. Annual report to the nation on the status of cancer, part 1: National cancer statistics. Cancer. 2022;128(24):4251‐4284. doi: 10.1002/cncr.34479
REFERENCES
- 1. Sherman R, Firth R, Charlton M, et al., eds. Cancer in North America: 2014‐2018. Volume One: Combined Cancer Incidence for the United States, Canada and North America. North American Association of Central Cancer Registries, Inc.; 2021. [Google Scholar]
- 2. Fritz A, Percy C, Jack A, Shanmugaratnam K, Sobin LH. International Classification of Diseases for Oncology. 3rd ed. World Health Organization; 2000. Accessed February 1, 2022. https://apps.who.int/iris/handle/10665/42344 [Google Scholar]
- 3. Swerdlow SH, Campo E, Harris NL, et al., eds. WHO Classification of Tumours of Haematopoietic and Lymphoid Tissues. 4th ed. Vol. 2. IARC Press; 2008. [Google Scholar]
- 4. National Cancer Institute . Site Recode ICD‐O‐3/WHO 2008 Definition. SEER Data Reporting Tools. National Cancer Institute, Surveillance, Epidemiology, and End Results (SEER) Program. Accessed February 1, 2022. https://seer.cancer.gov/siterecode/icdo3_dwhoheme/ [Google Scholar]
- 5. World Health Organization. International Classification of Diseases for Oncology (ICD‐O) 3rd ed. 1st revision. World Health Organization; 2013. Accessed February 1, 2022. https://apps.who.int/iris/handle/10665/96612 [Google Scholar]
- 6. National Cancer Institute . Behavior Variable Changes. National Cancer Institute, Surveillance, Epidemiology, and End Results Program; 2022. Accessed February 1, 2022. https://seer.cancer.gov/data‐software/documentation/seerstat/nov2020/behavior‐change.html [Google Scholar]
- 7. Centers for Disease Control and Prevention . National Death Index. Centers for Disease Control and Prevention, National Center for Health Statistics; 2022. Accessed February 1, 2022. https://www.cdc.gov/nchs/ndi/index.htm [Google Scholar]
- 8. Johnson CJ, Wilson R, Mariotto A, et al., eds. Cancer in North America: 2014‐2018. Volume Four: Cancer Survival in the United States and Canada 2011‐2017. North American Association of Central Cancer Registries, Inc.; 2021. [Google Scholar]
- 9. National Cancer Institute . Modifications to Census Bureau’s County Population Data. National Cancer Institute, Surveillance, Epidemiology, and End Results Program. Accessed February 1, 2022. https://seer.cancer.gov/popdata/modifications.html [Google Scholar]
- 10. Centers for Disease Control and Prevention . National Vital Statistics System. Bridged‐Race Population Estimates—Data Files and Documentation. National Center for Health Statistics, Centers for Disease Control and Prevention. Accessed February 1, 2022. https://www.cdc.gov/nchs/nvss/bridged_race/data_documentation.htm [Google Scholar]
- 11. North American Association of Central Cancer Registries (NAACCR) . Cancer in North America. Appendix G—PRCDA Counties by Indian Health Services Region and State. NAACCR; 2013‐2017. Accessed February 1, 2022. https://www.naaccr.org/wp‐content/uploads/2020/06/CINA.2013‐2017.appendix.g.pdf [Google Scholar]
- 12. National Cancer Institute . SEER*Stat Software. National Cancer Institute, Surveillance, Epidemiology, and End Results (SEER) Program; 2022. Accessed February 1, 2022. https://seer.cancer.gov/seerstat [Google Scholar]
- 13. North American Association of Central Cancer Registries (NAACCR) . 2022 Release of Delay Adjustment Factors and Rates. Delay Adjustment. NAACCR; 2022. Accessed February 1, 2022. https://www.naaccr.org/delay‐adjustment/ [Google Scholar]
- 14. National Cancer Institute . Joinpoint Regression Program, version 4.9.0.0. Joinpoint Trend Analysis Software, Surveillance Research Program. National Cancer Institute; 2021. Accessed February 21, 2021. https://surveillance.cancer.gov/joinpoint/ [Google Scholar]
- 15. National Cancer Institute . JPSurv. JoinPoint Survival Model. National Cancer Institute, Division of Cancer Control & Population Sciences, Surveillance Research Program. Accessed February 1, 2022. https://analysistools.cancer.gov/jpsurv/ [Google Scholar]
- 16. Edwards BK, Ward E, Kohler BA, et al. Annual report to the nation on the status of cancer, 1975‐2006, featuring colorectal cancer trends and impact of interventions (risk factors, screening, and treatment) to reduce future rates. Cancer. 2010;116(3):544‐573. doi: 10.1002/cncr.24760 [DOI] [PMC free article] [PubMed] [Google Scholar]
- 17. Siegel RL, Miller KD, Fuchs HE, Jemal A. Cancer statistics, 2022. CA A Cancer J Clin. 2022;72(1):7‐33. doi: 10.3322/caac.21708 [DOI] [PubMed] [Google Scholar]
- 18. Canto MI. Familial risk factors for pancreatic cancer and screening of high‐risk patients. In: Lamont JT, ed. UpToDate, Inc; 2022. Accessed February 4, 2022. https://www.uptodate.com/contents/familial‐risk‐factors‐for‐pancreatic‐cancer‐and‐screening‐of‐high‐risk‐patients
- 19. National Cancer Institute . Pancreatic Cancer Treatment (Adult) (PDQ®)—Patient Version. National Cancer Institute; 2020. Accessed February 1, 2022. https://www.cancer.gov/types/pancreatic/patient/pancreatic‐treatment‐pdq [Google Scholar]
- 20. Ma J, Jemal A. The rise and fall of cancer mortality in the USA: why does pancreatic cancer not follow the trend? Future Oncol. 2013;9(7):917‐919. doi: 10.2217/fon.13.76 [DOI] [PubMed] [Google Scholar]
- 21. Zhou J, Enewold L, Stojadinovic A, et al. Incidence rates of exocrine and endocrine pancreatic cancers in the United States. Cancer Causes Control. 2010;21(6):853‐861. doi: 10.1007/s10552-010-9512-y [DOI] [PubMed] [Google Scholar]
- 22. Sakaguchi T, Satoi S, Yamamoto T, Yamaki S, Sekimoto M. The past, present, and future status of multimodality treatment for resectable/borderline resectable pancreatic ductal adenocarcinoma. Surg Today. 2020;50(4):335‐343. doi: 10.1007/s00595-020-01963-2 [DOI] [PMC free article] [PubMed] [Google Scholar]
- 23. Versteijne E, van Dam JL, Suker M, et al. Neoadjuvant chemoradiotherapy versus upfront surgery for resectable and borderline resectable pancreatic cancer: long‐term results of the Dutch randomized PREOPANC trial. J Clin Oncol. 2022;40(11):1220‐1230. doi: 10.1200/jco.21.02233 [DOI] [PubMed] [Google Scholar]
- 24. Raymond E, Dahan L, Raoul JL, et al. Sunitinib malate for the treatment of pancreatic neuroendocrine tumors. N Engl J Med. 2011;364(6):501‐513. doi: 10.1056/nejmoa1003825 [DOI] [PubMed] [Google Scholar]
- 25. Yao JC, Shah MH, Ito T, et al. Everolimus for advanced pancreatic neuroendocrine tumors. N Engl J Med. 2011;364(6):514‐523. doi: 10.1056/nejmoa1009290 [DOI] [PMC free article] [PubMed] [Google Scholar]
- 26. Cornelius ME, Wang TW, Jamal A, Loretan CG, Neff LJ. Tobacco product use among adults—United States, 2019. MMWR Morb Mortal Wkly Rep. 2020;69(46):1736‐1742. doi: 10.15585/mmwr.mm6946a4 [DOI] [PMC free article] [PubMed] [Google Scholar]
- 27. Cornelius ME, Loretan CG, Wang TW, Jamal A, Homa DM. Tobacco product use among adults—United States, 2020. MMWR Morb Mortal Wkly Rep. 2022;71(11):397‐405. doi: 10.15585/mmwr.mm7111a1 [DOI] [PMC free article] [PubMed] [Google Scholar]
- 28. Howlader N, Forjaz G, Mooradian MJ, et al. The effect of advances in lung cancer treatment on population mortality. N Engl J Med. 2020;383(7):640‐649. doi: 10.1056/nejmoa1916623 [DOI] [PMC free article] [PubMed] [Google Scholar]
- 29. Dyer O. FDA announces fast track approval of new drug for lung cancer. BMJ. 2003;326(7397):1004. doi: 10.1136/bmj.326.7397.1004/d [DOI] [PMC free article] [PubMed] [Google Scholar]
- 30. Davis AA, Patel VG. The role of PD‐L1 expression as a predictive biomarker: an analysis of all US Food and Drug Administration (FDA) approvals of immune checkpoint inhibitors. J Immunother Cancer. 2019;7(1):278. doi: 10.1186/s40425-019-0768-9 [DOI] [PMC free article] [PubMed] [Google Scholar]
- 31. Cao C, Manganas C, Ang SC, Peeceeyen S, Yan TD. Video‐assisted thoracic surgery versus open thoracotomy for non‐small cell lung cancer: a meta‐analysis of propensity score‐matched patients. Interact Cardiovasc Thorac Surg. 2013;16(3):244‐249. doi: 10.1093/icvts/ivs472 [DOI] [PMC free article] [PubMed] [Google Scholar]
- 32. Timmerman R, Paulus R, Galvin J, et al. Stereotactic body radiation therapy for inoperable early stage lung cancer. JAMA. 2010;303(11):1070‐1076. doi: 10.1001/jama.2010.261 [DOI] [PMC free article] [PubMed] [Google Scholar]
- 33. Jones GS, Baldwin DR. Recent advances in the management of lung cancer. Clin Med (Lond). 2018;18(suppl 2):s41‐s46. doi: 10.7861/clinmedicine.18-2-s41 [DOI] [PMC free article] [PubMed] [Google Scholar]
- 34. Liu Y, Colditz GA, Kozower BD, et al. Association of Medicaid expansion under the Patient Protection and Affordable Care Act with non–small cell lung cancer survival. JAMA Oncol. 2020;6(8):1289‐1290. doi: 10.1001/jamaoncol.2020.1040 [DOI] [PMC free article] [PubMed] [Google Scholar]
- 35. Jemal A, Fedewa SA. Lung cancer screening with low‐dose computed tomography in the United States—2010 to 2015. JAMA Oncol. 2017;3(9):1278‐1281. doi: 10.1001/jamaoncol.2016.6416 [DOI] [PMC free article] [PubMed] [Google Scholar]
- 36. Fedewa SA, Bandi P, Smith RA, Silvestri GA, Jemal A. Lung cancer screening rates during the COVID‐19 pandemic. Chest. 2022;161(2):586‐589. doi: 10.1016/j.chest.2021.07.030 [DOI] [PMC free article] [PubMed] [Google Scholar]
- 37. Centers for Disease Control and Prevention . Current Cigarette Smoking Among Adults in the United States. Smoking & Tobacco Use. Centers for Disease Control and Prevention; 2022. Accessed February 1, 2022. https://cdc.gov/tobacco/data_statistics/fact_sheets/adult_data/cig_smoking/ [Google Scholar]
- 38. Cokkinides V, Bandi P, Ward E, Jemal A, Thun M. Progress and opportunities in tobacco control. CA A Cancer J Clin. 2006;56(3):135‐142. doi: 10.3322/canjclin.56.3.135 [DOI] [PubMed] [Google Scholar]
- 39. Centers for Disease Control and Prevention . Best Practices for Comprehensive Tobacco Control Programs. US Department of Health and Human Services, Centers for Disease Control and Prevention, National Center for Chronic Disease Prevention and Health Promotion, Office on Smoking and Health; 2014. Accessed February 1, 2022. https://www.cdc.gov/tobacco/stateandcommunity/best_practices/pdfs/2014/comprehensive.pdf [Google Scholar]
- 40. Lauby‐Secretan B, Scoccianti C, Loomis D, Grosse Y, Bianchini F, Straif K; International Agency for Research on Cancer Handbook Working Group. Body fatness and cancer—viewpoint of the IARC Working Group. N Engl J Med. 2016;375(8):794‐798. doi: 10.1056/nejmsr1606602 [DOI] [PMC free article] [PubMed] [Google Scholar]
- 41. Liu L, Shi Y, Li T, et al. Leisure time physical activity and cancer risk: evaluation of the WHO's recommendation based on 126 high‐quality epidemiological studies. Br J Sports Med. 2016;50(6):372‐378. doi: 10.1136/bjsports-2015-094728 [DOI] [PubMed] [Google Scholar]
- 42. Moore SC, Lee IM, Weiderpass E, et al. Association of leisure‐time physical activity with risk of 26 types of cancer in 1.44 million adults. JAMA Intern Med. 2016;176(6):816‐825. doi: 10.1001/jamainternmed.2016.1548 [DOI] [PMC free article] [PubMed] [Google Scholar]
- 43. Tsilidis KK, Kasimis JC, Lopez DS, Ntzani E, Ioannidis JP. Type 2 diabetes and cancer: umbrella review of meta‐analyses of observational studies. BMJ. 2015;350:g7607. doi: 10.1136/bmj.g7607 [DOI] [PubMed] [Google Scholar]
- 44. Shahid RK, Ahmed S, Le D, Yadav S. Diabetes and cancer: risk, challenges, management and outcomes. Cancers (Basel). 2021;13(22):5735. doi: 10.3390/cancers13225735 [DOI] [PMC free article] [PubMed] [Google Scholar]
- 45. Giovannucci E, Harlan DM, Archer MC, et al. Diabetes and cancer: a consensus report. CA A Cancer J Clin. 2010;60(4):207‐221. doi: 10.3322/caac.20078 [DOI] [PubMed] [Google Scholar]
- 46. Pearson‐Stuttard J, Zhou B, Kontis V, Bentham J, Gunter MJ, Ezzati M. Worldwide burden of cancer attributable to diabetes and high body‐mass index: a comparative risk assessment. Lancet Diabetes Endocrinol. 2018;6(2):95‐104. doi: 10.1016/s2213-8587(18)30150-5 [DOI] [PMC free article] [PubMed] [Google Scholar]
- 47. Hales CM, Carroll MD, Fryar CD, Ogden CL. Prevalence of obesity and severe obesity among adults: United States, 2017‐2018. NCHS Data Brief. 2020;360:1‐8. [PubMed] [Google Scholar]
- 48. Centers for Disease Control and Prevention . National Diabetes Statistics Report, 2020. Centers for Disease Control and Prevention, US Department of Health and Human Services; 2020. Accessed February 1, 2022. https://www.cdc.gov/diabetes/pdfs/data/statistics/national‐diabetes‐statistics‐report.pdf [Google Scholar]
- 49. Yang L, Cao C, Kantor ED, et al. Trends in sedentary behavior among the US Population, 2001‐2016. JAMA. 2019;321(16):1587‐1597. doi: 10.1001/jama.2019.3636 [DOI] [PMC free article] [PubMed] [Google Scholar]
- 50. Clarke MA, Devesa SS, Harvey SV, Wentzensen N. Hysterectomy‐corrected uterine corpus cancer incidence trends and differences in relative survival reveal racial disparities and rising rates of nonendometrioid cancers. J Clin Oncol. 2019;37(22):1895‐1908. doi: 10.1200/jco.19.00151 [DOI] [PMC free article] [PubMed] [Google Scholar]
- 51. Setiawan VW, Yang HP, Pike MC, et al. Type I and II endometrial cancers: have they different risk factors? J Clin Oncol. 2013;31(20):2607‐2618. [DOI] [PMC free article] [PubMed] [Google Scholar]
- 52. Mullins MA, Cote ML. Beyond obesity: the rising incidence and mortality rates of uterine corpus cancer. J Clin Oncol. 2019;37(22):1851‐1853. doi: 10.1200/jco.19.01240 [DOI] [PMC free article] [PubMed] [Google Scholar]
- 53. Giaquinto AN, Broaddus RR, Jemal A, Siegel RL. The changing landscape of gynecologic cancer mortality in the United States. Obstet Gynecol. 2022;139(3):440‐442. doi: 10.1097/aog.0000000000004676 [DOI] [PMC free article] [PubMed] [Google Scholar]
- 54. Cote ML, Ruterbusch JJ, Olson SH, Lu K, Ali‐Fehmi R. The growing burden of endometrial cancer: a major racial disparity affecting Black women. Cancer Epidemiol Biomarkers Prev. 2015;24(9):1407‐1415. doi: 10.1158/1055-9965.epi-15-0316 [DOI] [PubMed] [Google Scholar]
- 55. Anderson WF, Katki HA, Rosenberg PS. Incidence of breast cancer in the United States: current and future trends. J Natl Cancer Inst. 2011;103(18):1397‐1402. doi: 10.1093/jnci/djr257 [DOI] [PMC free article] [PubMed] [Google Scholar]
- 56. DeSantis CE, Ma J, Gaudet MM, et al. Breast cancer statistics, 2019. CA A Cancer J Clin. 2019;69(6):438‐451. doi: 10.3322/caac.21583 [DOI] [PubMed] [Google Scholar]
- 57. Pfeiffer RM, Webb‐Vargas Y, Wheeler W, Gail MH. Proportion of U.S. trends in breast cancer incidence attributable to long‐term changes in risk factor distributions. Cancer Epidemiol Biomarkers Prev. 2018;27(10):1214‐1222. doi: 10.1158/1055-9965.epi-18-0098 [DOI] [PMC free article] [PubMed] [Google Scholar]
- 58. Martin JA, Hamilton BE, Osterman MJK, Driscoll AK. Births: final data for 2018. Natl Vital Stat Rep. 2019;68(13):1‐47. [PubMed] [Google Scholar]
- 59. National Institute on Alcohol Abuse and Alcoholism . Alcohol Facts and Statistics. National Institute on Alcohol Abuse and Alcoholism; 2022. Accessed January 31, 2022. https://www.niaaa.nih.gov/publications/brochures‐and‐fact‐sheets/alcohol‐facts‐and‐statistics
- 60. Warnecke RB, Campbell RT, Vijayasiri G, Barrett RE, Rauscher GH. Multilevel examination of health disparity: the role of policy implementation in neighborhood context, in patient resources, and in healthcare facilities on later stage of breast cancer diagnosis. Cancer Epidemiol Biomarkers Prev. 2019;28(1):59‐66. doi: 10.1158/1055-9965.epi-17-0945 [DOI] [PMC free article] [PubMed] [Google Scholar]
- 61. Tait SD, Ren Y, Horton CC, et al. Characterizing participants in the North Carolina Breast and Cervical Cancer Control Program: a retrospective review of 90, 000 women. Cancer. 2021;127(14):2515‐2524. doi: 10.1002/cncr.33473 [DOI] [PMC free article] [PubMed] [Google Scholar]
- 62. Chavez‐MacGregor M, Clarke CA, Lichtensztajn DY, Giordano SH. Delayed initiation of adjuvant chemotherapy among patients with breast cancer. JAMA Oncol. 2016;2(3):322‐329. doi: 10.1001/jamaoncol.2015.3856 [DOI] [PMC free article] [PubMed] [Google Scholar]
- 63. Eaglehouse YL, Georg MW, Shriver CD, Zhu K. Racial differences in time to breast cancer surgery and overall survival in the US military health system. JAMA Surg. 2019;154(3):e185113. doi: 10.1001/jamasurg.2018.5113 [DOI] [PMC free article] [PubMed] [Google Scholar]
- 64. Zhang L, King J, Wu XC, et al. Racial/ethnic differences in the utilization of chemotherapy among stage I‐III breast cancer patients, stratified by subtype: findings from ten National Program of Cancer Registries states. Cancer Epidemiol. 2019;58:1‐7. doi: 10.1016/j.canep.2018.10.015 [DOI] [PMC free article] [PubMed] [Google Scholar]
- 65. Jain U, Jain B, Fayanju OM, Chino F, Edward CD. Disparities in timely treatment among young women with breast cancer. Am J Surg. 2022;224(2):811‐815. doi: 10.1016/j.amjsurg.2022.01.019 [DOI] [PMC free article] [PubMed] [Google Scholar]
- 66. Cho B, Han Y, Lian M, et al. Evaluation of racial/ethnic differences in treatment and mortality among women with triple‐negative breast cancer. JAMA Oncol. 2021;7(7):1016‐1023. doi: 10.1001/jamaoncol.2021.1254 [DOI] [PMC free article] [PubMed] [Google Scholar]
- 67. Hershman D, McBride R, Jacobson JS, et al. Racial disparities in treatment and survival among women with early‐stage breast cancer. J Clin Oncol. 2005;23(27):6639‐6646. doi: 10.1200/jco.2005.12.633 [DOI] [PubMed] [Google Scholar]
- 68. Bickell NA, Wang JJ, Oluwole S, et al. Missed opportunities: racial disparities in adjuvant breast cancer treatment. J Clin Oncol. 2006;24(9):1357‐1362. doi: 10.1200/jco.2005.04.5799 [DOI] [PubMed] [Google Scholar]
- 69. Chollet‐Hinton L, Olshan AF, Nichols HB, et al. Biology and etiology of young‐onset breast cancers among premenopausal African American women: results from the AMBER Consortium. Cancer Epidemiol Biomarkers Prev. 2017;26(12):1722‐1729. doi: 10.1158/1055-9965.epi-17-0450 [DOI] [PMC free article] [PubMed] [Google Scholar]
- 70. Bertrand KA, Bethea TN, Adams‐Campbell LL, Rosenberg L, Palmer JR. Differential patterns of risk factors for early‐onset breast cancer by ER status in African American women. Cancer Epidemiol Biomarkers Prev. 2017;26(2):270‐277. doi: 10.1158/1055-9965.epi-16-0692 [DOI] [PMC free article] [PubMed] [Google Scholar]
- 71. Martinez GM. Trends and Patterns in Menarche in the United States, 1995 Through 2013‐2017. National Health Statistics Report No. 146. National Center for Health Statistics; 2020. [PubMed] [Google Scholar]
- 72. Krieger N, Kiang MV, Kosheleva A, Waterman PD, Chen JT, Beckfield J. Age at menarche: 50‐year socioeconomic trends among US‐born Black and White women. Am J Publ Health. 2015;105(2):388‐397. doi: 10.2105/ajph.2014.301936 [DOI] [PMC free article] [PubMed] [Google Scholar]
- 73. Ambrosone CB, Zirpoli G, Hong CC, et al. Important role of menarche in development of estrogen receptor‐negative breast cancer in African American women. J Natl Cancer Inst. 2015;107(9):djv172. doi: 10.1093/jnci/djv172 [DOI] [PMC free article] [PubMed] [Google Scholar]
- 74. Palmer JR, Viscidi E, Troester MA, et al. Parity, lactation, and breast cancer subtypes in African American women: results from the AMBER Consortium. J Natl Cancer Inst. 2014;106(10):dju237. doi: 10.1093/jnci/dju237 [DOI] [PMC free article] [PubMed] [Google Scholar]
- 75. Palmer JR, Ruiz‐Narvaez EA, Rotimi CN, et al. Genetic susceptibility loci for subtypes of breast cancer in an African American population. Cancer Epidemiol Biomarkers Prev. 2013;22(1):127‐134. doi: 10.1158/1055-9965.epi-12-0769 [DOI] [PMC free article] [PubMed] [Google Scholar]
- 76. Newman LA, Jenkins B, Chen Y, et al. Hereditary susceptibility for triple negative breast cancer associated with western sub‐Saharan African ancestry: results from an international surgical breast cancer collaborative. Ann Surg. 2019;270(3):484‐492. doi: 10.1097/sla.0000000000003459 [DOI] [PubMed] [Google Scholar]
- 77. Newman LA, Kaljee LM. Health disparities and triple‐negative breast cancer in African American women: a review. JAMA Surg. 2017;152(5):485‐493. doi: 10.1001/jamasurg.2017.0005 [DOI] [PubMed] [Google Scholar]
- 78. Adedokun B, Du Z, Gao G, et al. Cross‐ancestry GWAS meta‐analysis identifies six breast cancer loci in African and European ancestry women. Nat Commun. 2021;12(1):4198. [DOI] [PMC free article] [PubMed] [Google Scholar]
- 79. Barber LE, Zirpoli GR, Cozier YC, et al. Neighborhood disadvantage and individual‐level life stressors in relation to breast cancer incidence in US Black women. Breast Cancer Res. 2021;23(1):108. doi: 10.1186/s13058-021-01483-y [DOI] [PMC free article] [PubMed] [Google Scholar]
- 80. Qin B, Babel RA, Plascak JJ, et al. Neighborhood social environmental factors and breast cancer subtypes among Black women. Cancer Epidemiol Biomarkers Prev. 2021;30(2):344‐350. doi: 10.1158/1055-9965.epi-20-1055 [DOI] [PMC free article] [PubMed] [Google Scholar]
- 81. Linnenbringer E, Geronimus AT, Davis KL, Bound J, Ellis L, Gomez SL. Associations between breast cancer subtype and neighborhood socioeconomic and racial composition among Black and White women. Breast Cancer Res Treat. 2020;180(2):437‐447. doi: 10.1007/s10549-020-05545-1 [DOI] [PMC free article] [PubMed] [Google Scholar]
- 82. Krieger N, Singh N, Waterman PD. Metrics for monitoring cancer inequities: residential segregation, the Index of Concentration at the Extremes (ICE), and breast cancer estrogen receptor status (USA, 1992‐2012). Cancer Causes Control. 2016;27(9):1139‐1151. doi: 10.1007/s10552-016-0793-7 [DOI] [PubMed] [Google Scholar]
- 83. Krieger N, Jahn JL, Waterman PD. Jim Crow and estrogen‐receptor‐negative breast cancer: US‐born Black and White non‐Hispanic women, 1992‐2012. Cancer Causes Control. 2017;28(1):49‐59. doi: 10.1007/s10552-016-0834-2 [DOI] [PubMed] [Google Scholar]
- 84. Eldridge L, Berrigan D. Structural racism and triple‐negative breast cancer among black and white women in the United States. Health Equity. 2022;6(1):116‐123. doi: 10.1089/heq.2021.0041 [DOI] [PMC free article] [PubMed] [Google Scholar]
- 85. Henley SJ, Thomas CC, Lewis DR, et al. Annual report to the nation on the status of cancer, part II: progress toward Healthy People 2020 objectives for 4 common cancers. Cancer. 2020;126(10):2250‐2266. doi: 10.1002/cncr.32801 [DOI] [PMC free article] [PubMed] [Google Scholar]
- 86. Lim H, Devesa SS, Sosa JA, Check D, Kitahara CM. Trends in thyroid cancer incidence and mortality in the United States, 1974‐2013. JAMA. 2017;317(13):1338‐1348. doi: 10.1001/jama.2017.2719 [DOI] [PMC free article] [PubMed] [Google Scholar]
- 87. Kitahara CM, Sosa JA. Understanding the ever‐changing incidence of thyroid cancer. Nat Rev Endocrinol. 2020;16(11):617‐618. doi: 10.1038/s41574-020-00414-9 [DOI] [PMC free article] [PubMed] [Google Scholar]
- 88. Kitahara CM, Pfeiffer RM, Sosa JA, Shiels MS. Impact of overweight and obesity on US papillary thyroid cancer incidence trends (1995‐2015). J Natl Cancer Inst. 2020;112(8):810‐817. doi: 10.1093/jnci/djz202 [DOI] [PMC free article] [PubMed] [Google Scholar]
- 89. US Preventive Services Task Force . Screening for prostate cancer: US Preventive Services Task Force recommendation statement. Ann Intern Med. 2008;149(3):185‐191. doi: 10.7326/0003-4819-149-3-200808050-00008 [DOI] [PubMed] [Google Scholar]
- 90. Moyer VA, US Preventive Services Task Force . Screening for prostate cancer: US Preventive Services Task Force recommendation statement. Ann Intern Med. 2012;157(2):120‐134. doi: 10.7326/0003-4819-157-2-201207170-00459 [DOI] [PubMed] [Google Scholar]
- 91. Jiang C, Fedewa SA, Wen Y, Jemal A, Han X. Shared decision making and prostate‐specific antigen based prostate cancer screening following the 2018 update of USPSTF screening guideline. Prostate Cancer Prostatic Dis. 2021;24(1):77‐80. doi: 10.1038/s41391-020-0227-1 [DOI] [PubMed] [Google Scholar]
- 92. Jemal A, Culp MB, Ma J, Islami F, Fedewa SA. Prostate cancer incidence 5 years after US Preventive Services Task Force recommendations against screening. J Natl Cancer Inst. 2021;113(1):64‐71. doi: 10.1093/jnci/djaa068 [DOI] [PMC free article] [PubMed] [Google Scholar]
- 93. Ogden CL, Fryar CD, Martin CB, et al. Trends in obesity prevalence by race and Hispanic origin—1999‐2000 to 2017‐2018. JAMA. 2020;324(12):1208‐1210. doi: 10.1001/jama.2020.14590 [DOI] [PMC free article] [PubMed] [Google Scholar]
- 94. Efstathiou JA, Bae K, Wu S, et al. Obesity and mortality in men with locally advanced prostate cancer: analysis of RTOG 85‐31. Cancer. 2007;110(12):2691‐2699. doi: 10.1002/cncr.23093 [DOI] [PMC free article] [PubMed] [Google Scholar]
- 95. Allott EH, Masko EM, Freedland SJ. Obesity and prostate cancer: weighing the evidence. Eur Urol. 2013;63(5):800‐809. doi: 10.1016/j.eururo.2012.11.013 [DOI] [PMC free article] [PubMed] [Google Scholar]
- 96. US Preventive Services Task Force . Screening for prostate cancer: US Preventive Services Task Force recommendation statement. JAMA. 2018;319(18):1901‐1913. [DOI] [PubMed] [Google Scholar]
- 97. Islami F, Ward EM, Sung H, et al. Annual report to the nation on the status of cancer, part 1: national cancer statistics. J Natl Cancer Inst. 2021;113(12):1648‐1669. doi: 10.1093/jnci/djab131 [DOI] [PMC free article] [PubMed] [Google Scholar]
- 98. Paulson KG, Gupta D, Kim TS, et al. Age‐specific incidence of melanoma in the United States. JAMA Dermatol. 2020;156(1):57‐64. doi: 10.1001/jamadermatol.2019.3353 [DOI] [PMC free article] [PubMed] [Google Scholar]
- 99. Hashibe M, Sturgis EM, Ferlay J, Winn DM. Oral cavity, oropharynx, lip, and salivary glands. In: Thun MJ, Linet MS, Cerhan JR, Haiman CA, Schottenfeld D, eds. Schottenfeld and Fraumeni Cancer Epidemiology and Prevention. 4th ed. Chapter 29. Oxford University Press; 2017:543‐578. [Google Scholar]
- 100. Ellington TD, Henley SJ, Senkomago V, et al. Trends in incidence of cancers of the oral cavity and pharynx, United States 2007‐2016. MMWR Morb Mortal Wkly Rep. 2020;69(15):433‐438. doi: 10.15585/mmwr.mm6915a1 [DOI] [PMC free article] [PubMed] [Google Scholar]
- 101. Sturgis EM, Cinciripini PM. Trends in head and neck cancer incidence in relation to smoking prevalence: an emerging epidemic of human papillomavirus‐associated cancers? Cancer. 2007;110(7):1429‐1435. doi: 10.1002/cncr.22963 [DOI] [PubMed] [Google Scholar]
- 102. Espey DK, Jim MA, Richards TB, Begay C, Haverkamp D, Roberts D. Methods for improving the quality and completeness of mortality data for American Indians and Alaska Natives. Am J Publ Health. 2014;104(suppl 3):S286‐S294. doi: 10.2105/ajph.2013.301716 [DOI] [PMC free article] [PubMed] [Google Scholar]
- 103. Arias E, Xu J, Curtin S, Bastian B, Tejada‐Vera B. Mortality profile of the non‐Hispanic American Indian or Alaska Native population, 2019. Natl Vital Stat Rep. 2021;70(12):1‐27. [PubMed] [Google Scholar]
- 104. Liebler CA, Porter SR, Fernandez LE, Noon JM, Ennis SR. America’s churning races: race and ethnicity response changes between census 2000 and the 2010 census. Demography. 2017;54(1):259‐284. doi: 10.1007/s13524-016-0544-0 [DOI] [PMC free article] [PubMed] [Google Scholar]
- 105. Rios M, Romero F, Ramirez R. Race Reporting Among Hispanics: 2010. Working Paper No. 102. Population Division, US Bureau of the Census; 2014. Accessed February 1, 2022. https://census/gov/library/working‐papers/2014/demo/POP‐twps0102.html
- 106. Ramirez R, Borman C. How we complete the census when demographic and housing characteristics are missing. US Bureau of the Census; 2021. Accessed February 1, 2022. https://census.gov/newsroom/blogs/random‐samplings/2021/08/census‐when‐demographic‐and‐housing‐characteristics‐are‐missing.html [Google Scholar]
- 107. Edwards BK, Noone AM, Mariotto AB, et al. Annual report to the nation on the status of cancer, 1975‐2010, featuring prevalence of comorbidity and impact on survival among persons with lung, colorectal, breast, or prostate cancer. Cancer. 2014;120(9):1290‐1314. doi: 10.1002/cncr.28509 [DOI] [PMC free article] [PubMed] [Google Scholar]
- 108. Arias E, Heron MP, Hakes JK. The validity of race and Hispanic origin reporting on death certificates in the United States: an update. Vital Health Stat. 2016;172:1‐21. [PubMed] [Google Scholar]
- 109. Altekruse SF, Cosgrove C, Cronin K, Yu M. Comparing cancer registry abstracted and self‐reported data on race and ethnicity. J Registry Manag. 2017;44(1):30‐33. [PubMed] [Google Scholar]
- 110. Jim MA, Arias E, Seneca DS, et al. Racial misclassification of American Indians and Alaska Natives by Indian Health Service Contract Health Service Delivery Area. Am J Publ Health. 2014;104(suppl 3):S295‐S302. doi: 10.2105/ajph.2014.301933 [DOI] [PMC free article] [PubMed] [Google Scholar]
Associated Data
This section collects any data citations, data availability statements, or supplementary materials included in this article.
Supplementary Materials
Table S1
Table S2