Abstract
Here we report the fabrication of a noncontact pulse oximeter system based on a dual-wavelength imaging system and its oxygen saturation monitoring performance during wound healing. The dual-wavelength imaging system consists of 660 nm and 940 nm light-emitting diodes and a multi-spectral camera that simultaneously accepts visible and near-infrared images. Using the proposed system, images were acquired at 30 fps at both wavelengths, and photoplethysmography signals were extracted by specifying a specific region in the images. We removed the signals caused by small movements and smoothed them using the discrete wavelet transform and moving average filter. To confirm the feasibility of the proposed noncontact oxygen saturation system, a wound model was created using a hairless mouse and oxygen saturation was measured during wound healing. The measured values were compared and analyzed using a reflective animal pulse oximeter. Through a comparative analysis of these two devices, the error of the proposed system was evaluated and the possibility of its clinical application and wound healing monitoring through oxygen saturation measurement confirmed.
Keywords: Photoplethysmography, Non-contact measurement, Camera-based, Oxygen saturation, Wound healing
Introduction
Oxygen saturation, which represents the ratio of oxygen-saturated hemoglobin to total hemoglobin in the blood, is typically 95–100% in normal human arterial blood. The human body requires and regulates a precise oxygen balance in the blood. Monitoring is essential as its imbalance can cause many acute side effects in organs such as the brain, heart, and kidneys [1].
Because of the importance of monitoring oxygen saturation, as described above, many research groups have monitored oxygen saturation using invasive and non-invasive methods. A representative test of an invasive method is the arterial blood gas (ABG) test. This is a highly accurate method for testing oxygen saturation using phlebotomy for blood gas analysis in the intensive care unit. However, it causes a large amount of blood loss due to phlebotomy, which can cause anemia [2]. It is also difficult to continuously monitor oxygen saturation because of the high cost and risk of sample contamination. To solve this problem, the pulse oximetry method, is a non-invasive method used by many research groups. Pulse oximetry is a method of measuring oxygen saturation based on the difference in absorbance between two wavelengths using light at 660 nm, the absorption wavelength of deoxyhemoglobin, and 940 nm, the absorption wavelength of oxyhemoglobin [3]. The pulse oximetry method reportedly shows a high correlation with the ABG test method in the range of 70–100% oxygen saturation [4]. Therefore, the pulse oximetry method, which is highly accurate and easy to perform, is preferred. Recently, with the commercialization of a pulse oximeter consisting of red and infrared light-emitting diodes (LEDs) and a photodetector to lower the manufacturing cost, the oximeter has become a successfully commercialized model of a representative optical medical device. However, the recent coronavirus disease 2020 (COVID-19) pandemic has resulted in many changes to medical devices. Oxygen saturation may drop sharply when COVID-19 is also present; therefore, measuring oxygen saturation has become important [5, 6]. However, because most pulse oximeters are the contact type and multiple people use the same machine, there is a risk of cross-contamination. In addition, patients in the intensive care unit, those with trembling hands and feet, and those with difficult-to-contact skin such as in cases of burns are at risk of infection, making it difficult to monitor using a contact oxygen saturation measuring device [7]. Therefore, a non-invasive and noncontact method for measuring oxygen saturation has been proposed as a new solution, and several groups have been examining bio-signal analyses using image-based photoplethysmography (PPG).
PPG detection using an image is similar to a reflective pulse oximeter and has the advantage of noncontact measurement of bio-signals such as heart rate, heart rate variability, oxygen saturation, and blood pressure [8, 9]. As a representative method for measuring oxygen saturation using a camera, a method for tracking changes in oxygen saturation using blue and red wavelengths with two camera channels or polarization properties has been proposed [10–12]. However, this method uses wavelengths in the visible light region that limit the penetration depth or affect the measurement of oxygen saturation by melanin concentration in the skin [13]. In particular, blue and green wavelengths are scattered in the upper dermal layers; thus, its penetration depth is limited. To solve this problem, several research groups have conducted studies using red and near-infrared wavelengths. As the red wavelength reaches the subdermal tissue, the camera can detect photons that return after sufficient interaction with arterial, venous, and capillary blood [14]. In addition, the near-infrared spectrum does not affect the PPG signal because skin reflectance, according to the melanin content of skin, is relatively constant [15]. Accordingly, research groups have employed two methods using red and near-infrared wavelengths. One group triggered two light sources and used one camera to measure oxygen saturation, while the other used two identical camera modules and different filters to measure oxygen saturation. In the first method, an error may be caused by triggering the light source; the frame rate is reduced by half, and low quantum efficiency in near-infrared light can be a problem because the camera operates in the visible light range. The second method may also cause measurement errors because of the quantum efficiency problem caused by using a camera in the visible light region as well as the angle difference between the two cameras [7, 16, 17]. Therefore, new methods are needed to reduce these errors.
Here we report a system that can measure oxygen saturation by simultaneously acquiring red and near-infrared wavelength images at the same location and on the same path in a noncontact manner. The proposed method simultaneously acquires two wavelength images in the same path using a multi-spectral camera that includes two camera sensors with high quantum efficiencies in the visible and near-infrared regions. After removal of the noise via extraction of the sinusoidal PPG signal from the images obtained from the two cameras, the oxygen saturation was calculated using the pulsatile and non-pulsatile component signals. To confirm the performance of the proposed system, a wound model was created using a hairless mouse and the results of the proposed imaging technique compared with those of an existing reflective pulse oximeter for animals. The potential of the proposed technology as a noncontact bio-signal measuring device was confirmed via these experimental results.
Experimental setup
Dual-wavelength simultaneous acquisition imaging system for oxygen saturation measurement
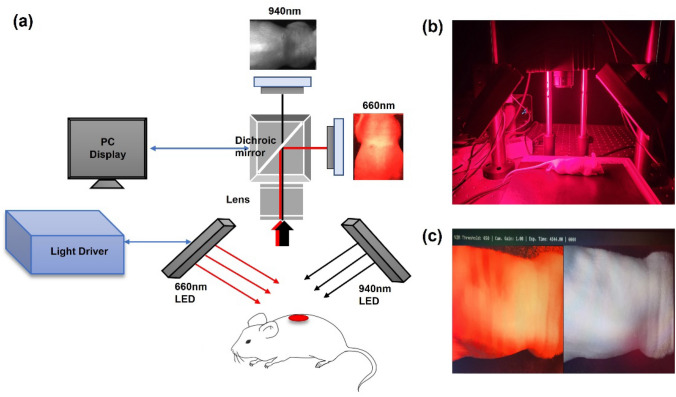
Figure 1 shows a schematic of the dual-wavelength simultaneous acquisition imaging system used in this study. Two wavelengths were used to obtain oxygen saturation based on the acquired image: 660 and 940 nm, respectively, which are commonly used for oxygen saturation measurements. First, LEDs were used as light sources. The light source used in this experiment was manufactured by connecting eighty-one 660 nm LEDs (5050FRC-66L/14; Best LED Opto-electronic, Guangdong, China) and eighty-one 940 nm LEDs (050IRC-94L; Best LED Opto-electronic, Guangdong, China); the light source driver was manufactured so the appropriate optical power could be controlled. To acquire images at the two wavelengths, a multi-spectral camera (FS-1600D-10GE; JAI, Miyazaki, Japan) composed of an optical system (Fig. 1a) was used. This camera consists of a dichroic mirror that can separate visible and near-infrared light and two camera sensors that acquire visible and near-infrared light images. A lens (67714; Edmund Optics, New Jersey, U.S.) was used to focus the sample in front of the camera; the focal length of the sample was approximately 16 cm. As shown in Fig. 1b, the light source was arranged at a 45-degree angle and a camera with a lens was placed in the middle to acquire visible and near-infrared light images of the sample. The light sources of the two wavelengths were separated into visible light and near-infrared light through a dichroic mirror, and the images were acquired using two camera sensors. The acquired two-wavelength image was stored on a computer using a frame grabber. Figure 1c shows a self-produced graphical user interface, which displays images collected at 660 nm and 940 nm. The left and right images in Fig. 1c are acquired from visible light and near-infrared, respectively. The image acquisition speed was 30 fps, which was sufficient to detect a maximum heart rate of 7.5 Hz in anesthetized mice and a maximum heart rate of 3.3 Hz in humans.
Fig. 1.
a Schematic diagram of the dual-wavelength simultaneous acquisition imaging system setup for oxygen saturation measurement. b The light source was arranged at a 45-degree angle and a camera including a lens was placed in the middle in the actual experimental setup. c Graphic user interface for image output
Designing an animal experimental model
In general, because acute hypoxia is an essential process for wound healing, oxygen saturation at the wound site decreases in the early stages of wound healing and increases as the wound heals. Therefore, to confirm the performance of the proposed system, a mouse model was selected because its wound healing properties are similar to those of humans [18, 19]. Seven-week-old hairless mice (SKH1-hr; Orientbio, Seongnam, Korea) weighing 24–31 g were used in our experiment. The animal experiments were conducted in compliance with the standard operating guidelines of the Institutional Animal Care and Use Committee (IACUC) of the Ministry of Food and Drug Safety and approved by the Experimental Animal Steering Committee of Dankook University. Anesthesia was induced using a mixture of Zoletil 50 (30 mg/kg; tiletamine + zolazepam) and Rompun (10 mg/kg; xylazine). Using an 8 mm disposable biopsy punch (BP-80F; KAI Medical, Gifu, Japan) on the back of the mouse, symmetrical wounds were made on both sides with respect to the spine. Five replicates were analyzed in the same manner. The injured mice were transferred to individual cages to prevent infection at the wound site, and no additional treatment was administered for healing. To obtain data from the proposed noncontact system, the mice were anesthetized and images acquired at regular intervals for 13 days. In addition, an animal pulse oximeter (2500A VET; NONIN, Plymouth, UK) equipped with a transflectance sensor (2000T; NONIN, Plymouth, UK) was used to estimate the reference value of oxygen saturation at the wound site and compare and evaluate the oxygen saturation of the fabricated system. The source and sensor were 6 mm apart on the same side of the animal pulse oximeter. The oxygen saturation was measured by touching the wound model with the sensor. It can detect diffuse light brought on by hemodynamic changes.
Method
Figure 2 shows a block diagram of the measurement process of the oxygen saturation using images of two wavelengths acquired from a dual-wavelength simultaneous acquisition imaging system.
Fig. 2.
Block diagram of the measurement process of oxygen saturation using images of two wavelengths acquired from the dual-wavelength simultaneous acquisition imaging system
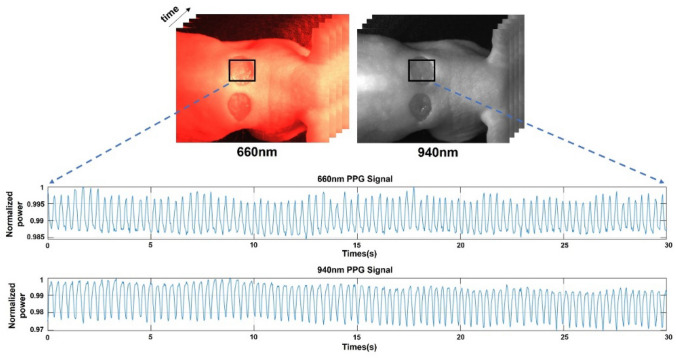
Using the prepared mouse model and dual-wavelength simultaneous acquisition imaging system, images were acquired at 660 nm and 940 nm at a rate of 30 fps for approximately 30 s. The resolution of each image was 1440 × 1080 pixels. To extract the PPG signal from the images obtained over time, a region of interest (ROI) was set to enter the wound area. The intensity was then set by averaging all pixel values constituting the ROI. As the amount of light absorbed by the blood depends on blood flow, the intensity changes over time. The raw PPG signal in sinusoidal form (Fig. 3) was extracted by plotting the change in the average intensity of the ROI in the acquired image over time.
Fig. 3.
Extraction of raw photoplethysmography (PPG) signals corresponding to the 660 nm and 940 nm wavelengths for about 30 s from the region of interest of the mouse model
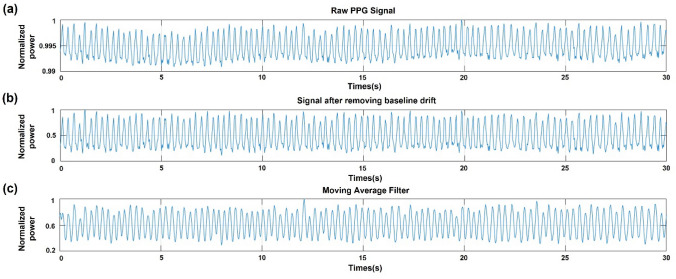
Although the mice were anesthetized, small movements and muscle tremors can cause baseline drift in the low-frequency region (< 1 Hz) of the raw PPG signal. Therefore, to remove this part of the raw PPG signal, a removal method through wavelet analysis was used. Wavelet analysis is a signal-processing technique that is widely used to remove noise from signals because all signal information can be used in the time–frequency space. Among these methods, the discrete wavelet transform (DWT) is applied to remove the baseline drift that appears in the original signal and functions as a high- and low-pass filter. Therefore, using this method, PPG signals can be obtained without noise owing to movement and muscle tremors (Fig. 4b). To smooth the signal obtained through the DWT analysis, we used a moving average filter. This signal uses the number of previous data points and averages them over time to calculate the average value. Therefore, as the number of points in the previous data increased, the smoothness increased, reducing the abrupt data modulation. Therefore, in this study, a moving average filter averaging five previous data points, including the current data, was used to reduce abrupt changes in the PPG signal (Fig. 4c). The DWT analysis and smoothing of the resulting signals were performed using MATLAB [20–25].
Fig. 4.
Preprocessing of the raw PPG signal to remove noise. a Raw PPG signal with noise caused by small movements and muscle tremors. b Signal after removing baseline drift using discrete wavelet transform (DWT). c Signal after moving average filter to smooth the signal
The oxygen saturation value was calculated using a signal smoothed through a moving average filter. Existing pulse oximeters measure arterial oxygen saturation (SpO2) based on the differential absorption of light by oxyhemoglobin and deoxyhemoglobin, and the wavelengths of this differential absorption use 660 nm (λ1), which corresponds to red light, and 940 nm (λ2), which is near-infrared light. According to the pulse oximetry, the pulsatile (AC) component of light absorption is derived from pulsatile arterial blood, whereas the non-pulsatile (DC) component is derived from quiescent arteries, veins, and other tissues. The pulsatile signal for each wavelength can be normalized to the non-pulsatile signal, yielding the pulsatile absorbance [26]. Equations (1) and (2) define the pulsatile absorbance at these two wavelengths.
| 1 |
| 2 |
For images obtained for 30 s at a camera speed of 30 fps, is the standard deviation value for the intensity and is the average intensity value [27]. The ratio of absorbance at two wavelengths can be defined as the ratio as follows.
| 3 |
The arterial oxygen saturation was assumed to follow the second-order equation. The equation is based on the normalized ratio of ratios value () as in Eq. (4):
| 4 |
where , , and are best filter coefficients obtained by fitting a second-order polynomial to a graph of measured by the proposed system and the measured SpO2 by the commercial animal pulse oximeter.
Results
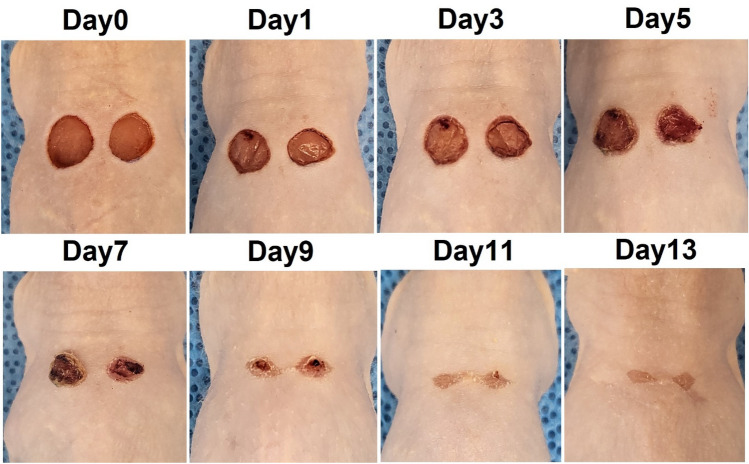
We used a mouse model to verify the proposed system and compared it with a commercial animal pulse oximeter. In this experiment, two wounds were created on the backs of the mice using a biopsy punch, and oxygen saturation was measured to detect changes in the wound during the healing process for 13 days. Five hairless mice were used to confirm reproducibility of the experiment. Figure 5 shows images of hairless mice used in the experiment for 13 days from wound induction to recovery. When the wound was induced using a biopsy punch, an incision was made in the thin muscle layer under the skin and slight bleeding occurred. After first day, the wound surface had dried and a crust of dried blood was observed around the wound. From the third day after the wound, yellow scabs began to form on the wound; on the fifth day, the entire wound surface was covered with scabs. From the seventh day, the area of the wound area decreased, and the scab began to fall off. In this experiment, the wounds recovered naturally without drug treatment. Changes in oxygen saturation were measured during the entire wound healing process in the mouse model. For the reference values, a commercially available reflective oxygen saturation pulse oximeter was placed on the mouse wound and measured. In this process, the measurement was performed after anesthesia because contact with the wound site was required. Figure 6 shows the oxygen saturation changes measured using the animal pulse oximeter from the occurrence of the wound to the complete recovery of the wound. In the early stages of wound healing, oxygen saturation drops to a maximum of 85% and the wound remains hypoxic. As wound healing progressed, oxygen saturation increased and was maintained within the normal range of 95–100% at the end of the wound healing process.
Fig. 5.
Wound healing process in mouse model from wound induction to recovery over 13 days
Fig. 6.
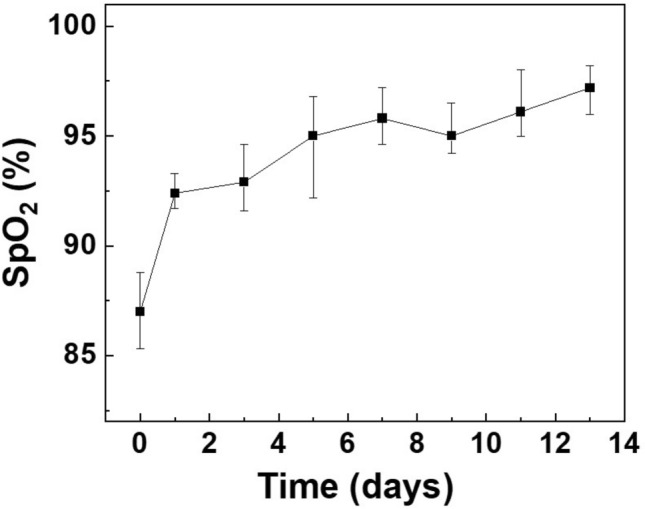
Changes in oxygen saturation (SpO2) measured with the animal pulse oximeter from wound induction to complete healing over 13 days
Images for calculating the oxygen saturation were simultaneously acquired using the proposed system. A total of 900 images were simultaneously acquired over 30 s at a camera speed of 30 fps for each wavelength. For each image, an ROI was set at the wound area to measure the average intensity, and a graph of the intensity change over time was created for each image at each time point (Fig. 4a). For the intensity signal over time, the DWT method was used to remove baseline changes caused by small movements or muscle tremors, and rapid changes were smoothed using a moving average filter. The intensity average and standard deviation at each wavelength were obtained through the hourly intensity data obtained through this process; finally, the value was measured.
Figure 7 shows the second-order polynomial fitting curve of oxygen saturation for wound healing in the mouse model. After wounds occur, the oxygen saturation is restored as the wound heals from a low oxygen saturation state. The y-axis represents the values measured by the commercial animal pulse oximeter, and the x-axis represents the value measured by the dual-wavelength simultaneous acquisition imaging system presented in this study. A second-order polynomial curve fitting is then performed to confirm the correlation between the values obtained using the proposed system and the animal pulse oximeter. The red solid line in Fig. 7 shows the SpO2 calibration curves fitted for the two different measurement methods. The best filter coefficients, , , and are identified for the second-order polynomial. Substituting the values of , , and obtained through this process into Eq. (4) yields the following SpO2 calculation model:
| 5 |
Fig. 7.
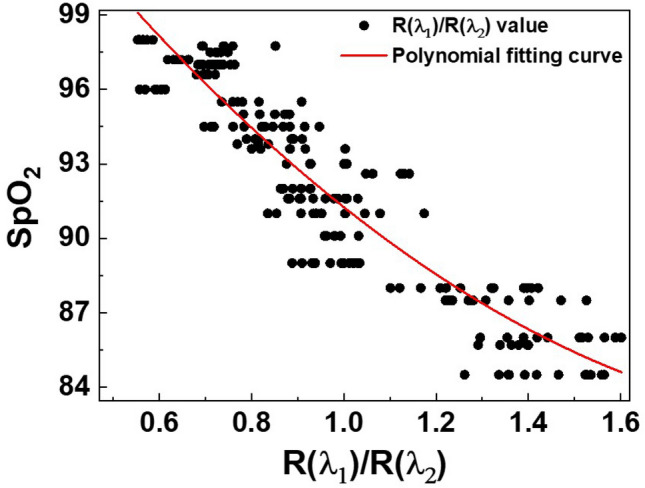
Second-order polynomial fitting curve of the oxygen saturation (SpO2) values measured by the animal pulse oximeter and values measured by the dual-wavelength simultaneous acquisition imaging system
The accuracy of the oxygen saturation values calculated using the proposed dual-wavelength simultaneous acquisition oxygen saturation measurement system is then evaluated based on the root mean square error (RMSE) between the oxygen saturation values measured using a commercial animal pulse oximeter:
| 6 |
where n represents the number of measurements from injury to recovery, is the oxygen saturation value calculated using the proposed system, and is the value measured using a commercial animal pulse oximeter. The RMSE of total oxygen saturation measured using the proposed system was 1.49. Table 1 shows the RMSE values of according to recovery after injury; relatively similar RMSE values were obtained from the initial wound stage to recovery. Figure 8 shows a Bland–Altman plot, a tool for visualizing the differences between two different measurement methods [28]. This agreement can be analyzed by quantifying the differences between the measurements. The x-axis of the plot shows the average of the measurements and the y-axis shows the difference between the measurements of the two measurement methods. The horizontal center line of the plot represents the average difference in measurements between the two methods; the value was − 0.00467. The upper and lower lines of the plot represent the 95% confidence intervals. The 95% confidence interval is calculated by average ± 1.96 × SD, where average and SD are the average and the standard deviation of the differences of the measurements. The lower and upper limits of the 95% confidence interval were − 2.9407 and 2.9313, respectively. Most measurements were within the 95% confidence interval, indicating that the measured values of our proposed system were similar to those of the commercial animal pulse oximeter.
Table 1.
Root mean square error (RMSE) of oxygen saturation values obtained from the proposed system at the early (Days 0–2), middle (Days 3–5), and late (Days 6–13) wound healing stages
| Days (SpO2 (%)) | RMSE |
|---|---|
| 0–2 (85 ≤ SpO2 ≤ 91) | 1.59 |
| 3–5 (91 < SpO2 ≤ 95) | 1.35 |
| 6–13 (95 < SpO2) | 1.48 |
| Total | 1.49 |
Fig. 8.
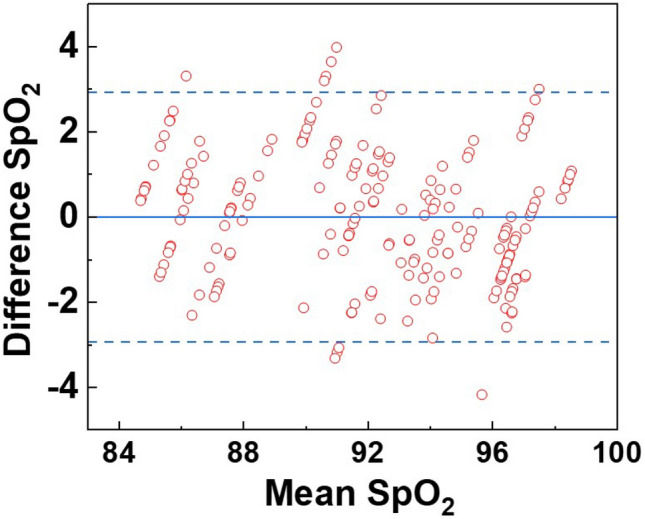
Bland–Altman plot of reference SpO2 values acquired by the animal pulse oximeter and estimated SpO2 values acquired by the dual-wavelength simultaneous acquisition imaging system. The horizontal center line of the plot represents the average measurement difference between the two methods, while the upper and lower plot lines represent the 95% confidence interval
Discussion and conclusion
Here we presented a dual-wavelength simultaneous acquisition imaging system for oxygen saturation measurements using a multi-spectral camera and used it to measure changes in oxygen saturation during wound healing. In this system, the lighting was built using 660 nm and 940 nm LEDs, and drivers with adjustable light outputs were included. In addition, images were acquired simultaneously using multi-spectral camera at an image-acquisition speed of 30 fps. We acquired raw PPG signals by acquiring images at two wavelengths over 30 s and used DWT analysis to remove small movements and muscle tremors from the raw PPG signals. The signal was then smoothed using a moving average filter.
To verify the proposed dual-wavelength simultaneous acquisition imaging system, a wound model was created using hairless mice to measure changes in oxygen saturation during wound healing. Two wounds were created on the back of each mouse using a biopsy punch, and the measurement data of the proposed system were compared with those of a commercially available animal oxygen saturation measurement device for a 13-day recovery period. We created wound models for five hairless mice and measured and compared them using a commercial reflective-type pulse oximeter. The system proposed here consisted of five repeated experiments for each measurement. The RMSE value was calculated using these two datasets; that for the proposed system was approximately 1.49. This value satisfied the clinical criteria for pulse oximetry, and most of the measured values were within the 95% confidence interval of the Bland–Altman plot. Therefore, the measured oxygen saturation values obtained using the proposed dual-wavelength simultaneous image acquisition system closely matched the measured values of the animal pulse oximeter.
In addition, using the proposed system, this study confirmed through measurement data that oxygen saturation was significantly lowered immediately after wounding and gradually recovered the oxygen saturation during the wound healing period. This indicated that the wound healing process from hypoxia to normoxia after wounding could be predicted by measuring oxygen saturation. The measurement error in the low oxygen saturation state immediately after wounding was larger than that in the stable state. This result is similar to the large error in the commercial pulse oximeter for animals at low oxygen saturation. The increase in error between wound healing Days 6 and 13 was considered caused by the scattering of light by the scabs formed during healing. In order to reduce this error due to surface scattering, a polarization gating technique can be included to improve our system's accuracy. It is expected to block the scattering of light by the scabs, including specular reflection. We used a reflective-type pulse oximeter to measure the animal wounds. Because the measurement error of the reflective oxygen saturation measurement device for animals was somewhat larger than that of the transmission type, it was difficult to accurately compare the errors of the proposed system. If the stability of this system is secured and its accuracy verified through a comparative analysis with more accurate measuring devices in clinical trials, it suggests that oxygen saturation monitoring is possible during wound healing. Further, the proposed system is expected to garner increasing attention as a noncontact bio-signal measuring device in the infection era. It can also be applied to patients with wounds, burns, and pressure ulcers, enabling noncontact monitoring of severely ill patients.
Funding
This research was supported by the Basic Science Research Program through the National Research Foundation of Korea (NRF) funded by the Ministry of Education (2021R1I1A306102512); a Korea Medical Device Development Fund grant provided by the Korea government (the Ministry of Science and ICT, the Ministry of Trade, Industry and Energy, the Ministry of Health & Welfare, the Ministry of Food and Drug Safety) (Project No. 1711174973, RS-2022–00166898); and the research fund of Dankook University in 2020.
Declarations
Conflict of interest
The authors declare no conflicts of interest.
Ethical approval
Approval was granted by the Experimental Animal Steering Committee of Dankook University.
Footnotes
Publisher's Note
Springer Nature remains neutral with regard to jurisdictional claims in published maps and institutional affiliations.
References
- 1.Hafen BB, Sharma S. Oxygen saturation. Treasure Island (FL): StatPearls Publishing; 2022. [PubMed] [Google Scholar]
- 2.Andrews T, Waterman H, Hillier V. Blood gas analysis: a study of blood loss in intensive care. J Adv Nurs. 1999;30(4):851–857. doi: 10.1046/j.1365-2648.1999.01155.x. [DOI] [PubMed] [Google Scholar]
- 3.Mendelson Y. Pulse oximetry: theory and applications for noninvasive monitoring. Clin Chem. 1992;38(9):1601–1607. doi: 10.1093/clinchem/38.9.1601. [DOI] [PubMed] [Google Scholar]
- 4.Jensen LA, Onyskiw JE, Prasad N. Meta-analysis of arterial oxygen saturation monitoring by pulse oximetry in adults. Heart Lung. 1998;27(6):387–408. doi: 10.1016/S0147-9563(98)90086-3. [DOI] [PubMed] [Google Scholar]
- 5.O'Carroll O, MacCann R, O'Reilly A, Dunican EM, Feeney ER, Ryan S, et al. Remote monitoring of oxygen saturation in individuals with COVID-19 pneumonia. Eur Respir J. 2020;56(2):2001492. doi: 10.1183/13993003.01492-2020. [DOI] [PMC free article] [PubMed] [Google Scholar]
- 6.Al-Naji A, Khalid GA, Mahdi JF, Chahl J. Noncontact SpO2 prediction system based on a digital camera. Appl Sci. 2021;11(9):4255. doi: 10.3390/app11094255. [DOI] [Google Scholar]
- 7.Kong L, Zhao Y, Dong L, Jian Y, Jin X, Li B, et al. Noncontact detection of oxygen saturation based on visible light imaging device using ambient light. Opt Express. 2013;21(15):17464–17471. doi: 10.1364/OE.21.017464. [DOI] [PubMed] [Google Scholar]
- 8.Tamura T. Current progress of photoplethysmography and SpO2 for health monitoring. Biomed Eng Lett. 2019;9(1):21–36. doi: 10.1007/s13534-019-00097-w. [DOI] [PMC free article] [PubMed] [Google Scholar]
- 9.Longmore SK, Lui GY, Naik G, Breen PP, Jalaludin B, Gargiulo GD. A comparison of reflective photoplethysmography for detection of heart rate, blood oxygen saturation, and respiration rate at various anatomical locations. Sensors. 2019;19(8):1874. doi: 10.3390/s19081874. [DOI] [PMC free article] [PubMed] [Google Scholar]
- 10.Guazzi AR, Villarroel M, Jorge J, Daly J, Frise MC, Robbins PA, et al. Noncontact measurement of oxygen saturation with an RGB camera. Biomed Opt Express. 2015;6(9):3320–3338. doi: 10.1364/BOE.6.003320. [DOI] [PMC free article] [PubMed] [Google Scholar]
- 11.Mishra D, Chandra S, Chandra A, Jain S, Sarkar M. A portable system for real-time noncontact blood oxygen saturation measurements. 2017 IEEE Biomedical Circuits and Systems Conference (BioCAS) (pp. 1–4). 10.1109/BIOCAS.2017.8325137
- 12.Arimoto H. Multispectral polarization imaging for observing blood oxygen saturation in skin tissue. Appl Spectrosc. 2006;60(4):459–464. doi: 10.1366/000370206776593672. [DOI] [PubMed] [Google Scholar]
- 13.Yesman SS, Mamilov SO, Veligotsky DV, Gisbrecht AI. Local changes in arterial oxygen saturation induced by visible and near-infrared light radiation. Lasers Med Sci. 2016;31(1):145–149. doi: 10.1007/s10103-015-1838-y. [DOI] [PubMed] [Google Scholar]
- 14.Moço A, Verkruysse W. Pulse oximetry based on photoplethysmography imaging with red and green light: calibratability and challenges. J Clin Monit Comput. 2021;35(1):123–133. doi: 10.1007/s10877-019-00449-y. [DOI] [PubMed] [Google Scholar]
- 15.Gastel M, Stuijk S, Haan G. New principle for measuring arterial blood oxygenation, enabling motion-robust remote monitoring. Sci Rep. 2016;6:38609. doi: 10.1038/srep38609. [DOI] [PMC free article] [PubMed] [Google Scholar]
- 16.Shao D, Liu C, Tsow F, Yang Y, Du Z, Iriya R, et al. Noncontact monitoring of blood oxygen saturation using camera and dual-wavelength imaging system. IEEE Trans Biomed Eng. 2016;63(6):1091–1098. doi: 10.1109/TBME.2015.2481896. [DOI] [PubMed] [Google Scholar]
- 17.Rahman H, Ahmed MU, Begum S. Noncontact physiological parameters extraction using facial video considering illumination, motion, movement and vibration. IEEE Trans Biomed Eng. 2020;67(1):88–98. doi: 10.1109/TBME.2019.2908349. [DOI] [PubMed] [Google Scholar]
- 18.Hong WX, Hu MS, Esquivel M, Liang GY, Rennert RC, McArdle A, et al. The role of hypoxia-inducible factor in wound healing. Adv Wound Care (New Rochelle) 2014;3(5):390–399. doi: 10.1089/wound.2013.0520. [DOI] [PMC free article] [PubMed] [Google Scholar]
- 19.Lokmic Z, Musyoka J, Hewitson TD, Darby IA. Hypoxia and hypoxia signaling in tissue repair and fibrosis. Int Rev Cell Mol Biol. 2012;296:139–185. doi: 10.1016/B978-0-12-394307-1.00003-5. [DOI] [PubMed] [Google Scholar]
- 20.Campbell JD, Pretty CG, Chase JG, Bones PJ. Near-real-time detection of pulse oximeter PPG peaks using wavelet decomposition. IFAC-PapersOnLine. 2018;51(27):146–151. doi: 10.1016/j.ifacol.2018.11.652. [DOI] [Google Scholar]
- 21.Nguyen TN. An algorithm for extracting the PPG baseline drift in real-time. Joondalup: Edith Cowan University; 2016. [Google Scholar]
- 22.Yoo Y, Lee M, Lee T, Kim S, Kim HS. Decomposition of wave components in sea level data using discrete wavelet transform. J Wetl Res. 2019;21(4):365–373. doi: 10.17663/JWR.2019.21.4.365. [DOI] [Google Scholar]
- 23.Li S, Jiang S, Jiang S, Wu J, Xiong W, Diao S. A hybrid wavelet-based method for the peak detection of photoplethysmography signals. Comput Math Methods Med. 2017;2017:9468503. doi: 10.1155/2017/9468503. [DOI] [PMC free article] [PubMed] [Google Scholar]
- 24.Kavitha K, Vasuki S, Karthikeyan B. PPG signal denoising using a new method for the selection of optimal wavelet transform parameters. J Univ Shanghai Sci Technol. 2021;23(10):687–699. [Google Scholar]
- 25.Lee J. Motion artifacts reduction from PPG using cyclic moving average filter. Technol Health Care. 2014;22(3):409–417. doi: 10.3233/THC-140798. [DOI] [PubMed] [Google Scholar]
- 26.Mohan P, Nisha A, Nagarajan V, Jothi E. Measurement of arterial oxygen saturation (SpO2) using PPG optical sensor. 2016 International Conference on Communication and Signal Processing (ICCSP) (pp. 1136–40). 10.1109/ICCSP.2016.7754330
- 27.Casalino G, Castellano G, Zaza G. A mHealth solution for contact-less self-monitoring of blood oxygen saturation. 2020 IEEE Symposium on Computers and Communications (ISCC) (pp. 1–7). 10.1109/ISCC50000.2020.9219718
- 28.Giavarina D. Understanding bland altman analysis. Biochem Med. 2015;25(2):141–151. doi: 10.11613/BM.2015.015. [DOI] [PMC free article] [PubMed] [Google Scholar]


