

Abstract
Progress has been made in hardware for low frequencies, demonstrations of rapid frequency scans, hybrid instrumentation, and improved deconvolution software. The recent availability of the commercial Bruker BioSpin rapid scan accessory for their X-band EMX and Elexsys systems makes this technique available to a wide range of users without the need to construct their own system. Developments at lower frequencies are underway in several labs with the goal of facilitating in vivo and preclinical rapid scan imaging. Development of new deconvolution algorithms will make data processing more robust. Frequency scans have substantial promise at higher frequencies. New examples of applications show the wide applicability and advantages of rapid scan.
Keywords: electron paramagnetic resonance, in vivo EPR, resolution of hyperfine splittings, signal-to-noise
Comprehensive reviews of rapid scan electron paramagnetic resonance are given in (Eaton et al. 2014; Eaton et al. 2017; Eaton and Eaton 2018). A recent review provides a detailed discussion of the physical principles underlying rapid scan EPR (Tseytlin 2021). In this chapter we provide an overview of the rapid scan experiment, discussion of recent hardware and software developments, and guidance on selection of experimental parameters to optimize information content for particular types of samples.
1. Over-view of the rapid-scan experiment
In a conventional continuous wave (CW) EPR experiment the microwave power is constant and the main magnetic field B0 is scanned to achieve spin resonance. A second rapidly-oscillating field, designated as magnetic field modulation, is applied at a frequency up to 100 kHz. The EPR signal is recorded by phase-sensitive detection at the modulation frequency (Fig. 1). The output of the phase-sensitive detector is proportional to the difference in EPR signal amplitudes between the extremes of the modulation. If the modulation amplitude is sufficiently small relative to the spectral linewidth the signal from the phase-sensitive detector is proportional to the slope of the EPR lineshape. As the main magnetic field is stepped through resonance the phase-sensitive detected signal maps out the slope of the EPR spectrum, which gives the familiar first-derivative display. If the amplitude of the modulation is too large relative to the linewidth the detected signal is broadened. If the amplitude of the modulation is small enough to accurately measure the slope of the EPR line, only a small fraction of the signal amplitude is detected at each point on the magnetic field axis. To obtain the most accurate signal intensity and lineshape the constant microwave power is selected to be in a region where the signal amplitude increases linearly with the square root of increasing power (Eaton et al. 2010). In these CW scans the spin magnetization vector is tipped only slightly by the microwave field and is only slightly perturbed from equilibrium.
Figure 1.
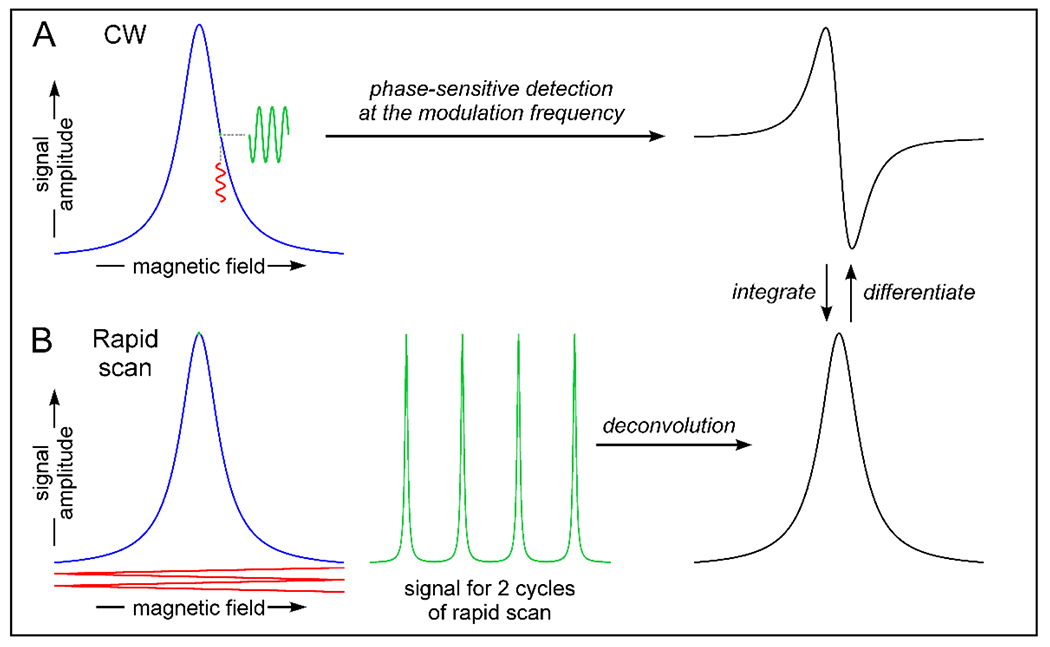
Comparison of signal detection by CW and rapid-scan EPR.
In a field-swept rapid-scan experiment the main magnetic field B0 is held constant near the center of the spectrum (Figure 1). A rapid-varying magnetic field is generated by an electrical current passing through coils. Provided that the rapidly varying field is sufficiently large, the full EPR spectrum is recorded twice during each cycle of the modulation - once during the up-field portion of the scan waveform and again during the down-field portion (Figure 1). The ability to detect the full signal amplitude in each pass through the spectrum substantially improves the signal-to-noise. The absorption and dispersion components of the EPR signal are recorded by direct detection with a quadrature mixer and both components are used to further improve the signal-to-noise. When the scan rate is faster than electron spin relaxation, the spin magnetic moment is perturbed substantially by the scan. After the scanning field has passed through resonance, the spins precess about B0 at the instantaneous Larmor frequency that is determined by the sum of the B0 field plus the scanned field. This frequency beats with the microwave or RF field, resulting in damped oscillations. The spacing between the oscillations decreases as the field scans away from resonance. This is different from the case for an FID, in which the oscillation frequencies are constant and define the static offset from resonance. The oscillations damp out with a time constant of T2*. Postprocessing software deconvolves the rapid scan oscillations and produces the EPR absorption spectrum. If the scan rate is not fast enough to generate oscillations the deconvolution software converts the experimental time axis to a magnetic field axis, but does not alter the spectrum. Thus the same signal processing algorithms can be used independent of scan rate.
Analogous to conventional CW experiments the microwave power is on continuously in a rapid scan experiment. Since the signal detection technique and signal processing is so different from the conventional experiment it is useful to use the designation ‘rapid scan’ to distinguish from other experiments. Because the resonance condition is satisfied for such a short time in the rapid scan experiment, the spin system does not saturate as readily as in conventional CW. This means that higher microwave power can be used which increases signal intensity and improves signal-to-noise. The selection of microwave power for rapid scan experiments is discussed in section 5.5.
As described previously (Eaton and Eaton 2018) the primary advantages of rapid scan are improved signal-to-noise, ability to explicitly correct for passage effects that arise from scanning through the spectrum too rapidly, linewidths that are not broadened by overmodulation provided that bandwidth constraints are taken into consideration (see section 5.4), and rapid data acquisition that can capture fast kinetics.
2. Recent hardware developments
2.1. Low frequency instrumentation
A rapid-scan EPR imager developed at West Virginia University is described in (Tseytlin et al. 2019). The system has several novel features. The EPR frequency is generated by mixing the output of a high-resolution arbitrary waveform generator (AWG) with a stable low-noise constant source frequency, which permits operation at a wide range of frequencies. Data are reported for operation at 800 MHz that was obtained by mixing the AWG output with a 700 MHz constant frequency source. The system has a digital automatic frequency control system that uses the AWG to sweep the RF frequency and lock to the frequency that provides the best resonator coupling which is defined as the minimum reflected power. The tuning sweeps are interleaved with data acquisition to adjust for animal motion. A digital automatic scan control monitors and corrects the amplitude and phase of the rapid sinusoidal magnetic field scans based on the voltage from a capacitor that is in-series with the scan coils. The digitized signal is compared with previous calibration to generate corrections, which produces highly accurate waveforms that are essential for rapid-scan deconvolution. A surface loop resonator with a 3D printed support structure was developed to reduce the amount of metal near the imaging region which is helpful in ensuring a uniform scanning magnetic field. The modular design from commercial components facilitates maintenance and upgrades of portions of the system. The performance was demonstrated with a phantom consisting of 4 tubes containing 1 mM solutions of trityl radicals with varying degrees of line broadening by a Gd3+ contrast agent (Tseytlin et al. 2019).
A tabletop spectrometer designed for rapid scan and pulsed EPR is based on an AWG and 25 mm cross-loop resonator (Buchanan et al. 2018a). The first experiments were performed at 700 MHz, although only the resonator would need to be replaced to operate at frequencies up to 1 GHz. This frequency range was selected to permit studies in mice. The system is a first step toward design of compact systems for pre-clinical use. The compact 4-coil magnet has a uniformity of < 25 ppm over the active volume of the resonator and weighs about 50 pounds (Figure 2). The main magnet and the gradient coils are digitally controlled by compact CAEN power supplies. The AWG is used to create the source frequency and chirp pulses for resonator tuning. The system performance for 2-D spectral-spatial imaging and 4D-spectral-spatial imaging was demonstrated with phantoms consisting of trityl radicals and nitroxides.
Figure 2.
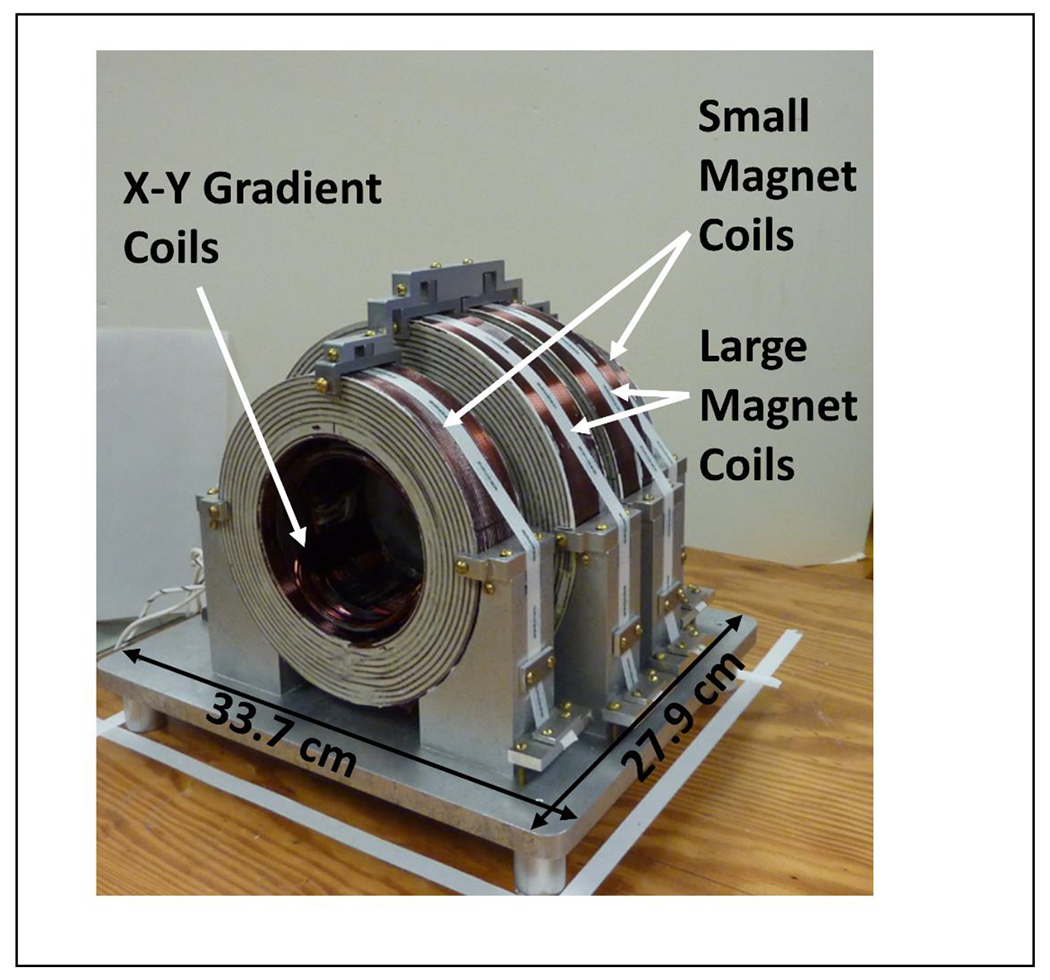
Compact electromagnetic designed by rapid scan imaging of mice at frequencies between 700 MHz and 1 GHz. Reproduced with permission from Buchanan et al. (Buchanan et al. 2018a).
A digital console for rapid-scan EPR that uses field programmable gate array (FPGA) technology has been demonstrated at 1.2 GHz (Sato-Akaba and Tseytlin 2019 ). The magnetic field scan waveform, spin excitation frequency, and digitizer sampling were run from a single internal clock. A digital feedback control system and voltage-tunable capacitors were used to perform automatic resonator tuning and matching adjustment with an electrically-tunable single loop-gap reflection resonator. A feedback system also was implemented to control the phase and amplitude of the rapid field scans which is very important for rapid-scan deconvolution. Data were accumulated continuously in the FPGA without time gaps, which eliminated the re-arm time of many digitizers. Band-pass sub-sampling was used to digitize the EPR signal at the carrier frequency. The narrow linewidths obtained for a sample of deoxygenated lithium octa-n-butoxyl-2,3-naphthalocyanine (LiNc-BuO) tested the frequency stability, scan field, and reflection reduction controls. The system can also perform pulsed EPR measurements (Sato-Akaba and Tseytlin 2019 ).
The rapidly-varying magnetic field of the rapid-scan experiments induces an oscillatory background signal that may be larger than the EPR signal from samples with low spin concentration. A background removal method was developed for use with bimodal cross-loop resonators (Buchanan et al. 2018b). For each spectrum two scans are acquired. In the second scan the main B0 field is reversed and the acquisition trigger is offset by one half cycle of the scan field, relative to the first scan. Subtraction of the second scan from the first scan reinforces the EPR signal and cancels the background signal. This method has the advantage that no assumptions are made concerning the shape of the background. The method was demonstrated at 258 MHz for samples containing nitroxide and trityl radicals and for a nitroxide in the presence of a magnetic field gradient. The experiment depended on the ability of the CAEN power supplies to quickly reverse the polarity of the main magnetic field under computer control.
Hybrid systems that combine two imaging modalities provide the possibility of simultaneously monitoring two or more time-dependent physiological parameters. A prototype hybrid imager that combines PET and sinusoidal rapid-scan EPR has been reported (Tseytlin et al. 2018). Positron emission tomography (PET) uses radiotracers to monitor processes including glucose metabolism. EPR imaging experiments can be designed to measure local oxygen concentration and pH, for example. Operation at an EPR frequency of 800 MHz was selected to avoid interfering cell phone signals at ~ 750 MHz. The main magnetic field was generated with a permanent magnet. The rapid-scan coils were constructed from Litz wire on a polylactic acid cylinder and placed in the center of the PET ring. A phantom consisted of 4 cylinders of 1 mM trityl and 25 μCi of 18F-radiotracer with and without a Gd contrast agent that broadens the trityl signal. The phantom was placed inside an EPR surface loop resonator and that assembly was positioned inside the rapid-scan coils. EPR images co-registered with PET and MRI were in good agreement. There was no evidence of photon attenuation by the EPR resonator and scan coils.
2.2. Frequency scan
Most rapid-scan experiments have been performed by scanning the magnetic field at constant frequency with a resonant cavity that has a relatively narrow bandwidth. Rapid frequency sweep experiments have been reported in the frequency range of 170 to 250 GHz with scan rates up to 3x10⁵ THz/s in a system without a microwave resonator (Laguta et al. 2018). These very fast sweep rates permit measurement of relaxation times as short as a few ns by analysis of the rapid-scan oscillations. A T2 of 2.5 to 2.2 ns was measured for lithium phthalocyanine at fields for 7.225 to 8 T (Figure 3). Sweeping the frequency has the advantage relative to field sweeps that eddy currents are not generated in conducting components of the resonator. There is, however, a strong background signal produced by standing waves. These background signals are independent of magnetic field and can be removed by subtraction of an off-resonance scan. Although the sweeps were sinusoidal a small fraction of the sweep can be approximated as linear which permitted use of the simpler linear deconvolution routines to recover the slow scan lineshapes. The rapid scan experiments do not require the high microwave powers that are needed for pulse experiments and that are difficult to achieve at high frequency.
Figure 3.
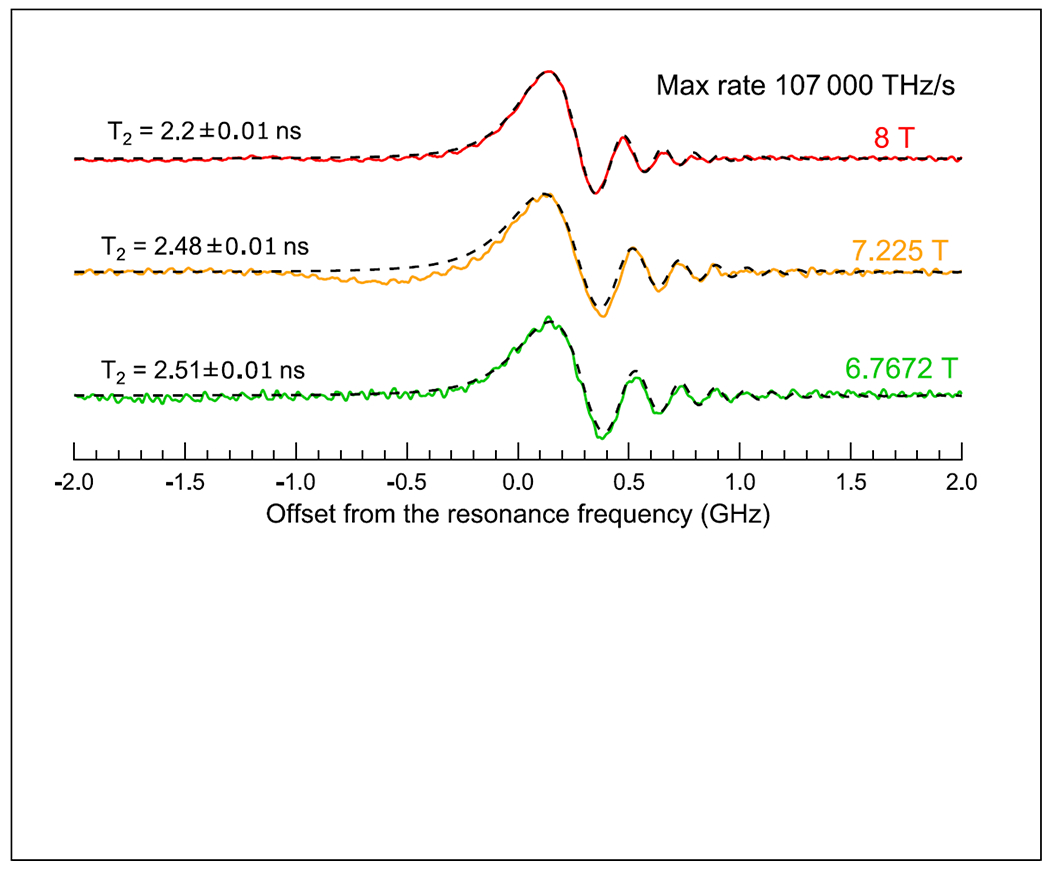
Rapid scan spectra of LiPc recorded with 2 MHz modulation frequency (107,000 THZ/s at the center of the spectrum) at 3 magnetic fields. Dashed lines correspond to the spectra calculated using the modified Bloch equations. Reproduced with permission from O. Laguta et al (2018) (Laguta et al. 2018).
2.3. Rapid scan with electrically detected magnetic resonance
Characterization of point defects in solid-state electronic devices is key to optimizing performance and reliability (McCrory et al. 2019). Electrically-detected magnetic resonance (EDMR) is a highly-sensitive technique for studying those defects, but conventional EPR spectrometers are not well suited to performing those experiments on semiconductor wafers. A conventional semiconductor wafer probing station has been adapted to perform EDMR on a fully processed semiconductor wafer. A very small non-resonance near-field microwave probe is used in placed of a resonator. The use of a non-resonant detection system permits frequency-swept EDMR. Signals from a 4H-SiC MOSFET were acquired with frequencies in both the slow-scan and rapid-scan regime. The output from an AWG was used to control a voltage controlled oscillator and a voltage-controlled attenuator that was needed to generate a constant power as frequency was varied. Sweep rates up to ~100 GHz/s were produced. Signals were digitized with an oscilloscope with a sampling rate of 5 GS/s. The rapid frequency scan measurements have the potential to enhance the signal-to-noise for the EDMR measurements and reduce the overall measurement time (McCrory et al. 2019).
2.4. Bruker commercial system
Bruker BioSpin has developed an X-band rapid-scan accessory that is compatible with their EMX and Elexsys systems (Eichhoff and Hofer 2020). For the dosimetric standard, irradiated alanine, the signal-to-nose was improved by a factor of about 17 for rapid scan relative to CW. The performance of this system for resolution of small hyperfine couplings (McPeak et al. 2020) and intracellular protein-lipid interactions (Braun et al. 2021) are discussed in section 4.
3. Algorithms for deconvolution of rapid scans
In a sinusoidal scan the magnetic field passes through resonance twice during the full period of the sinusoidal scan, which makes deconvolution of the full cycle an ill-posed problem. In the original algorithms for sinusoidal deconvolution (Tseitlin et al. 2011; Tseitlin et al. 2012) the deconvolution was performed on the up-field and down-field scans separately, which required that the EPR signal decay to zero by the end of each half cycle to avoid truncation errors. This limited the maximum scan rate. Faster scans are advantageous because higher microwave power can be used to improve signal-to-noise, as discussed in section 5.5. A new deconvolution method was developed that is based on the additive properties of linear systems: the full cycle response is the sum of the responses in the two halves of the cycle. The constraint on scan frequency now is based on the need for the signal to decay during the full scan cycle. The method was demonstrated for the narrow lines of lithium octa-n-butoxy-2,3-naphthalocyanine (LiNC-BuO) (Tseytlin 2017).
A general solution of the rapid-scan EPR deconvolution problem has been published (Tseytlin 2020). The impact of the varying magnetic field on the spin magnetization, which is called the driving function, was shown to be related to the phase gained by the precessing spins, using the Bloch equations. The derivation provides a general framework for deconvolution algorithms, including a basis for the relationship between field-scanned and frequency-scanned rapid-scan signals. The one assumption is that the spin system can be approximated as linearly time-invariant. Previously developed algorithms are shown to be special cases of the general solution. In principle any arbitrary magnetic field waveform could be used for rapid scans. However, the mathematical realities of working with real-world noisy data make the numerical solutions ill-posed when working with full-scan data. Workarounds are required as have been discussed previously for sinusoidal scans (Tseitlin et al. 2011; Tseitlin et al. 2012).
4. Examples of applications
The initial focus of rapid-scan EPR was on the improvement in signal-to-noise that could be achieved, especially for radicals with long electron spin relaxation times (Mitchell et al. 2013). Those experiments demonstrated lineshape fidelity for a range of species and accurate hyperfine splittings of nitroxide radicals. A related, and very important question, is how well closely spaced hyperfine lines that are key to defining electron spin density distribution can be resolved. The tradeoff between modulation amplitude and resolution of hyperfine splittings has been well documented for CW spectra. The analogous tradeoffs for rapid scan were examined in a study of 3-carbamoyl-2,2,5,5-tetramethylpyrrolidin-1-oxy (CTPO), diphenyl nitroxide (DPNO), galvinoxyl, and perylene cation radical (McPeak et al. 2020). It was shown that hyperfine resolution in rapid scan can be as good as by CW while still achieving improved signal-to-noise (Figure 4). In rapid scan there is a tradeoff between signal bandwidth and resonator bandwidth that can improve resolution at the expense of signal-to-noise. The detailed considerations of parameter selection for this tradeoff are discussed in section 5.
Figure 4.
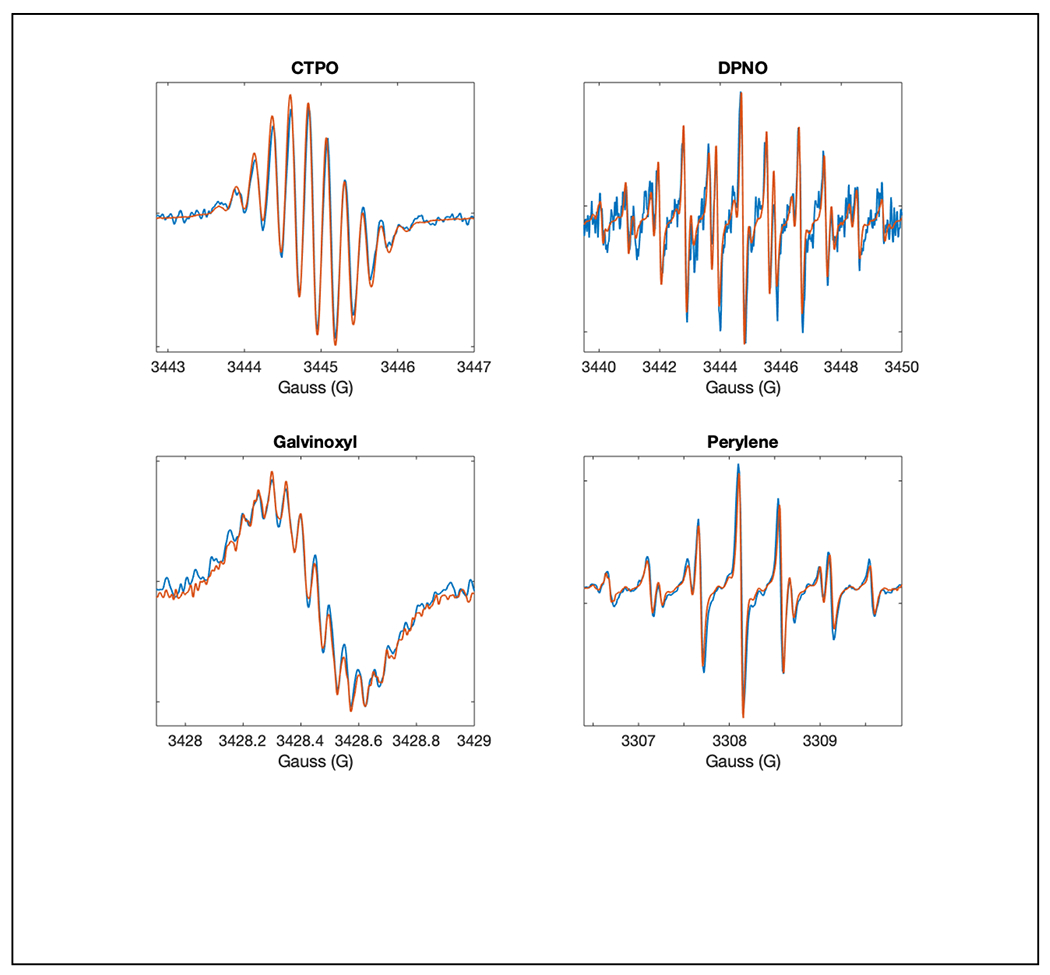
Overlays of expanded segments of CW (blue) and rapid-scam spectra (orange) showing the agreement in lineshapes and improved signal-to-noise for the same data acquisition times. A) CTPO, B) DPNO, C) galvinoxyl and D) perylene. Reproduced with permission from McPeak et al (2020) (McPeak et al. 2020).
Thiol redox status is a key factor in predicting the success or failure of cancer treatment (Epel et al. 2017). The rate of cleavage of the disulfide linkage in dinitroxides is proportional to the concentration of the major intracellular redox buffer, glutathione (Epel et al. 2017). Upon cleavage the spectrum of a dinitroxide with normal isotopic abundance changes from a 5-line spectrum to a 3-line spectrum, which can be monitored by EPR and EPR imaging. The higher signal-to-noise for rapid scan than for conventional CW is an important advantage for in vivo studies. The signal-to-noise can be further improved and the spectrum simplified by using isotopically substituted 2H,15N dinitroxide. Feasibility of the redox imaging experiments was demonstrated in a FSa fibrosarcoma tumor model in C3H mice (Figure 5). Previous studies had shown that the intracellular glutathione concentration in mice is reduced by treatment with L-buthionine sulfoximine (BSO). The rate of cleavage of the dinitroxide in the tumor, kobs, was decreased by BSO treatment, consistent with the hypothesis that the kinetics monitored by the imaging reflects changes in the glutathione concentration and local redox status. Integration of the spectra as a function of time also permitted measurement of the rate of clearance of the nitroxide, kclr (Epel et al. 2017).
Figure 5.
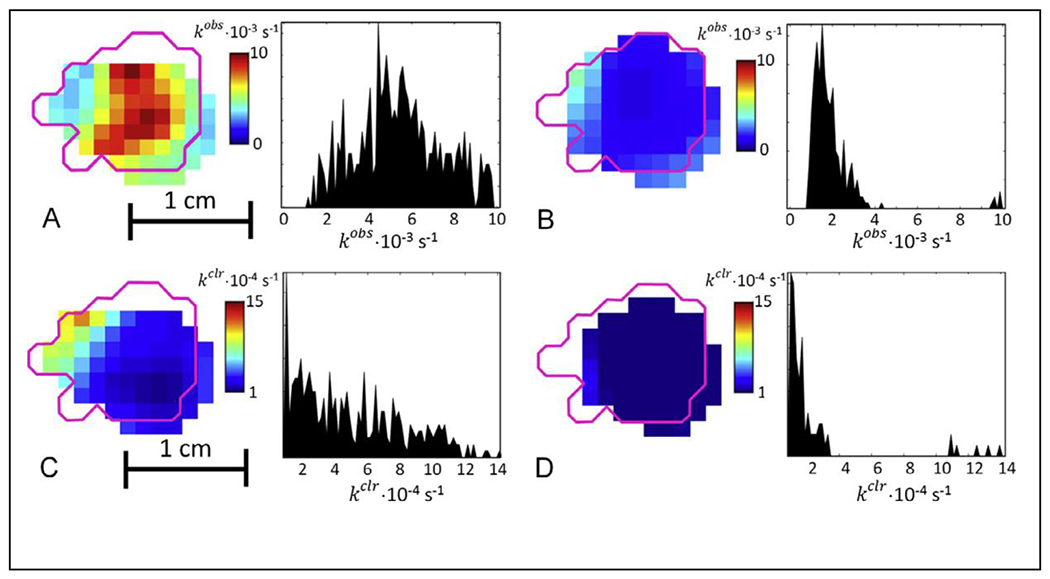
Sagittal slices and histograms of the dinitroxide cleavage rate kobs in FSa tumor (A) before and (B) 24 hr after application of BSO. Magneta outline shows the tumor border as obtained from a co-registered MRI image. The histograms shows kobs in all voxels of the tumor. Sagittal slices and histograms of the clearance rate kclr in FSs tumor (C) before and (D) after application of BSO. The histogram shows kclr in all voxels of the tumor. Reproduced with permission from Epel et al (2017) (Epel et al. 2017).
Alkaline phosphatase (ALP) catalyzes the dephosphorylation of substrates that contain a phosphate monoester and is reported to be a biomarker for some diseases. A spin-labeled substrate for ALP was synthesized, which contains a phosphate enol ether that is cleaved by ALP with high specificity (Sanzhaeva et al. 2018). The paramagnetic cleavage product is the well-known tempone radical, which has a nitrogen hyperfine coupling constant that is smaller than in the phosphate ester. As the cleavage reaction occurs the relative intensities of the well-resolved hyperfine lines from substrate and product change. Rapid scan at 800 MHz was used to image a phantom consisting of 3 tubes containing (i) substrate, (ii) substrate + ALP, and (iii) product. The image showed the time evolution of signal intensities in tube (ii) and the time invariance of the signals in tube (i) and (iii). This proof-of-principle experiments demonstrates the feasibility of monitoring activity of ALP in vivo using a specifically-designed substrate (Sanzhaeva et al. 2018).
Rapid-scan EPR of spin-labeled human α-synuclein (αS) has been used to study interaction with lipid membranes in vitro and in vivo in oocytes of Xenopus laevis (Braun et al. 2021). In vitro the spectra showed distinctive broadening in the presence of large unilamellar vesicles prepared from negatively charged 1-palmitoyl-2-oleoyl-sn-glycero-3-(phospho-rac-(1-glycerol)) (POPG) lipids, but not in the presence of vesicles prepared from uncharged 1-palmitoyl-2-oleoyl-sn-glycero-3-phosphocholine (POPC) lipids. The broadening is consistent with reduced rotational mobility that results from binding to the lipid. Prior attempts to study binding of αS to membranes in vivo had been limited by poor signal-to-noise. The improvement in signal-to-noise afforded by rapid scan permitted studies in vivo. The spin-labeled αS in the absence or presence of lipid vesicles was micro-injected into oocytes. Analogous to the observations in vitro, broadening of the EPR signal was observed only in the presence of the negatively charged lipids. The fast acquisition of rapid-scan EPR spectra permitted monitoring the extent of binding to lipid and endogenous membranes as a function of time, despite the relatively rapid reduction of nitroxide. Only a fraction of the αS is bound. The broadened signal from the bound αS is more readily distinguished from unbound αS in the absorption spectra obtained by rapid scan than in the first derivative spectra that are reported by CW spectroscopy (Braun et al. 2021) .
Defects in thin-film silicon solar cell materials are present in low concentrations and have long electron spin relaxation times, which makes quantitation by CW EPR challenging. For a set of 7 samples of hydrogenated amorphous silicon rapid-scan EPR was shown to improve the signal-to-noise by factors of between 10 and 50 relative to CW (Figure 6) (Möser et al. 2017). Experiments were performed on a Bruker E580 spectrometer. The CW spectra were acquired with a Bruker high-quality factor SHQE resonator to obtain the best possible CW sensitivity. The rapid-scan spectra were acquired with a Bruker 4118X-MD5 dielectric resonator to minimize the effect of eddy current induced in metallic components of the resonator and take advantage of the resonator bandwidth. Sinusoidal scans at 37 kHz and 4 mT width were generated using the modulation coils built into the resonator. Under these conditions the signal bandwidth is less than the resonator and detection bandwidth, which is required to obtain undistorted lineshapes.
Figure 6.
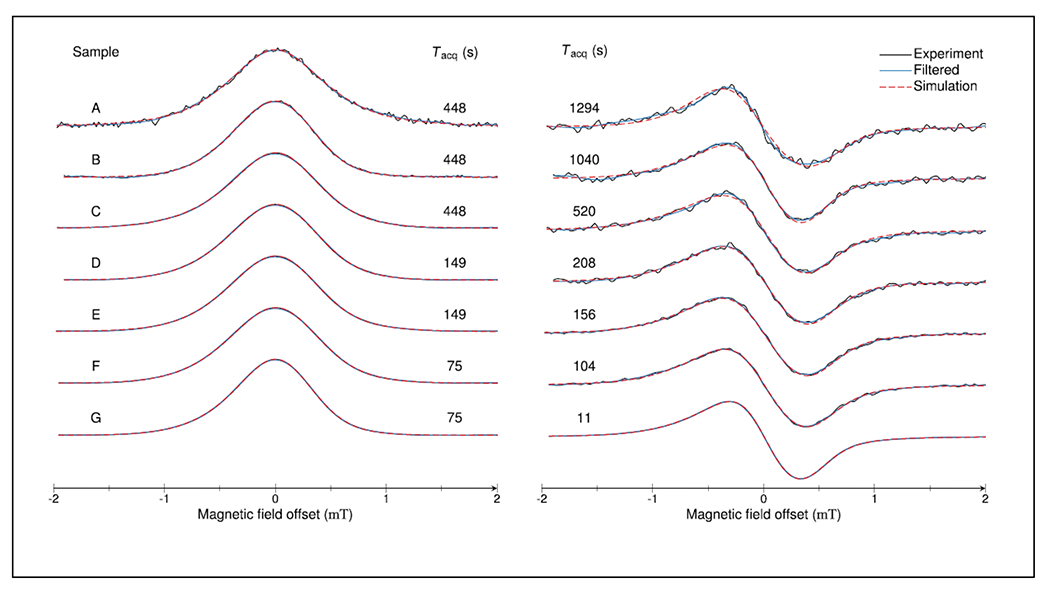
Rapid scan (left) and CW (right) spectra of α-hydrogenated silicon samples, after baseline subtraction, obtained with the data acquisition time, Tacq. The plot includes the raw data (black), data after applying a low-pass filter (blue), and simulations obtained with EasySpin (red). Reproduced with permission from Möser et al (2017) (Möser et al. 2017).
Many physiologic parameters including O2 concentration, pH, and tissue redox status have been measured using nitroxide, trityl and lithium phthalocyanine (LiPc) radicals. The relaxation times and linewidths of these probes are quite different, so a fundamental question is how well these physiologic parameters can be measured simultaneously. A rapid-scan image at 250 MHz was obtained of a phantom consisting of solid LiPc and solutions of the trityl and nitroxide radicals in separate tubes (Shi et al. 2019). With a gradient of 10 G/cm the spatial resolution in 2D spectral-spatial images was about 0.1 mm for the narrow trityl and LiPc signals and about 1 mm for the broader nitroxide lines.
Oxygen is a polymerization inhibitor in many of the processes that that are employed to convert liquid resins into solid structures for 3D stereolithography printing. EPR imaging of local oxygen concentration using LiNC-BuO as a probe has been used to monitor depletion of oxygen during photo-induced polymerization (Tseytlin et al. 2021). Three proof-of-principle experiments were demonstrated at 800 MHz: (1) spatial propagation of the polymerization in a bottle with an LED light source below the bottle, (2) oxygen depletion during postcuring of a series of layers, and (3) visualization of oxygen in a 3D printed spiral. It was proposed that high resolution oxygen imaging could be used to improve understanding and modeling of the polymerization process. The higher sensitivity of rapid-scan imaging, relative to CW imaging, permits lower probe concentration and/or faster image acquisition.
EPR imaging is usually performed in a uniform magnetic field plus intentionally added gradients. An inverse experiment can be performed in which the nonuniformity of the magnetic field is probed by monitoring shifts in the resonance position of a paramagnetic probe with a narrow EPR signal. Rapid-scan imaging at 800 MHz has been demonstrated using the narrow signal from deoxygenated LiNC-BuO microcrystals to probe the magnetic field in the vicinity of a magnetized assembly of iron oxide Fe3O4 silicon-coated nanoparticles (Tseytlin et al. 2020). Rapid scan has the advantage that the images can be obtained more quickly than by CW, although there may be limitations on the magnitude of field offsets that can be measured. EPR imaging has the advantage over magnetic field cameras because the interior of an object can be scanned.
5. Guidance on parameter selection for field-swept rapid scan
As in the case of CW and pulsed EPR, one can observe a rapid-scan EPR signal with parameters far-removed from optimum values. The optimization depends on the information desired, and the amount of post-acquisition processing acceptable. In CW EPR if a line shape with less than 1% distortion is desired, one needs to be very conservative in selection of microwave power to avoid power saturation, in modulation amplitude to avoid broadening of the line, and in the choice of scan time and filter time constant. Factors impacting analogous parameter selection for rapid-scan experiments are discussed in this section. The scan rate should be chosen consistent with the bandwidth of the EPR signal relative to the bandwidths of the resonator and the detection system. Higher powers can be used for rapid scan than for CW without saturating the signal, but the power saturation depends on scan rate, so power should be selected after sweep width and sweep frequency have been selected.
5.1. Triangular vs. sinusoidal scans
Methods are now available to deconvolve either linear or sinusoidal scans, so data processing does not favor one waveform over the other. From a hardware perspective it is easier to generate sinusoidal scans than triangular scans. For a sinusoidal scan the coils can be resonated at the scan frequency, which decreases the power that is needed in the circuit to create a scan. As a result, wider and faster scans can be performed with sinusoidal waveforms than triangular waveforms. For linear magnetic field scans, the system has to support at least the 7th harmonic of the nominal drive frequency. That is, a 10 kHz triangular scan requires a driver that can achieve at least 70 kHz bandwidth which requires a more sophisticated driver than for sinusoidal scans. Even with seven harmonics, only about 95% of the scan will be linear enough to use (Quine et al. 2009). Increasing B1 can improve signal-to-noise, but only if the signal is not saturated. The maximum non-saturating B1 increases with increasing scan rate (section 5.5). In a sinusoidal scan the scan rate varies through the spectrum with the fastest rates in the center and slower rates toward the edges. This means that saturation is more severe toward the edges than in the center, which may require use of a smaller B1 to avoid saturation of all regions of the spectrum. Combining multiple rapid-scan segments to form a wider scan currently is based on triangular scans (Yu et al. 2015).
5.2. Sample size relative to size of scan coils
To acquire spectra with accurate lineshapes and maximum spectral fidelity high uniformity of the scan field is required. The deconvolution software converts the original time axis to a magnetic field axis. If the magnetic field scan is not uniform over the volume of the sample, the relationship between time and magnetic field is not uniform, which causes spectral broadening in the deconvolved spectrum. The need for homogeneity of the scanned field means that the dimensions of the sample must be substantially smaller than the diameter of the scan coils. When the relatively small diameter modulation coils that are built into commercial CW resonators are used to perform a rapid-scan experiment the sample needs to be smaller than if larger purpose-built scan coils are used. The maximum length of the sample should be selected based on the dimensions of the scan coils for the system available.
5.3. Resonator selection
The rapidly-changing magnetic field induces eddy currents in conducting components of the resonator as well as other system components including the magnet and gradient coils. These eddy current may contribute to magnetic field inhomogeneity and to the background signal. To minimize these effects it is important to use a resonator with as little conductivity as possible. Of the standard Bruker X-band resonators, the dielectric resonator has been used for rapid scan experiments rather than the SHQE or split ring resonators that have much larger eddy currents.
The Q of a critically coupled X-band resonator often is too high for rapid-scan EPR. The Bruker X-band rapid-scan accessory includes a resonator with adjustable Q that is useful for matching resonator bandwidth to signal bandwidth as discussed in section 5.4. The Q of the resonator is adjusted by introducing lossy material into the resonator. In the experiments in the Denver lab the resonator Q has been lowered by various means, usually by introducing water into the sample area of the resonator in one or more separate tubes or by using water or alcohols as the solvent for the sample. Since rapid scan is a continuously-driven experiment, lowering the Q by over-coupling, as is done in pulsed EPR, is not an option for a reflection resonator, because of the resulting increase in reflected power. However, overcoupling could be used to lower the Q of a cross-loop resonator, since high power is incident on one resonator and signal detection is from the second resonator.
At lower frequencies resonators have been custom built for rapid-scan experiments. These resonators have been designed to minimize eddy currents. Q values typically are lower than at X-band so lowering resonator Q to provide adequate resonator bandwidth typically is not needed. Cross-loop resonators have the advantage of decreasing the impact of source noise on the detected signal.
5.4. Selection of scan frequency
As in CW spectroscopy spectra usually are obtained first with a sweep width that is wide enough to encompass the full spectrum. For rapid scan the widest scan may be limited by the coil driver and the scan coils. In our laboratory the widest scans available are about 160 G at X-band (Yu et al. 2014) and about 200 G at L-band (Shi et al. 2016). Wider scans require recording spectra in segments and piecing segments together (Yu et al. 2015). For a given scan width there are tradeoffs involving scan rate and spectral resolution that are determined by the scan-rate dependent signal bandwidth and the Q-dependent resonator bandwidth (Eaton and Eaton 2018; McPeak et al. 2020). These considerations are discussed in detail here.
5.4.1. Signal bandwidth
The scan rate in a sinusoidal scan varies continuously across the spectrum. The maximum rate in the center of the scan, as (Eq. 1) is given by
| (1) |
where as is the sinusoidal scan rate, fs is the scan frequency, and Bm is the scan width in gauss. In triangular scans the scan rate at (Eq. 2) is independent of position in the scan.
| (2) |
The bandwidth of a rapid-scan signal is given by
| (3) |
where the value of N depends on the acceptable extent of lineshape broadening and the scan rate a is either at (triangular) or as (sinusoidal). T2* is the time constant for decay of the oscillations on the trailing edge of the signal, and is also the decay time constant that would be observed for a free induction decay (FID). Although the definition of the rapid-scan regime is that the magnetic field scans through the signal in a time that is less than T2, the frequency bandwidth of the spectrum depends on T2*. A value of N between 5 and 10 in Eq. (3) is a relatively conservative starting point for selecting scan parameters. The bandwidth required depends on the T2* for the sample and the linewidth accuracy desired in an experiment. The larger the value of N, the less the signal is broadened.
For a Lorentzian lineshape
| (4) |
where ΔBpp is the peak-to-peak first derivative linewidth. The bandwidth for the rapid-scan signal for a Lorentzian line is then
| (5) |
The relationship between T2* and ΔBpp depends on the lineshape. Unresolved hyperfine structure results in EPR line broadening that is approximately Gaussian, and decreases the signal bandwidth which therefore changes the selection of parameters for rapid scan. For example, 15N perdeutero tempone has ΔBpp ~ 175 mG with Gaussian broadening due to unresolved deuterium hyperfine coupling. Use of Eq (4), which assumes a Lorentzian shape, gives T2* = 380 ns, but the experimental T2* by pulse methods is about 430 ns. Eq. (5) is a useful starting point for estimating signal bandwidth and selecting scan rates consistent with a particular resonator Q or scan frequency.
5.4.2. Resonator bandwidth
A resonator acts as a filter for the rapid-scan EPR signal as was shown experimentally at X-band for scans in a high Q resonator (Joshi et al. 2005). Resonator Q can be expressed in many ways, but one that is convenient for discussion of rapid-scan EPR is in terms of the frequency bandwidth of the resonator, Δν.
| (6) |
Since each half cycle of a rapid-scan experiment is recorded with either increasing or decreasing field/frequency, the relevant bandwidth that is available for a rapid-scan signal (BWRS) is only half of the resonator bandwidth.
| (7) |
For an X-band resonator with ν = 9.3x10⁹ Hz and Q = 3000, Δν = 3.1 MHz, and BWRS is 1.55 MHz (Eq. 7). This bandwidth is too low for many rapid-scan experiments. If the Q is lowered to 300 then Δν = 31 MHz and BWRS is 15.5 MHz. To take advantage of this bandwidth the spectrometer detection and amplification bandwidths should be at least 15.5 MHz, preferably greater. This detection bandwidth is available in pulse spectrometers but not in typical CW spectrometers.
5.4.3. Examples
Examples of the impact of scan rate on experimental spectra are shown in (McPeak et al. 2020) (Figure 7) for data acquired in a resonator with Q = 1500. For the spectra shown in Fig. 7A,B the signal bandwidth is less than the resonator bandwidth and the lineshape is in good agreement with slow scan CW spectra. However for the faster scan rates used to acquire the data in Figure 7C,D the signal bandwidth exceeds the resonator bandwidth and the signal is broadened. To avoid signal distortion a slower scan rate should be used. Alternatively, a smaller segment of the spectrum could be recorded with the higher scan rate, which would reduce the signal bandwidth and result in high resolution spectra.
Figure 7.
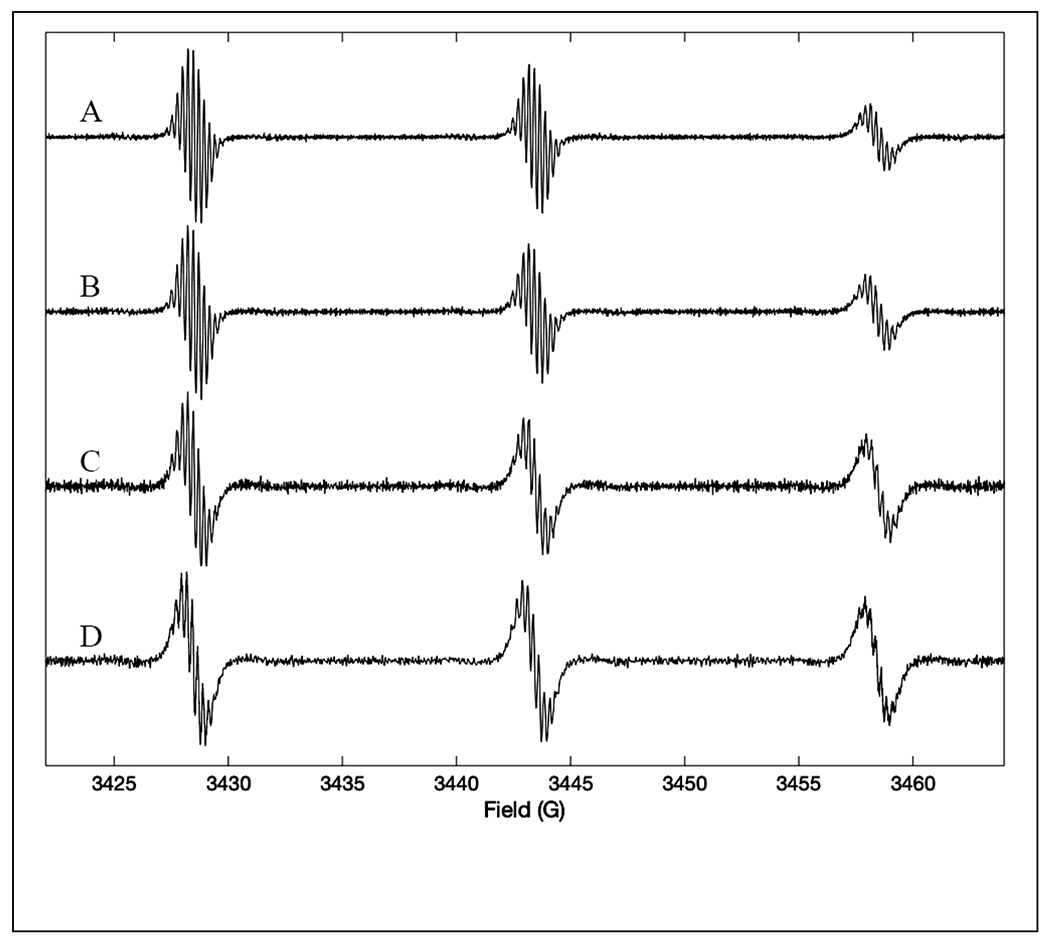
First-derivatives of rapid-scan spectra of 0.2 mM CTPO in ethanol obtained with a sample height of 3 mm, scan width of 60 G and 20 mG B1. A) Triangular scan with frequency of 1.8 kHz and scan rate of 220 G/s. B) Sinusoidal scan with frequency of 1.8 kHz and scan rate in the center of the spectrum of 350 kG/s. C) Sinusoidal scan with frequency of 6.2 kHz and scan rate in the center of the spectrum of 1200 kG/s. D) Sinusoidal scan with frequency of 10.5 kHz and scan rate in the center of the spectrum of 2000 kG/s. Reproduced with permission from McPeak et al (2020) (McPeak et al. 2020).
Consider calculations of the bandwidth requirements for two specific cases:
Case 1. For anoxic deuterated trityl radical ΔBpp ~ 20 mG. A 20 kHz sinusoidal scan with 5 G sweep width (as = 3.4x10⁵ G/s) results in a signal bandwidth of ~15 MHz, at N = 5. At 9.6 GHz, resonator Q (Eq. 7) should be less than about 320. If the Q cannot be lowered this far, then the scan rate would need to be reduced to avoid signal broadening.
Case 2. A nitroxide with ΔBpp ~ 150 mG, recorded with a 80 kHz sinusoidal scan and 40 G sweep width (as = 1.0x10⁷ G/s) has a signal bandwidth of ~62 MHz at N = 5. At 9.6 GHz, resonator Q would have to be less than about 78. Case (2) could be collected into a Bruker SpecJet which has a maximum bandwidth of 200 MHz, but the same signals would be distorted by the 20 MHz bandwidth of a Bruker SPU. In each case the video amplifier bandwidth in the bridge would need to be set to greater than the resonator and signal bandwidths. Most nitroxides have substantially broader lines so the constraint on Q would not be as severe. If the goal were to maximize signal-to-noise and some broadening was acceptable, a Q higher than 78 could be used. Alternatively, if lineshape fidelity was the highest priority, then a slower scan rate would be required if the resonator Q was greater than about 78 and the sweep width could be reduced to record only one of the nitrogen hyperfine lines.
For immobilized or slowly tumbling species anisotropies are not fully averaged and T2* may be much smaller than T2, which makes the signal bandwidth requirement smaller than that determined by T2. In practice, the scan rate is initially set to a conservatively slow value. The linewidth is monitored as the scan rate is increased, until the line broadening approaches the maximum acceptable value. The signal-to-noise can be improved, at the expense of line broadening, by acquiring data with smaller bandwidth, which permits use of higher resonator Q and increased post-processing filtering.
5.4.4. Constraints on scan rates imposed by rapid-scan oscillations.
If the relaxation times are long relative to the time to scan through the line, the transient effects on the trailing edge of the signal damp out with the time constant T2*. If the time between successive passes through resonance is less than about 5 T2*, oscillations have not fully damped out before the next spin excitation, which complicates interpretation of the data. This constraint requires that 1/fs > ~20 T2*, and depends on the position of the signal in the scan. Since T2* usually is < T1 this limitation on the scan frequency is less restrictive than the limitation on pulse repetition rates for pulsed EPR.
5.5. Microwave power
Higher powers can be used for rapid scan than for CW without saturating the signal. The scan rate should be selected based on the criteria discussed in the prior paragraphs prior to selecting the microwave power for a rapid scan experiment. A power saturation curve of signal amplitude as a function of microwave power should then be recorded at the selected scan rate. An example of the difference in power saturation for rapid scan and CW is shown in Figure 8. In a sinusoidal scan the scan rate varies through the spectrum. Although signal bandwidth is calculated based on the maximum rate in the center of a sinusoidal scan, power saturation should be determined for peaks toward the edges of the sinusoidal scan because these signals will saturate at lower B1 than peaks in the center of the scan.
Figure 8.
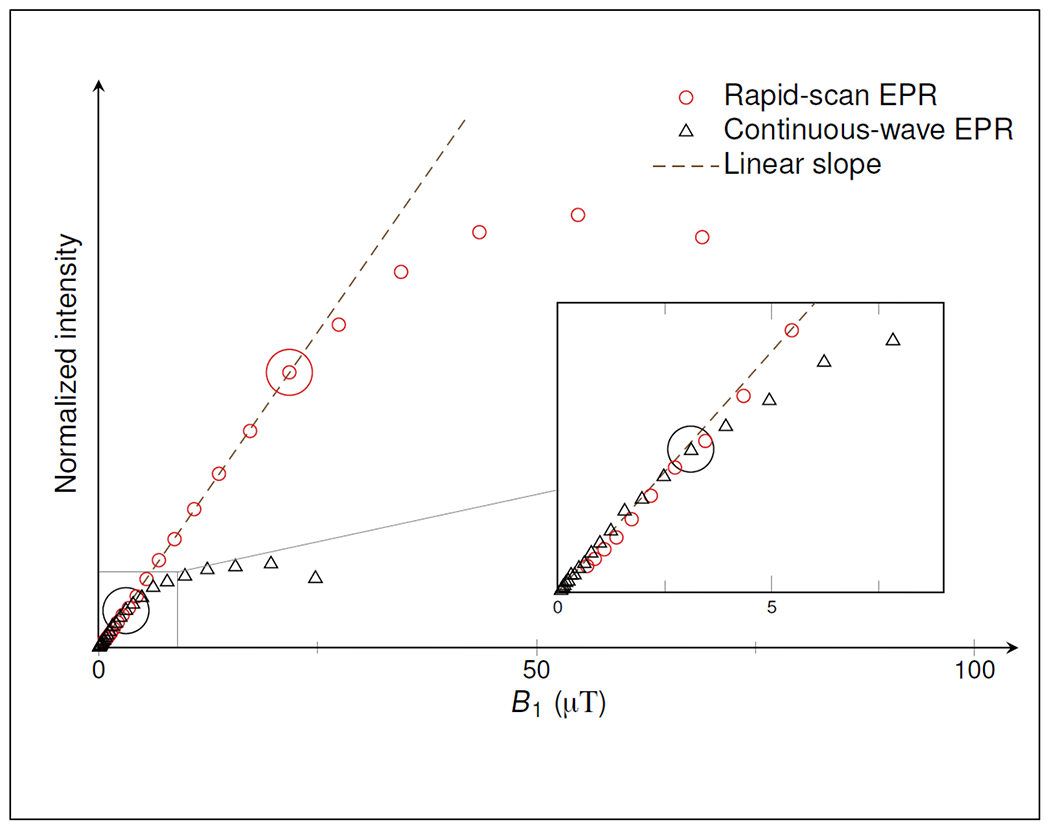
Saturation curves for rapid scan (red circles) and CW (black triangles) EPR on a sample of α-hydrogenated silicon. Signal intensities are plotted as a function of the microwave magnetic field, B1. Intensity values are normalized such that the slope in the linear regime (black dashed line) is equal for RS and CW. Circles mark the B1 that was selected to acquiring data. The inset magnifies the low-power regime for the CW experiments. Reproduced with permission from Möser et al (2017) (Möser et al. 2017).
5.6. Filtering in post-processing
Although the bandwidth required for acquisition of the rapid scan signal is greater than for CW, the bandwidths are the same after deconvolution of the rapid scan driving function. Thus the filtering that can be applied to a CW spectrum is the same as for rapid scan.
6. Summary
Progress has been made in multiple aspects of rapid scan EPR. The recent availability of the commercial Bruker BioSpin rapid scan accessory for their X-band EMX and Elexsys systems makes this technique available to a wide range of users without the need to construct their own system. Developments at lower frequencies are underway in several labs with the goal of facilitating in vivo and preclinical rapid scan imaging. Development of new deconvolution algorithms will make data processing more robust. Frequency scans have substantial promise at higher frequencies. New examples of applications show the wide applicability and advantages of rapid scan.
Acknowledgements.
Support for work in our lab on rapid-scan EPR has been provided by NSF IDBR 0753018, NIH EB000557, NIH R01CA177744, and NIH R01CA262159, and by the University of Denver.
References
- Braun TS, Stehle J, Kacprzak S, Carl P, Hofer P, Subramanian V and Drescher M (2021). Intracellular Protein-Lipid Interactions Studied by Rapid-Scan Electron Paramagnetic Resonance J. Phys. Chem. Lett 12: 2471–2475. [DOI] [PMC free article] [PubMed] [Google Scholar]
- Buchanan LA, Rinard GA, Quine RW, Eaton SS and Eaton GR (2018a). Tabletop 700 MHz EPR Imaging Spectrometer. Conc. Magn. Reson. B, Magn. Reson. Engin 48 B: doi 10.1002/cmr.b.21384. . [DOI] [PMC free article] [PubMed] [Google Scholar]
- Buchanan LA, Woodcock LB, Quine RW, Rinard GA, Eaton SS and Eaton GR (2018b). Background correction in rapid scan EPR spectroscopy. J. Magn. Reson 293: 1–8 [DOI] [PMC free article] [PubMed] [Google Scholar]
- Eaton GR and Eaton SS (2018). Rapid Scan Electron Paramagnetic Resonance, in EPR Spectroscopy: Fundamentals and Methods. Goldfarb D and Stoll S, Eds., N. Y., John Wiley & Sons, 503–520. [Google Scholar]
- Eaton GR, Eaton SS, Barr DP and Weber RT (2010). Quantitative EPR, New York, Springer-Verlag/Wien. [Google Scholar]
- Eaton SS, Quine RW, Tseitlin M, Mitchell DG, Rinard GA and Eaton GR (2014). Rapid Scan Electron Paramagnetic Resonance in Multifrequency Electron Paramagnetic Resonance: Data and Techniques. Misra SK, Ed., N. Y., Wiley; 3–67. [Google Scholar]
- Eaton SS, Shi Y, Woodcock L, Buchanan LA, McPeak J, Quine RW, Rinard GA, Epel B, Halpern HJ and Eaton GR (2017). Rapid Scan EPR Imaging. J. Magn. Reson 280 140–148. [DOI] [PMC free article] [PubMed] [Google Scholar]
- Eichhoff U and Hofer P (2020). 75 Years of EPR. EPR Milestones in 60 Years of Bruker History. Appl. Magn. Reson 51: 1723–1737. [Google Scholar]
- Epel B, Sundramoorthy SV, Krzykowska-Serda M, Maggio MC, Tseytlin M, Eaton GR, Eaton SS, Rosen GM, Kao JPY and Halpern HJ (2017). Imaging Thiol Redox Status in Murine Tumors In Vivo with Rapid-scan Electron Paramagnetic Resonance. J. Magn. Reson 276: 31–36 [DOI] [PMC free article] [PubMed] [Google Scholar]
- Joshi JP, Eaton GR and Eaton SS (2005). Impact of Resonator on Direct-Detected Rapid-Scan EPR at 9.8 GHz. Appl. Magn. Reson 28: 239–249. [Google Scholar]
- Laguta O, Tucek M, Van Slageren J and Neugebauer P (2018). Multi-frequency rapid-scan HFEPR. J. Magn. Reson 296: 138–142. [DOI] [PubMed] [Google Scholar]
- McCrory DJ, Anders MA, Ryan JT, Shrestha PR, Cheung KP, Lenahan PM and Campbell JP (2019). Slow- and rapid-scan frequency-swept electrically detected magnetic resonance of MOSFETs with a non-resonance microwave probe within a semi-conductor wafer-probing stations Rev. Sci. Instrum 90: 014708. [DOI] [PMC free article] [PubMed] [Google Scholar]
- McPeak J, Höfer P, Kacprzak S, Carl P, Weber R, Eaton SS and Eaton GR (2020). Rapid-Scan Electron Paramagnetic Resonance of Highly Resolved Hyperfine in Organic Radicals. ChemPhysChem 21: 2564–2570. [DOI] [PMC free article] [PubMed] [Google Scholar]
- Mitchell DG, Tseitlin M, Quine RW, Meyer V, Newton ME, Schnegg A, George B, Eaton SS and Eaton GR (2013). X-Band Rapid-scan EPR of Samples with Long Electron Relaxation Times: A Comparison of Continuous Wave, Pulse, and Rapid-scan EPR. Mol. Phys 111: 2664–2673. [Google Scholar]
- Möser J, Lips K, Tseytlin M, Eaton GR, Eaton SS and Schnegg A (2017). Using Rapid-scan EPR to improve the detection limit of quantitative EPR by more than one order of magnitude. J. Magn. Reson 281: 17–25. [DOI] [PMC free article] [PubMed] [Google Scholar]
- Quine RW, Czechowski T and Eaton GR (2009). A Linear Magnetic Field Scan Driver. Conc. Magn. Reson., Magn. Reson. Engineer 35B: 44–58. [DOI] [PMC free article] [PubMed] [Google Scholar]
- Sanzhaeva U, Xu X, Guggilapu P, Tseytlin M, Khramtsov VV and Driesschaert B (2018). Imaging of Enzyme Activity by Electron Paramagnetic Resonance: Concept and Experiment Using a Paramagnetic Substrate of Alkaline Phosphatase. Angew. Chem. Int. Ed 57: 11701–11705. [DOI] [PMC free article] [PubMed] [Google Scholar]
- Sato-Akaba H and Tseytlin M (2019. ). Development of an L-band rapid scan EPR digital console. J. Magn. Reson 304: 42–52 [DOI] [PMC free article] [PubMed] [Google Scholar]
- Shi Y, Eaton SS and Eaton GR (2019). Rapid-Scan EPR Imaging of a Phantom Comprised of Species with Different Linewidths and Relaxation Times J. Magn. Reson 308: 106593. [DOI] [PMC free article] [PubMed] [Google Scholar]
- Shi Y, Rinard GA, Quine RW, Eaton SS and Eaton GR (2016). Rapid scan electron paramagnetic resonance at 1.0 GHz of defect centers in γ-irradiated organic solids. Radiation Measurements 85: 57–63. [DOI] [PMC free article] [PubMed] [Google Scholar]
- Tseitlin M, Mitchell DG, Eaton SS and Eaton GR (2012). Corrections for sinusoidal background and non-orthogonality of signal channels in sinusoidal rapid magnetic field scans. J. Magn. Reson 223: 80–84. [DOI] [PMC free article] [PubMed] [Google Scholar]
- Tseitlin M, Rinard GA, Quine RW, Eaton SS and Eaton GR (2011). Deconvolution of Sinusoidal Rapid EPR Scans. J. Magn. Reson 208: 279–283. [DOI] [PMC free article] [PubMed] [Google Scholar]
- Tseytlin M (2017). Full cycle rapid scan EPR deconvolution algorithm. J. Magn. Reson 281: 272–278. [DOI] [PMC free article] [PubMed] [Google Scholar]
- Tseytlin M (2020). General solution for rapid scan EPR deconvolution problem. J. Magn. Reson 318: 106801. [DOI] [PMC free article] [PubMed] [Google Scholar]
- Tseytlin M (2021). Continuous-wave rapid scan EPR. Electron Paramagnetic Resonance 27: 188–213. [Google Scholar]
- Tseytlin M, Stolin AV, Guggilapu P, Bobko AA, Khramtsov VV, Tseytlin O and Raylman RR (2018). A combined positron emission tomography (PET)-electron paramagnetic resonance imaging (EPRI) system: initial evaluation of a prototype scanner. Phys. Med. Biol 63: 105010. [DOI] [PMC free article] [PubMed] [Google Scholar]
- Tseytlin O, Bobko AA and Tseytlin M (2020). Rapid Scan EPR imaging as a Tool for Magnetic Field Mapping. Appl. Magn. Reson 51: 1117–1124. [DOI] [PMC free article] [PubMed] [Google Scholar]
- Tseytlin O, Guggilapu P, Bobko A, Alahmad H, Xu X, Epel B, O’Connell R, Hoblitzell EH, Eubank TD, Khramtsov V, Driesschaert B, Kazkaz E and Tseytlin M (2019). Modular imaging system: Rapid Scan EPR at 800 MHz. J. Magn. Reson 305: 94–103. [DOI] [PMC free article] [PubMed] [Google Scholar]
- Tseytlin O, O’Connell R, Tseytlin M, Sivishankar V and Bobko AA (2021). Rapid Scan Oxygen Imaging in Photoactivated Resin Used for Stereolithographic 3D Printing. 3D Printing and Additive Manufacturing: 10.1089/3dp.2020.0170. [DOI] [PMC free article] [PubMed] [Google Scholar]
- Yu Z, Liu T, Elajaili H, Rinard GA, Eaton SS and Eaton GR (2015). Field-Stepped Direct Detection Electron Paramagnetic Resonance. J. Magn. Reson 258: 58–64. [DOI] [PMC free article] [PubMed] [Google Scholar]
- Yu Z, Quine RW, Rinard GA, Tseitlin M, Elajaili H, Kathirvelu V, Clouston LJ, Boratyński PJ, Rajca A, Stein R, Mchaourab H, Eaton SS and Eaton GR (2014). Rapid-Scan EPR of Immobilized Nitroxides. J. Magn. Reson 247 67–71. [DOI] [PMC free article] [PubMed] [Google Scholar]