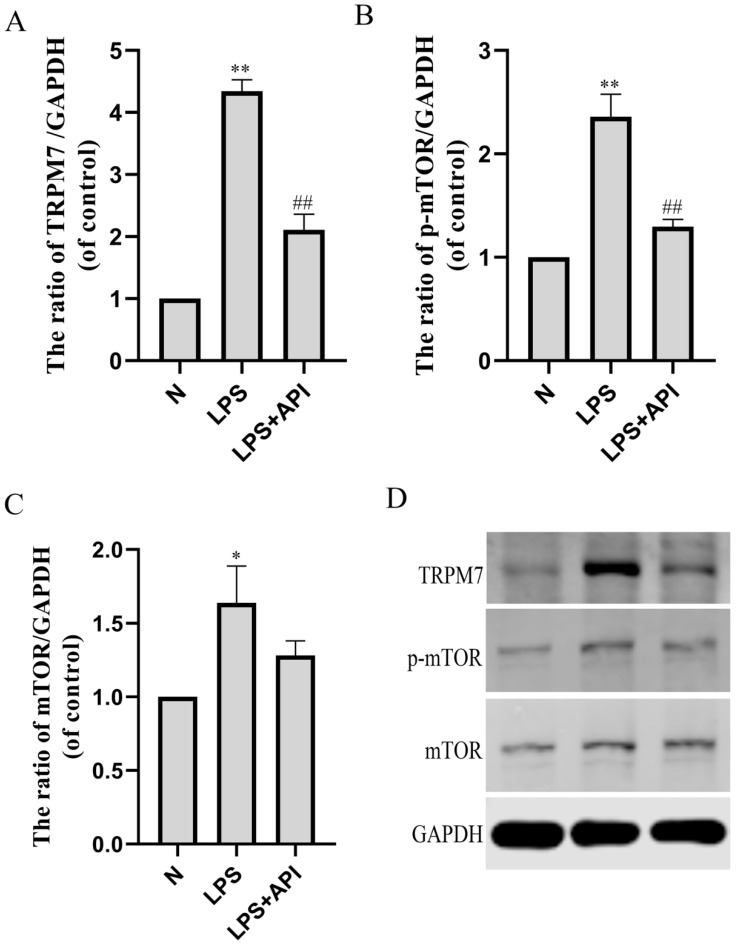
Figure 7.
The effects of apigenin on the TRPM7, p-mTOR, and mTOR levels of macrophages in the macrophage–chondrocyte coculture system. (A) TRPM7 protein level; (B) p-mTOR protein level; (C) mTOR protein level; (D) Representative Western blotting images of TRPM7, p-mTOR, and mTOR. Data are the mean± SD of the mean. * p < 0.05 versus normal group (N); ** p < 0.01 versus normal group (N); ## p < 0.01 versus LPS group.

