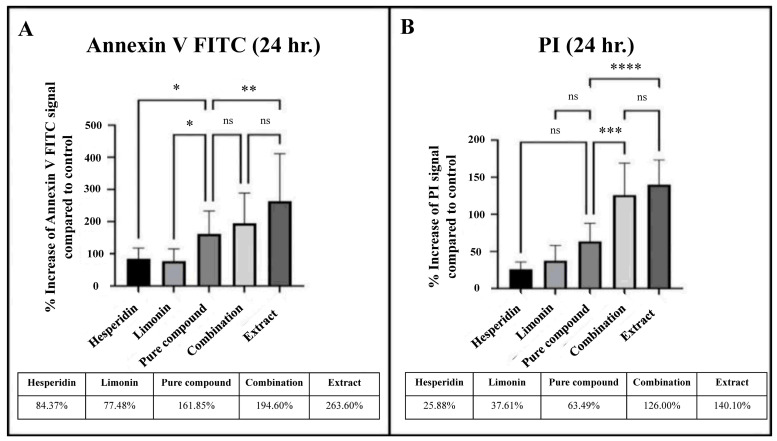
Figure 10.
Percent increase of signal of Annexin V FITC (A) and PI (B) that stained in PLC/PRF/5 human hepatocellular carcinoma cells from flow cytometry analysis at 24 h in each treatment. The statistical differences were analyzed by using one-way ANOVA followed by the Bonferroni comparisons test. The symbol ns, *, **, *** and **** mean p > 0.05, < 0.05, <0.01, <0.001 and <0.0001, respectively.

