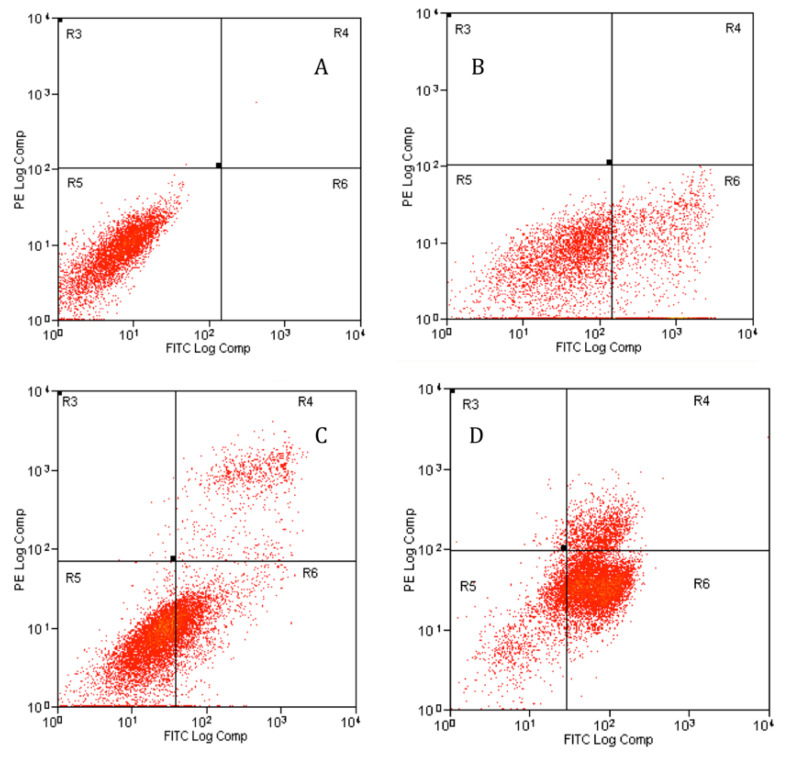
Figure 5.
Annexin V-FITC analysis of PC-3 cells treated with GMG-ITC (3.5 µg/mL) for 24 (B), 48 (C), and 72 (D) hours, with (A) representing the untreated cells. Early apoptosis (Annexin+/PI−) is shown in the lower right quadrant (Q4) for each panel while late apoptosis (Annexin+/PI+) is shown in the upper right quadrant (Q2). Viable cells are represented in the lower left quadrant (Q3). Necrosis (Annexin−/PI+) is shown in the upper left quadrant (Q1). Results represent one of three independent experiments.

