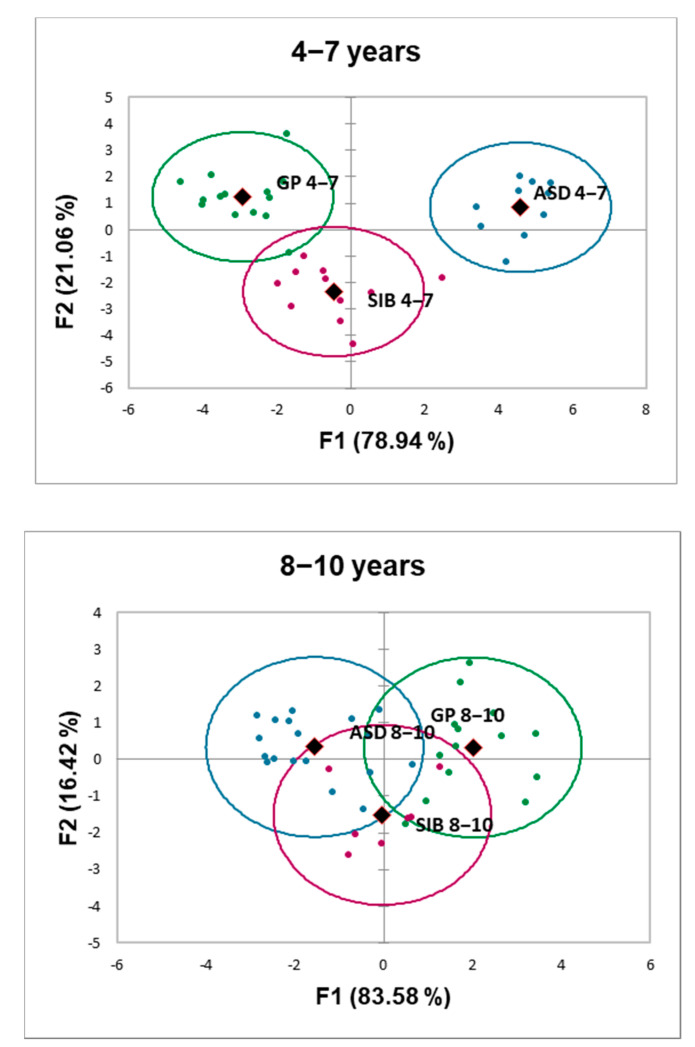
Figure 4.
Projection of the metabolic profiles of the three groups of children stratified by age (4–7 years, and 8–10 years) into the plane formed by the two classification functions (F1 and F2) obtained from the linear discriminant analysis based on fecal levels of 19 protein amino acids excluding proline and cysteine and including the non-protein amino acid ornithine. Blue spots represent autistic children: ASD; green spots represent individuals from the general population (GP); purple spots represent the siblings from autistic children (SIB): Oval lines around individual spots are arbitrarily representing groups based on the profile of compounds analyzed. Centroids are indicated with rhomboid shapes. Percentage of variance explained by each of the two functions is indicated within parentheses in each axis.

