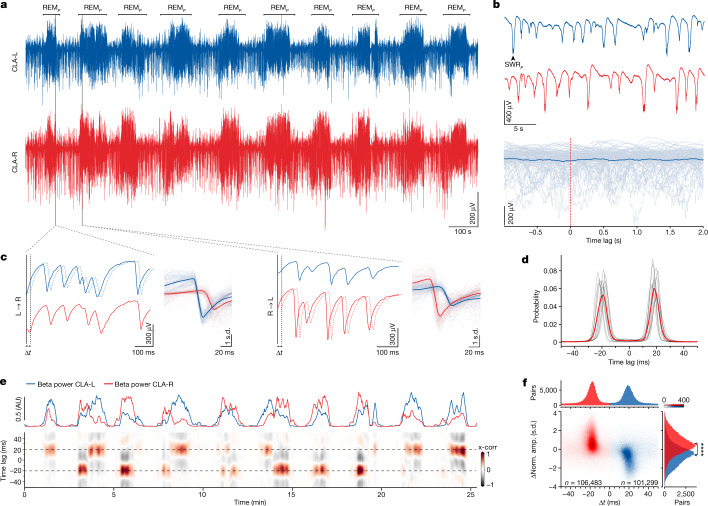
Fig. 2. REMP SNs are tightly coordinated between left and right claustra, but SW sharp-wave ripples are not.
a, Paired recording from left (L, blue) and right (R, red) claustra, showing bilateral correspondence of REMP and SW episodes. b, Top, absence of coordination between sharp-wave ripples (SWRP, for Pogona SWR) in left and right claustra. Bottom, superimposed sweeps from one side (grey) and their average (blue), triggered from 100 single SWRPs from the other side (t = 0). c, Expanded epochs from a during two successive REMP episodes. Note the similarity between left and right traces and the small time-shift between them (filled versus dashed lines). Right, superimposed sweeps of one side triggered on the other (thin lines) and their average over 100 events (thick line). Note the very tight locking of the two traces. Note also that the leading side can switch from one sleep cycle to the next. d, Distributions of peak-correlation lags between left and right sides, showing two symmetric peaks at about ±20 ms (12 nights, 7 animals). Red, average. Data constructed over 9 h of sleep, containing 220,000–260,000 SNs per animal. e, Sliding cross-correlation (x-corr) between left and right traces (bottom) aligned with beta-band power on left and right sides. Positive lag, left side leads. Note that the side in which the beta power is larger leads, and that the leading side occasionally switches, even within the same REMP cycle. Epochs when the beta-band power is low correspond to SW. AU, arbitrary units. f, Differences between side-normalized amplitudes (Norm. amp.) of around 208,000 bilateral pairs of SNs versus the time lag between them (abscissa), and marginal distributions. Colour indicates leadership (lag sign). Note that SNs on the leading side have higher amplitudes than their contralateral partner. Mann–Whitney U-test, U = 2312573585.5, ****P = 0.0. Arrowheads indicate means.

