

Abstract
Global burned area has declined by nearly one quarter between 1998 and 2015. Drylands contain a large proportion of these global fires but there are important differences within the drylands, for example, savannas and tropical dry forests (TDF). Savannas, a biome fire‐prone and fire‐adapted, have reduced the burned area, while the fire in the TDF is one of the most critical factors impacting biodiversity and carbon emissions. Moreover, under climate change scenarios TDF is expected to increase its current extent and raise the risk of fires. Despite regional and global scale effects, and the influence of this ecosystem on the global carbon cycle, little effort has been dedicated to studying the influence of climate (seasonality and extreme events) and socioeconomic conditions of fire regimen in TDF. Here we use the Global Fire Emissions Database and, climate and socioeconomic metrics to better understand long‐term factors explaining the variation in burned area and biomass in TDF at Pantropical scale. On average, fires affected 1.4% of the total TDF' area (60,208 km2) and burned 24.4% (259.6 Tg) of the global burned biomass annually at Pantropical scales. Climate modulators largely influence local and regional fire regimes. Inter‐annual variation in fire regime is shaped by El Niño and La Niña. During the El Niño and the forthcoming year of La Niña, there is an increment in extension (35.2% and 10.3%) and carbon emissions (42.9% and 10.6%). Socioeconomic indicators such as land‐management and population were modulators of the size of both, burned area and carbon emissions. Moreover, fires may reduce the capability to reach the target of “half protected species” in the globe, that is, high‐severity fires are recorded in ecoregions classified as nature could reach half protected. These observations may contribute to improving fire‐management.
Keywords: burned area, carbon emissions, climate and socioeconomic drivers, drought, El Niño/southern oscillation, fire, human factors, La Niña
About 20% of the Pantropical tropical dry forest biomass is affected by fires of which small fires explain most of it. The spatial distribution of small fires is related to socioeconomic and biophysical drivers, while climatic conditions drive large and intense fires. El Niño and the lagged influence of La Niña promote the increment of the burned area in tropical dry forest.

Abstract
El área global quemada se redujo en casi una cuarta parte entre 1998 y 2015. Los bosques secos contienen una gran proporción de esos incendios globales, pero existen diferencias importantes dentro de ellos, por ejemplo, las sabanas y los bosques secos tropicales (SBC). Las sabanas, son un bioma propenso y adaptado al fuego, y que en los últimos años han reducido su área quemada. Mientras que el fuego en la SBC es uno de los factores más críticos que impactan la biodiversidad y las emisiones de carbono. Además, bajo escenarios de cambio climático, se espera que la SBC aumente su extensión actual y aumente el riesgo de incendios. A pesar de los efectos a escala regional y global, y la influencia de este ecosistema en el ciclo global del carbono, se le ha dedicado poco esfuerzo a estudiar la influencia del clima (estacionalidad y eventos extremos) y las condiciones socioeconómicas del régimen de incendios. Aquí usamos la base de datos global de emisiones de incendios y métricas climáticas y socioeconómicas para comprender mejor los factores a largo plazo que explican la variación en el área quemada y la biomasa a escala Pantropical. En promedio, los incendios afectaron el 1,4% del área total de la SBC (60 208 km2) y quemaron el 24,4% (259,6 Tg) de la biomasa global quemada anualmente a escala Pantropical. Los moduladores climáticos influyen en gran medida en los regímenes de incendios locales y regionales. La variación interanual del régimen de incendios está determinada por El Niño y La Niña. Durante El Niño y el año subsecuente de La Niña, se produce un incremento en la extensión (35,2% y 10,3%) y en las emisiones de carbono (42,9% y 10,6%). Los indicadores socioeconómicos como la gestión de la tierra y la población fueron moduladores del tamaño tanto del área quemada como de las emisiones de carbono. Además, los incendios pueden reducir la capacidad de alcanzar el objetivo de “protección de la mitad de las especies” en el mundo, es decir, los incendios de alta gravedad se registran en ecorregiones clasificadas como naturaleza que podría alcanzar la protección de la mitad de su biodiversidad. Estas observaciones pueden contribuir a mejorar la gestión de incendios.
1. INTRODUCTION
Globally biomass burning emits 2.55 Pg of carbon (C) per year, with a decadal increase of ~20% (Akagi et al., 2011). The contribution to C emissions varies among the ecosystems (Abatzoglou et al., 2018; Murphy et al., 2019), with a massive influence of savannas and tropical forest biomes (Andreae & Merlet, 2001; van der Werf et al., 2017), due to vegetation propensity to burn and its large fuel loads (Pan et al., 2011; van der Werf et al., 2017). According to the GFEDv4 (Global Fire Emissions Database) in the Pantropical region, the mean annual C emission by fires is 1.27 Pg (Randerson et al., 2018). Analysis, both at country (Corona‐Núñez et al., 2020) and global scales (van der Werf et al., 2017; Yin et al., 2020), showed the large spatial and temporal variability in tropical fires.
Fire regime is the result of the influence of biophysical modulators, climate and weather, and social drivers (Archibald et al., 2013; Corona‐Núñez et al., 2020; Rogers et al., 2020; van der Werf et al., 2017). On the one hand, it has been recognized that global climatic anomalies influence fires dynamics (Chen et al., 2016; Corona‐Núñez et al., 2020; Yin et al., 2020), as it is on its spatial and temporal patterns, modifications on land‐atmosphere C fluxes, particularly, reducing its potential uptake by vegetation (Exbrayat et al., 2018; Murphy et al., 2019). Complementarily, others have found that weather influences soil and vegetation moisture, which in return, may facilitate or suppress fire (Jiang et al., 2020; van der Werf et al., 2017; Zubkova et al., 2019). On other hand, fires are mostly human‐induced. Different authors (Andela et al., 2017; Archibald et al., 2009; Chuvieco et al., 2008; Jiang et al., 2020; Zubkova et al., 2019) have identified that population, gross domestic product, land‐use/land‐cover type, road density and livestock are key drivers of fires. However, those studies have been focused on the understanding of burned area in savannas, and there is still a knowledge gap on other drylands or their corresponding C emissions, i.e., tropical dry forest or steppe (Bastin et al., 2017). Moreover, there is a limited understanding of the interactions between biophysical and socioeconomic drivers over different spatial scales (Harrison et al., 2021; Vigna et al., 2021).
Global burned area has declined by nearly one quarter between 1998 and 2015 (Andela et al., 2017). However, the tropical ecosystems still exhibit the largest C emissions from fires as well as burned areas (Andela & van der Werf, 2014; Yin et al., 2020). Different authors have suggested that under climate change scenarios, global fires are expected to rise in severity and frequency (Adams, 2013; Masson‐Delmotte et al., 2021; Westerling et al., 2006), while others have found that savannas have reduced their burned area (Andela et al., 2017; Zubkova et al., 2019). Moreover, decadal changes in El Niño over tropical land areas have promoted substantial variability in the “wet convergent regimes get wetter” and “dry divergent regimes get drier” (Gu & Adler, 2018). Thus, it is expected that per fire event will raise the burned biomass and the immediate C emissions to the atmosphere. Therefore, the understanding of key factors that can explain the spatiotemporal variability of fire occurrence in tropical regions is necessary to implement appropriate ecosystems management approaches to mitigate such threats.
According to the Coupled Model Intercomparison Project Phase 6 (CMIP6) simulations for the Shared Socioeconomic Pathways (SSPs) SSP1‐2.6 by 2100, globally the temperature would rise between 0.6–2.0°C, and up‐to 5.7 for the SSP8.5 (Masson‐Delmotte et al., 2021). Moreover, precipitation would reduce between 0.2% and 12.9% for the SSP1 and SSP8.5, respectively. As a result, the global aridity will enhance the expansion of drylands (Wang et al., 2021). Under these future climatic conditions, the tropical forest will exhibit water stress and larger and more severe fires, particularly in drylands. Moreover, others have suggested that there is a global shift in the pyrogeography from savanna dominated to forest dominated (Andela et al., 2017; Jiang et al., 2020). For example, under climate change scenarios savannas are expected to reduce their fire risk due to a suppression of fuel accumulation and fragmentation (Jiang et al., 2020). Meanwhile, the tropical dry forests (TDF) in the immediate future will increase their risk of fires due to the rise of fuel flammability (Fischlin et al., 2009; Hartung et al., 2021).
It is recognized that the tropics cover a high proportion of the global fires, including high fire densities (Chuvieco et al., 2008). However, there are important biological differences within these ecological‐zones, particularly the TDF and the savannas (Griffith et al., 2017; Pennington et al., 2018). Therefore, what is the tropical dry forest? TDF is defined as a vegetation type typically dominated by >50% of deciduous trees, mean annual temperature is ≥25°C, total annual precipitation ranges between a minimum of 250–700 and up‐to 2000 mm, and there are ≥3 dry months every year (Sanchez‐Azofeifa et al., 2005; Tanjina‐Hasnat & Kamal‐Hossain, 2020), and, unlike the savanna biomes, TDFs are characterized by woody tall (>10 m) vegetation with no C4 grass layer and have an intermediate shade‐tolerant tree layer, with a litter layer floor and occasional patches of herbaceous plants including C3 grasses (Charles‐Dominique et al., 2015). Complementarily, savannas are characterized by traits favouring the survival of frequent fires and high herbivore pressure, with a continuous C4 grasses layer and a discontinuous tree cover (Charles‐Dominique et al., 2015). These factors contrast to TDF, frequent fires and/or intense herbivory are key positive feedback maintaining savannas (Ratnam et al., 2011; Sankaran et al., 2008; Staver et al., 2011). Furthermore, TDF is more vulnerable to wildfires than any other forest (Janzen, 1988a; Murphy & Lugo, 1986). Despite a substantial proportion of TDF (~75% of the total area) being subject to frequent and/or intermediate fire return times (Archibald et al., 2013), its flora is not adapted to fire (Dexter et al., 2018) and show a limited post‐fire recovery (Ratnam et al., 2011). Moreover, the TDF and its biodiversity are the most critically endangered (Dinerstein et al., 2017). In the regard, fires are a key driver of disturbance and biodiversity loss in the TDF.
Some forest ecosystems rely on periodic fires for successful stand regeneration (disturbance maintained systems) and fires are part of the natural ecosystem (Bruckman & Pumpanen, 2019). However, fires are a serious ecological threat to the TDF, limiting its restoration and maintenance of dry forest wildlands (Hartung et al., 2021; Janzen, 1988b). Moreover, anthropogenic disturbances are also important, some regions exhibited conversions up‐to 95% of its original extent, and about a third of the global population lives in this ecosystem (Miles et al., 2006). Also, different authors (Otterstrom et al., 2006; Verma et al., 2017) highlighted the necessity to evaluate the interactions between fires and human activities, ecological domains, and climate. Under climate change scenarios the understanding of TDF is crucial because it may expand into areas that are currently dominated by humid forests (Siyum, 2020; Sunderland et al., 2015). However, it has been recognized that TDF suffer notable disregard from research and development strategies, resulting on lack of adequate awareness and policies to counteract the increasing vulnerability of people, ecosystem services and biodiversity (Corona‐Núñez et al., 2021; Mendoza‐Ponce et al., 2020; Siyum, 2020). Consequently, the understanding of how the TDF is affected by the dominant drivers is a major keystone for future socio‐ecological land‐management planning (Kalaba, 2014; Siyum, 2020), particularly for fire mitigation, biodiversity conservation and restoration practices. Here we used the Global Fire Emissions Database to analyze the spatiotemporal dynamic of fires and biomass burning emissions in TDFs at a Pantropical scale between 1997 and 2020. The aims of this study are: (i) analyze the spatiotemporal variability of fire‐severity in terms of burned area and biomass losses in TDFs in the Pantropic; (ii) provide further insights into the state of knowledge of interactions between climate and human factors on TDF fires, and (iii) evaluate the long‐term global impacts and implication of fires for the tropical dry forest biodiversity conservation to identify gaps and priority areas for further research and management activities.
2. METHODS
2.1. Data sources and predictor variables
We used the Global Fire Emissions Database, Version 4.1 (GFED4s) (Randerson et al., 2018). Different studies have shown the applicability and reliability of this data (Bistinas et al., 2013; Brennan et al., 2019; Giglio et al., 2018; Randerson et al., 2018; Yin et al., 2020). GFED4s includes the monthly and daily fire burned above‐ground biomass from 1997 to 2020, for all fire sizes including “small fires”. Burned area covers the period 1997–2016. The information has a spatial resolution of 0.25°. We included small fires to fully capture fire dynamics across the TDF in the Pantropic. Agricultural practices in the TDF are characterized by small‐size shifting cultivation including the use of fire (Hauser & Norgrove, 2013; Janzen, 1988a; Muimba‐Kankolongo, 2018). To ensure that we dominantly evaluated the TDF ecosystem, we crossed the GFED4s database to the realms defined by Dinerstein et al. (2017), similar to others (Zubkova et al., 2019). The realms are redefined and updated from their previous version of the terrestrial ecoregions of the world (Olson et al., 2001). For this study, we included the Tropical & Subtropical Dry Broadleaf Forests and the TDF in Mato Grosso, Brazil (Biudes et al., 2022), and excluded the woody savannas from our analysis, such as the savannas of Africa, Australia and South America (Lehmann et al., 2011; Moncrieff et al., 2016). A total of 52 different ecoregions were included for six Pantropical regions: (i) Caribbean Islands, Central America, and Mexico (CEAM); (ii) Northern Hemisphere South America (including Colombia and Venezuela) (NHSA); (iii) Southern Hemisphere South America (including Bolivia, Brazil, Ecuador, and Peru) (SHSA); (iv) Southern Hemisphere Africa (including Angola, Madagascar, and Zambia) (SAHF); (v) Southeast Asia (including Cambodia, India, Laos, Myanmar, Sri Lanka, Thailand and Vietnam) (SEAS); and (vi) Equatorial Asia (EQAS) (Table S1).
To identify the main drivers of fires, we focused on characterizing the historical socio‐ecological conditions (i.e. climatic, biophysical and socioeconomic drivers) in TDF regions for each grid‐cell at 0.25° resolution (Table S2). For this analysis, we used the most updated and improved biophysical and socio‐economic data at the finest spatial resolution (Table S2). All the selected databases have been used, either for modeling climate change or have been updated based on the most recent climatic modeling. Therefore, our results would be comparable to more recent and future studies. Also, all the spatial information has a global coverage. Overall the spatial resolutions range from 90‐m up to 10‐km, and are interpolated to the common GFED4s grid‐cell of 0.25°.
Climatic variables such as temperature, precipitation and wind speed have been recognized as key drivers of moisture availability and fire propagation (Archibald et al., 2009). Some studies used weather conditions as drivers that modulate variations in ignition efficiency, fire spread rate and fire size (Andela et al., 2017; Jiang et al., 2020; van der Werf et al., 2017), while others included eco‐climatic zones (Chuvieco et al., 2008). Contrasting to previous studies, we used the “near current climate” (1970–2000) data from WorldClim version 2.1 released in 2020′ (Fick & Hijmans, 2017) with a spatial resolution of 1‐km. We used the 19 current bioclimatic variables (Bio1 to Bio19, see Table S2), mean solar radiation, water vapor pressure and wind speed. All the bioclimatic variables are derived from the monthly temperature and rainfall values. The bioclimatic variables represent annual trends (e.g. mean annual temperature, annual precipitation), seasonality (e.g. annual range in temperature and precipitation) and extreme or limiting environmental factors (e.g. temperature of the coldest and warmest month, and precipitation of the wet and dry quarters) (Fick & Hijmans, 2017). Complementarily, from Trabucco and Zomer (2019) we used potential evapotranspiration, and Priestley‐Taylor alpha coefficient (Lhomme, 1997). Precipitation and temperature alone have shown to be inadequate to measure the hydrological condition (Quan et al., 2013), we evaluated water deficiency in the TDF based on two different aridity indexes. The first index considers annual precipitation and temperature (Lang index). The second index further includes reference evapotranspiration (Trabucco & Zomer, 2019). Lang aridity index is the ratio of annual precipitation to the mean annual temperature (mm/°C) (Lang, 1920). This index suggests that the rise of temperature increases water deficiency and makes the air drier if not sufficiently recharged by precipitation and/or underground water (Quan et al., 2013). Trabucco and Zomers aridity index shows moisture availability/deficit for potential growth of reference vegetation excluding the impact of soil mediating water runoff events.
Fuel availability relates to biomass favoring burning. NDVI has been used as a proxy of the conditions of vegetations, particularly to fuel availability (Jiang et al., 2020). However, we propose to use above‐ground biomass (AGB) in live plants as a fuel load proxy, similar to others (Corona‐Núñez et al., 2020; Tang et al., 2021). The AGB dataset refers to the epoch of the years 2000's with a spatial resolution of 1‐km (Avitabile et al., 2016). The AGB was transformed to above‐ground carbon stocks (AGC) assuming a mean C concentration of 47.2% (Corona‐Núñez et al., 2018). To estimate the potential biomass losses from fires, we assumed that the total fuel load refers to the AGB.
Socioeconomic factors have shown to be important drivers of deforestation, forest degradation and modulators of fires frequency and size. In this study, we evaluated population, richness, land accessibility and land‐management as drivers of fires (Andela et al., 2017; Archibald et al., 2009; Chuvieco et al., 2008; Zubkova et al., 2019). We included population density (GPWv4) and gross domestic product (G‐Econ v4) with a resolution of 30 arc‐seconds (CIESIN, 2018). We evaluated the land accessibility by two means. First, we used altitude. Altitude has been a significant driver to understand forest degradation and deforestation in the tropics (Corona‐Núñez et al., 2021; Mendoza‐Ponce et al., 2018). Altitude comes from a digital terrain model with a spatial resolution of 90‐m from the SRTM (Shuttle Radar Topography Mission—V.2.1, NASA). Secondly, we used road density at a resolution of 5 arc‐min (Meijer et al., 2018). Roads have shown to be important drivers to explain burned area (Archibald & Roy, 2009; Zubkova et al., 2019) and TDF degradation (Corona‐Núñez et al., 2021). To integrate land‐management practices we included the proportion of croplands, irrigated agriculture (Ramankutty et al., 2010a) and pastures (Ramankutty et al., 2010b) within 5 arc‐min grid‐cell, similar approach undertaken by others (Andela et al., 2017; Archibald et al., 2009; Chuvieco et al., 2008; Zubkova et al., 2019). The global croplands, irrigated agriculture and pastures data set represents the proportion of land areas used in the year 2000. This data was estimated from MODIS and SPOT sensors combined with inventory data (Ramankutty et al., 2008).
2.2. Calculations and statistical analyses
To understand the spatial variability of fires, the data was evaluated with multiple geographical combinations. The finest analysis was performed at grid‐level, followed by 52 ecoregions; 6 Pantropical regions; 4 Realm regions; Northern versus Southern Hemispheres and Pantropics. Complementarily, we added the ecological conditions of each grid‐cell by aggregating the aridity, fuel loads and the half protected ecoregion goals. Furthermore, we performed diverse temporal aggregations. From the GFED4s database, we derived the temporal variability of fires at seasonal scale by summing fire extension and biomass depletion by fires per grid‐cell for each calendar month and annually.
We evaluated the fire‐severity as the TDF burned biomass, which reflects the impact of the fire on ecosystem properties (Keeley, 2008). We considered the total area affected, annual biomass losses, and the mean burned biomass divided by the burned area (mg of burned dry matter per hectare). Mean burned area refers to the mean annual fire size within each‐grid cell for the period 1997–2016. To reduce the spatial and temporal variability due to inter‐annual variability, all the monthly and annual information was aggregated for the whole studied period (1997–2020) by an arithmetical mean. This aggregation enables a better understanding of dominant modifiers of fires without the influence of extreme climatic events such as El Niño and La Niña, or socioeconomic modifications. i.e., changes in presidential administrations are responsible of policy‐driven shifts in national economy, which may promote political and economical crisis that may favor increases of deforestation and fires (Antonarakis et al., 2022; Simmons et al., 2018).
To represent the long‐term amplitude of fires variability to the long‐term mean, we calculated its standard deviation (SD) for the same period. To test the statistical similarity between observations we used the Wilcoxon rank‐sum test (W‐test) with continuity correction, assuming that the observations come from independent samples with different variances. The normality of the observations was evaluated with the Jarque‐Bera test (JB‐test). When the information was not normally distributed, we LOG transformed the information before the calculation of the arithmetic mean and the SD. The uncertainty of our estimates is based on the confidence interval of each measurement taken into consideration during the analysis.
To identify drivers of burned area some authors have used: (1) linear regression (Andela et al., 2017; Zubkova et al., 2019) and (2) RandomForest (Archibald et al., 2009; Jiang et al., 2020). These regressions aim to find the relationship between a dependent variable (burned area) and one or more independent variables (drivers) by minimizing the vertical difference. In both instances, these regressions assume independence between predictor variables. However, climatic and anthropogenic factors often show antagonistic and non‐linear behaviors (Aldersley et al., 2011). In this study, we associate climatic and socioeconomic influencers of the affected area and burned biomass based on principal component analysis (PCA). We selected the PCA analysis because it allows for reducing the dimensionality of interrelated variables, providing insights into their interrelations and suggesting simpler interpretations of the original data (Jollife, 2002; Wilks, 2011), while retaining most of the variance of the original dataset (Jollife, 2002). Moreover, PCA solves the multicollinearity problem by the creation of the “components” among the original explanatory variables. These new components are uncorrelated and orthogonal to each other (Gwelo, 2019). Principal component rotation is used to simplify the interpretation of the PCs (dimensions) and to further separate the main direction of variability. The rotated PCA analysis identifies dominant variables that modify fire dynamics. We evaluated the resulting PC as risk indices that combine multiple elements and that aim to represent biophysical and socioeconomic influencers affecting fire dynamics and fire characteristics (burned area and severity). The purpose of the aggregation of variables of different nature is to identify fire‐events from a socio‐ecological perspective. In this form, we integrate additively biophysical conditions that influence fire dynamics (e.g., high water deficit or high fuel loads), and socioeconomic conditions that could induce fires and/or reinforce fire dynamics. The PCA information was centered to zero and scaled to have a unit variance to equally weight the drivers. Varimax normalized rotation was applied to the retained PCs. All tests were performed with a 95% confidence level and were conducted using R software version 3.5.2 (R‐Core‐Team, 2018). We used the libraries raster (Hijmans et al., 2020), pcaMethods (Stacklies et al., 2007) and factoextra (Alboukadel, 2020).
3. RESULTS
The TDFs cover 4,533,879 km2 (~3.3% of the total ice‐free Earth's terrestrial surface) (Table S1). This area includes inland and islands. The total extent of the TDF has a slight difference between hemispheres. The Northern Hemisphere (NH) contains 52.5% of the global TDF biome. In continental scales, the Neotropics contains the largest proportion of the total TDF surface (57.2%), followed by the Indomalayan (35.0%). A smaller representation was recorded, following the order, Afrotropics (4.6%) > Australasia (3.1%) > Oceania (0.1%).
In the TDF, the mean altitude is 390 ± 432 m (mean ± 1 SD). Mean annual temperature is 25.2 ± 2.2°C and mean annual rainfall of 1195 ± 488 mm. The Lang aridity index largely falls within 10 to 100 mm/°C with a mean of 47.3 ± 18.9 mm/°C. Solar radiation has a mean of 18,126 ± 1785 (kJ m−2 day−1), vapor pressure 2.2 ± 0.4 (kPa) and wind speed 1.9 ± 0.6 (m s−1). Socioeconomic factors show that across regions the road density is 317 ± 452 m per km2, crop systems cover 25.3 ± 24.7% of the land, and pastures 18.0 ± 19.9% of the land (Table S3). Together, cropland and pastures cover 43.3 ± 25.0%. In the Pantropic is estimated a fuel load of 18,907.2 Tg (Table S4), of which the majority is in the Southern Hemisphere (SH) (61.2%). The fuel load ranges from 1 to 283 Mg ha−1 (41.2 ± 7.5 Mg ha−1). SH doubles the mean fuel loads (57.3 ± 2.8 Mg ha−1) to those estimated for the NH (24.7 ± 2.0 Mg ha−1) (p < .001).
3.1. Annual variability of fires
On average, fires affects 60,208 ± 9587 km2 (1.4% of total TDF's area) every year (Figure 1a) and a mean annual burned biomass of 259.6 ± 86.4 Tg, with a burned biomass density of 42.1 ± 8.8 Mg ha−1 (Figure 1b). Annual burned area is constrained in the NH (on average 56.2 ± 6.5% of the total burned TDF land; Figure 1d), reflecting a similar proportion of the distribution of this ecosystem in this Hemisphere (see above). On average, fires in NH burn 83.6 ± 16.5 Tg of biomass per year (Figure 1e) (35.1 ± 10.9% of the total burned TDF biomass) with an annually burned biomass density of 24.9 ± 3.1 Mg ha−1. In contrast, while the SH exhibits lower burned areas than NH (175.9 ± 86.2; Figure 1g; p = .002), it shows more severe fire intensities (175.9 ± 86.2 Tg of burned biomass per year; representing 64.9 ± 10.9% of the Pantropical burned biomass) (p < .001) (with a greater burned biomass density than the Northern counterpart: 62.7 ± 15.6 Mg ha−1; Figure 1h; p < .001).
FIGURE 1.
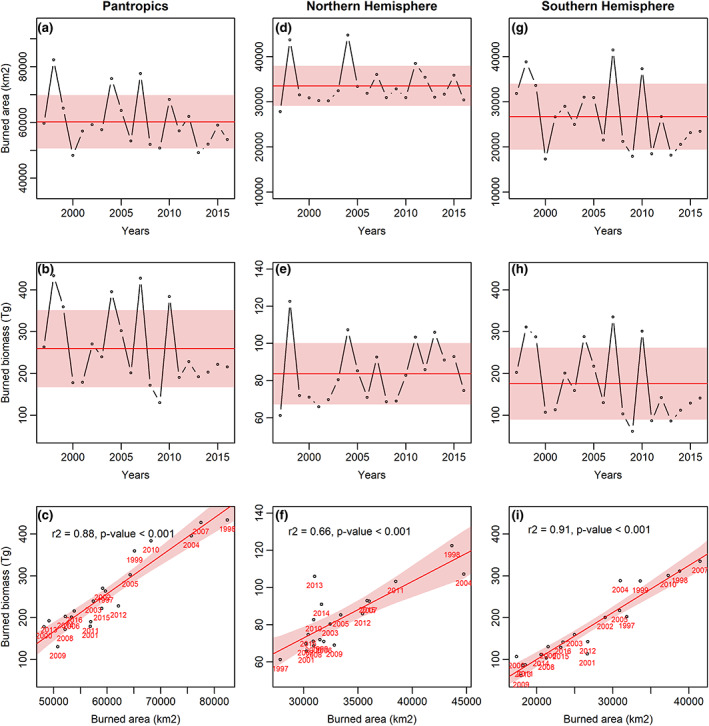
Time series of burned area (top row), burned biomass (middle row) and relationship between burned area and burned biomass (bottom row) between 1997 and 2020 at pantropical scale (a–c), and hemisphere partitioning (d–i). In the top and middle rows, the red line and shading refer to the mean ± 1 SD. In bottom row the red line expresses the regression line with the 95% confidence interval, with the year of each observation indicated in red. **Color online only.
Total burned biomass in the TDF relates strongly to the total burned area at Pantropical scale (Figure 1c; r 2 = .85, p < .001). This relationship is stronger in the SH (Figure 1i; r 2 = .91, p < .001) than in the NH (Figure 1f; r 2 = .66, p < .001), while burned area between hemispheres shows an inverse, but non‐significant relationship (r 2 = .03, p = .20), while burned biomass shows a positive but, also, non‐significant relationship (r 2 = .04, p = .19; Figure S1). Interestingly, the NH exhibits higher burned biomass in relation to a smaller affected area occurred in the years 2010, 2013 and 2014 (Figure 1f), meanwhile, SH shows that higher severe fires were observed in years 1999, 2000 and 2004 (Figure 1i).
3.2. Seasonal patterns of fires
Due to the large temporal variability of fires across the Pantropic, there are statistical differences among monthly burned areas per grid‐cell (p < .001; Figure 2a). However, the monthly Pantropical burned area varied within the year and shows two modes (Figure 2a). The largest proportions of fires are constrained between January and May (49.4%) by the influence of NH (Figure 2b) and between July and October (35.8%) by the influence of fires in the SH (Figure 2c). In the NH, 89.2% of the annual burned area occurred during the period December to May, meanwhile, in the SH most of the burned area is concentrated between June to November (86.5%). In both Hemispheres, these months correspond to winter (49.1%) and spring (38.9%) (Figure 2d). Summer and autumn are the seasons that show the lowest affected area (5.1% and 6.9%, respectively).
FIGURE 2.
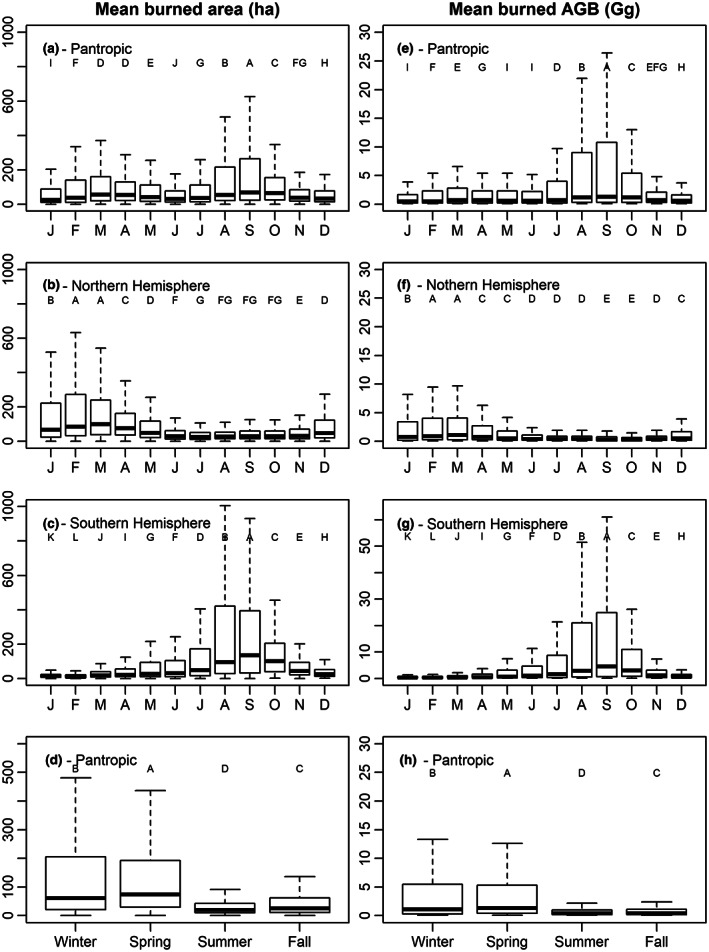
Mean burned areas (a–c) and burned biomass (e–g) between 1997 and 2020 at pantropical scale, and hemisphere partitioning. Boxplots of the seasonality of burned areas (d) and burned biomass (h) in the pantropic. Different uppercase letters represent clusters of the monthly observations with statistically differences (p < .05).
In the Pantropic, the largest burned biomass happens from July to October (59.1%), mainly driven by the influence of SH (Figure 2e–g). In the NH, 77.3% of the annual burned biomass is constrained between January and April, while in the SH it is 82.9% of its total burned biomass. Moreover, spring and winter concentrate 45.7% and 46.4% of the Pantropic burned biomass, respectively (Figure 2h).
3.3. Spatial variability of burned area, burned biomass and fuel consumption
Fire dynamics are different across regions (Figures 3 and 4). The most extensive fires mainly happen in the SAHF (Afrotropics) (2452.1 ± 3.6 ha). All other regions exhibit less extensive fires, and the burned area decreased following the order CEAM (Neotropic) 358.6 ± 6.0 ha > NHSA (Neotropic) 342.8 ± 3.6 ha > SHSA (Neotropic) 257.5 ± 5.6 ha ~ SEAS (Indomalaya) 248.9 ± 6.9 ha > EQAS (Australasia) 134.2 ± 6.0 ha (Table S4). Only SHSA and SEAS show statistically similar values in burned areas (p = .08). In contrast, variations in burned biomass across the other regions were lower. Most burned biomass occurred in SAHF (55.0 ± 3.0 Gg) (p < .001). The SHSA (24.5 ± 5.2 Gg), SEAS (19.9 ± 4.1 Gg), CEAM (17.2 ± 2.7 Gg) and EQAS (14.0 ± 2.8 Gg) are relatively similar (p > .05). EQAS regions do not differ to NHSA (12.2 ± 2.8 Gg) (p = .23) (Table S4).
FIGURE 3.
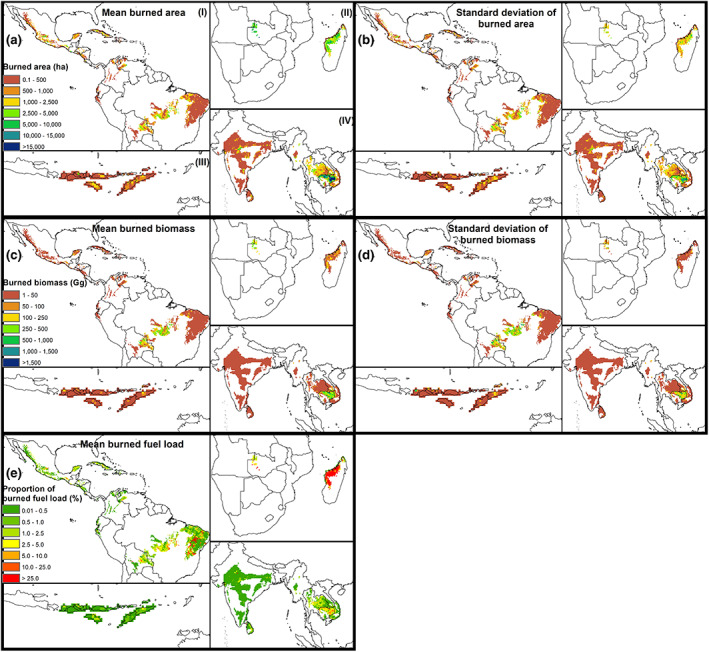
Distribution of burned area, burned biomass, and fuel consumption as the proportion of burned biomass in relation to the fuel load in (I) Neotropics including the regions Caribbean Islands, Central America, and Mexico (CEAM), northern hemisphere South America (NHSA) and southern hemisphere South America (SHSA), (II) Afrotropic containing the region southern hemisphere Africa (SAHF), (III) equatorial Asia (EQAS), and (IV) Southeast Asia (SEAS) between 1997 and 2020. Color bars show the magnitudes for the mean and its standard deviation. White background refers to NoData. Top row refers to the (a) mean and (b) standard deviation of burned area in hectares, while middle row expresses the (c) mean and (d) standard deviation of burned biomass in gg and the bottom row presents the (e) mean ratio of the burned biomass in relation to fuel load (this panel is complemented with Figure 4c). The bottom figure cannot be expressed with a standard deviation due to lack of annual fuel loads data, consequently mean burned biomass refers to the mean of the period 1997–2020. In all cases, the information relates to a grid cell of 0.25° and they are the result of the multiple‐year aggregation (1997–2020). **Color online only. Map lines delineate study areas and do not necessarily depict accepted national boundaries.
FIGURE 4.
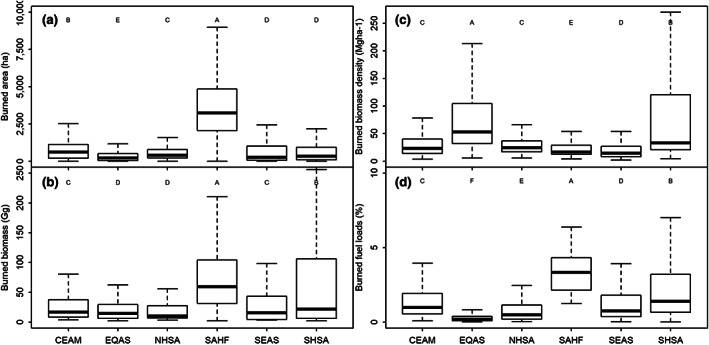
Tropical dry forest burned area (a), burned biomass (b), burned biomass density (the ratio of burned biomass and burned area) (c), and proportion of burned biomass in relation to the fuel load (d). Pantropical regions are the Caribbean Islands, Central America, and Mexico (CEAM); equatorial Asia (EQAS); northern hemisphere South America (NHSA); southern hemisphere Africa (SAHF); Southeast Asia (SEAS); and southern hemisphere South America (SHAS). Different uppercase letters represent clusters of the regional observations with statistically differences (p < .05).
Fires burn 3.2 ± 1.3% of the TDF biomass in the Pantropic (Figure 4d). However, the proportion of burned biomass in relation to the total biomass (fuel consumption) within the grid‐cells varied across regions (Figures 3 and 4d; p < .001), decreasing in the order SAHF (3.3 ± 2.1%) > SHSA (1.4 ± 4.1%) > CEAM (1.0 ± 2.5%) > SEAS (0.8 ± 3.1%) > NHSA (0.5 ± 3.4%) > EQAS (0.2 ± 3.1%) (Figure 4d). Caatinga showed the largest mean proportion of burned fuel loads (28.0 ± 13.4%) and Irrawaddy dry forests (25.7 ± 0.1%), followed by Zambezian evergreen dry forests (18.2 ± 0.3%). The Madagascar dry deciduous forest was excluded from the analysis because of a potential incompatibility between datasets, its burned biomass represents 186.8 ± 6.6% of the fuel loads (Table S4). The regions with the lowest proportion of burned biomass are the New Caledonia dry forests, Puerto Rican dry forests, Sierra de la Laguna dry forests, Lesser Antillean dry forests, Fiji tropical dry forests and Marianas tropical dry forests, all with values <0.1%.
3.4. Climate and socioeconomic influences on fires
The first three components from the PCA for burned area and biomass account for 95.8% of the total variance of the dataset (Table S5). The loading factors of varimax normalized rotation can separate realms (Figure S2), Pantropical regions (Figure S3), aridity classes (Figure S4), and biomass fuel loads (Figure S5) into two dominant groups: (1) classes affected by fire size (Afrotropic and Indomalayan; CEAM, SAHF, SEAS and NHSA; arid and semiarid regions; and fuel loads ≥100 Mg ha−1), and (2) classes influenced by fire severity (Australasia and Neotropic; EQAS and SHSA; sub‐humid regions; and fuel loads ≥100 Mg ha−1).
The first three components from the PCA for the socioeconomic and biophysical drivers of fires account for 62.8% of the total variance of the dataset (Table S6). The PC biplot can be separated in four quadrants (Figures 5 and 6; Figure S6). The first quadrant refers to water availability during dry season, driest month, and quarter, and the proportion of pasture cover. The second quadrant relates to water deficit (aridity, different combination of temperature data and fuel loads), the third quadrant groups refers to the socioeconomic factors (gross domestic product, population density, and road density), anthropogenic covers (cropland and irrigated agriculture) and the fourth quadrant concentrates altitude, wind speed and mean diurnal range temperature. These factors influence dissimilarly the burned area, burned biomass and burned biomass density at Pantropical scale.
FIGURE 5.
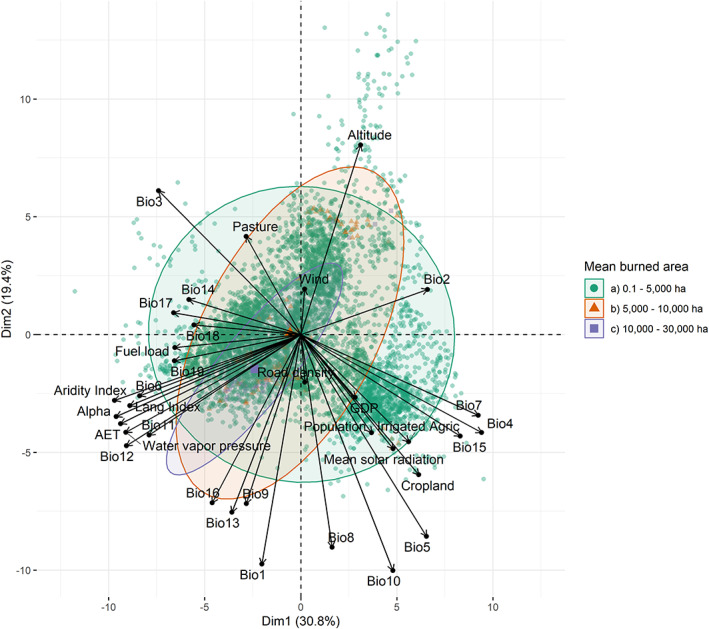
Principal components analysis biplots of the biophysical and socioeconomic influencers of burned area. Green symbols mean burned areas from 0.1 to 5000 ha; red symbols mean burned areas >5000 to 10,000 ha; lilac symbols mean burned areas >10,000 to 30,000 ha. For abbreviations see Table S2. In Table S6 are reported all the objects in the spaces of the first three principal components. In Figure S7 is included a correlation matrix. **Color online only.
FIGURE 6.
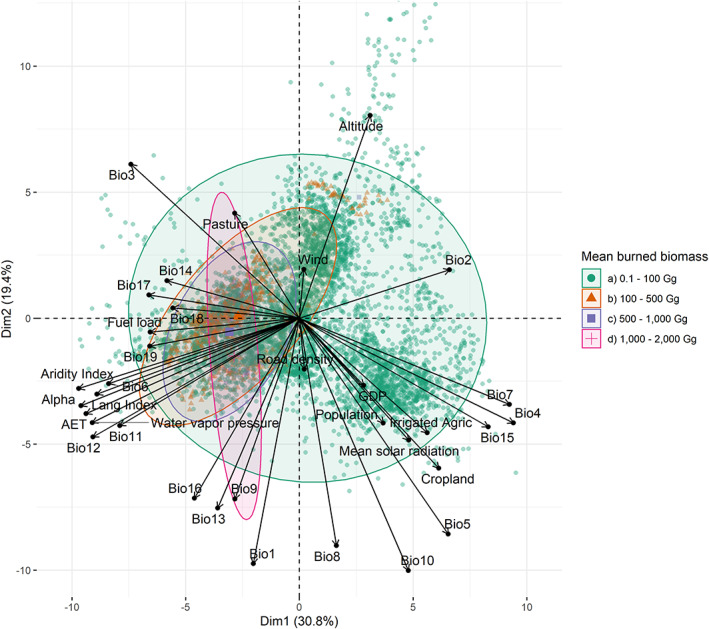
Principal components analysis biplots of the biophysical and socioeconomic influencers of burned biomass. Green symbols mean burned biomasses from 0.1 to 100 gg; red symbols mean burned biomasses >100 to 500 gg; lilac symbols mean burned biomasses >500 to 1000 gg; pink symbols mean burned biomasses >1000 to 2000 gg. For abbreviations see Table S2. In Table S6 are reported all the objects in the spaces of the first three principal components. In Figure S7 is included a correlation matrix. **Color online only.
The PCA shows that the main drivers sorted by influence are: temperature indexes, altitude, aridity indexes, precipitation indexes, fuel load, land‐management, and socioeconomic factors (Figures 5 and 6). The top‐three climatic variables related to temperature: Mean Temperature of Warmest Quarter (Bio10) > Max Temperature of Warmest Month (Bio5) > Annual Mean Temperature (Bio1). The aridity indexes performed similarly but the Trabucco and Zomers aridity index showed a slightly stronger influence than Lang index. The climatic factors that modulate less importantly are Precipitation of Warmest Quarter (Bio18) ≥ Precipitation of Driest Month (Bio14) ≥ windspeed. Socioeconomic factors are mainly driven by land‐management practices (cropland > irrigated agriculture > pastures) ≥ population density ≥ GDP ≥ road density.
Environmental and human drivers influence the size of the burned area and fire severity differently. In this study, we found that dominant drivers of fires could be categorized into three classes of burned area (small, moderate and large fires; Figure 5). The global mean of small (719.5 ± 582.1 ha), moderate (6786.9 ± 2932.2 ha) and large (17,427.1 ± 6784.2 ha) fires represent 67.3%, 15.2%, and 17.5% of the total burned area, respectively. In a similar manner, burned biomass is also categorized into three classes (small, moderate and severe fires). Small (23.1 ± 23.5 Gg), moderate (262.0 ± 146.7), and severe (1397.2 ± 303.4 Gg) represent 27.1%, 70.8% and 2.1% of the total burned biomass, respectively. Interestingly, 80.2% of the total burned biomass happens in small‐fires ≤5000 ha, while moderate (5000–10,000 ha) and large (>10,000 ha) fires affect 10.8% and 9.0% of the total burned biomass in the TDF, respectively.
Sub‐classes of fires ≤5000 ha were influenced similarly by the same drivers. Small burned areas (≤5000 ha) showed that biophysical and socioeconomic variables, such as the presence of pastures and cropland, impact similarly. Moderate fires (5000–10,000 ha) are driven mainly by biophysical, and less importantly by socioeconomic drivers. Large burned areas (>10,000 ha) are dominated by climatic drivers, particularly those related with water stress (temperature, aridity metrics and precipitation; Figure 5). Small fires (≤100 Gg) are related similarly to biophysical and socioeconomic drivers. Moderate fires (100–1000 Gg) are affected dominantly by biophysical drivers, but socioeconomic drivers and fuel loads have a moderate impact on the performance of these fires. In contrast, more severe fires (>1000 Gg of burned biomass) are mainly driven by climatic drivers, particularly those related to water deficit (Figure 6). Comparatively, mean burned biomass densities are affected differently in dependence of the fire severity. Low‐severity fires (≤10 Mg ha−1) are equally affected by biophysical and socioeconomic drivers. High‐severity fires (>10 Mg ha−1) are dominantly influenced by climatic factors and fuel loads, and less importantly to socioeconomic factors (Figure S6).
3.5. Influence of El Niño and La Niña on fires
In the Pantropics on average, the burned area in a year without extreme climatic events (“No El Niño or La Niña year”) is 56,174 ± 5830 km2, similar estimate to the whole period (p = .39). During the El Niño climatic events, the mean burned area is 75,968 ± 5907 km2. This estimate represents 35.2% more affected area than the annual mean without extreme climatic events (p < .001). The NH returned an increment of 21.7% burned area during El Niño (p = .037), while the SH was 53.0% (p = .002). We did not find any statistical difference to suggest that El Niño has a lagged effect on burned area or burned biomass (p > .52). During La Niña climatic events, burned area did not show any statistical difference to the annual mean in Pantropical, SH or NH scales (p > .48). The lagged effect of La Niña promoted an increment of burned area (10.3%, 6.5% and 15.3%, respectively to Pantropics, NH and SH) but this increment is not significant as for the annual mean values (p > .11; Figure 7).
FIGURE 7.
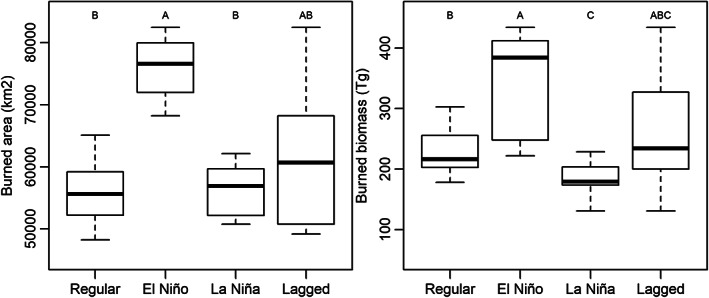
Boxplots of the influence of climatic anomalies on mean burned area and burned biomass between 1997 and 2020 at Pantropical scale. Regular refers to years without extreme climatic events (“No El Niño or La Niña year”). El Niño and La Niña refers to the climatic anomalies such as warm and cold global episodes based on a threshold of ±0.5°C for the Oceanic Niño Index (NOAA, 2021). Lagged refers to the forthcoming year after La Niña year. Different uppercase letters represent clusters with statistically differences (p < .05).
The mean burned biomass during “No El Niño or La Niña year” is 235.8 ± 54.6 Tg, similar estimate to the whole period (p = .89). During El Niño fires are more severe (p < .01) and the mean burned biomass increments to 336.9 ± 93.7 Tg in the Pantropics, 98.8 ± 12.8 Tg for the NH and 238.1 ± 89.9 Tg for the SH. These increments represent a rise of 42.9%, 23.0% and 53.1%, respectively (p < .02). Conversely, during La Niña years, we recorded a reduction in burned biomass of 21.8%, 5.0% and 31.8%, for the same regions. In the Pantropic and SH, the difference is significant (p = .017 and .046, respectively). However, the forthcoming year after La Niña is a rise of 10.6%, 9.0% and 11.5%, respectively, in contrast to the “No El Niño or La Niña year”. However, there are not statistical differences (p > .31).
4. DISCUSSION
4.1. Pantropical burned area and biomass burning variability in tropical dry forests
Global studies have suggested that fires in drylands, including TDF and/or savannas, have reduced their frequency (Xu et al., 2021; Yin et al., 2020) and burned area (Jiang et al., 2020; Zubkova et al., 2019). These studies overtaken in the TDF have shown that fires have reduced their frequency when compared to the first decade of 2000s, a period of which fires emitted more C than to its subsequent decade when it was induced the recapture during postfire regrowth. Our study shows that there is a contrasting pattern in burned areas and burned biomass between hemispheres, and larger differences were recorded across ecoregions. For example, NH did not differ with its past trends in burned area, while the SH may suggest a slight reduction in the size of fires, but this can be only understood based on the dominant influence of cold global episodes (La Niña) between 2007 and 2010. A similar trend was observed for burned biomass. Moreover, our study supports that global fire dynamics in the TDFs are affected by climatic anomalies such as warmer or colder western/eastern Pacific Ocean based on the threshold of ±0.5°C for the Oceanic Niño Index (NOAA, 2021). El Niño and La Niña episodes explain inter‐annual variability in biomass burning in tropical forests (Chen et al., 2016).
The climatic extreme events in the TDF are an important driver of global C cycle. El Niño has been suggested as a climatic phenomenon that has impacted fire dynamics on continental (van der Werf et al., 2004) and national (Corona‐Núñez et al., 2020) scales with lagged effects in the tropical forest biome (Liu et al., 2017). Particularly, during La Niña years the rainfall is enhanced promoting an extended moisture period in soil and vegetation (Andela et al., 2013; Corona‐Núñez et al., 2020), favoring the ecosystem productivity and fuel accumulation, which increases the fuel flammability in subsequent dry years. Meanwhile during El Niño years the precipitation in the TDFs reduces, affecting the water content in live vegetation and in litter, which facilitates the propagation of fires by crown and surface fires. Drought modifies the spatial connectivity of dry fine fuels, and the surface weather conditions that promote rapid wildfire growth. The combined conditions of dry fine fuels and weather facilitate the development of large wildfires (Nolan et al., 2016). Our study shows that El Niño and La Niña periods have influence on extension and C emissions in TDF at Pantropical scale. We found that during El Niño the burned area in the TDF increases 35.2% and up‐to 42.9% in C emissions. These estimates are higher than those reported by other authors for the Pantropics that indicated ranges between 4%–5% (Burton et al., 2020) and 33% (Chen et al., 2017). Conversely, La Niña promoted only reduction in burned biomass, similar results to other Pantropical study (Chen et al., 2017). Possibly we are recording for the first time a lagged effect of La Niña at Pantropical scale. This lagged effect induces increments in the amount of burned area and biomass in ~10% during the upcoming year, releasing part of the C that did not burn during La Niña's year, similar observation done for Mexico (Corona‐Núñez et al., 2020).
4.2. Biophysical and human drivers of tropical dry forest fires
Fire dynamics in the TDF contrasts across the Pantropic. Topography, fuels, moisture and human conditions are key drivers locally, while climate modify fire severity at both local and regional scales (Archibald et al., 2009; Corona‐Núñez et al., 2020; Fréjaville & Curt, 2017). This study suggests that in the TDFs there are emergent patterns that arise from complex interactions between temperature, water availability, fuel loads and socioeconomic factors. Our study suggests that local and regional‐scale socioeconomic conditions explain the Pantropical biomass burning variability in TDF as occurs in other ecosystems (Andela et al., 2017; Arora & Melton, 2018; Bistinas et al., 2014; Ferrara et al., 2019; Zubkova et al., 2019). For example, fires tend to be grouped on “large affected areas with low biomass burning” as occurs in the Afrotropic and Indomalayan biogeographic regions, or “small to large fires with higher biomass burning” as the case of the Neotropic. Moreover, fire severity shows large variability within the Neotropic; the SH of South America showed higher burned biomass densities than the Caribbean Islands, Central America, and Mexico, and the NH of South America. These differences in fire severity within Neotropic are related to the aridity, where fires in arid and semi‐arid regions are related to larger burned areas. This contrasts with the sub‐humid regions that are dominated by more severe fires (larger burned biomass). Our study supports that the affected area by fires is influenced locally by the ecosystem characteristics such as fuel loads that favored the fire spreads in the landscape (Arora & Melton, 2018; Bistinas et al., 2014; Xu et al., 2021).
The TDF can be seen as a water‐limited ecosystem. The TDF exhibits a strong seasonality related to water availability (Corona‐Núñez et al., 2018) that promotes fuel load accumulation and under dry conditions increases its flammability, similar observation to southern Congolese rainforest edges (Jiang et al., 2020). In this context, in India local studies (Kodandapani et al., 2008) found that TDF with lower fuel loads were more related to larger and frequent fires than those TDF with higher fuel loads, similar observation were done by Bistinas et al. (2014) and our study. Also, in the TDF “small fires or small burned biomass” are more strongly related by the influence of socioeconomic conditions, including fire‐induced management practices. Small fires are related to agricultural waste or prescribed burning in forest plantations (Andela et al., 2019; Randerson et al., 2012). Population, crops, and pastures in the TDF arise because regions with these conditions are related to rural population that base their subsistence on fire‐induced land‐management practices such as shifting cultivation (Vigna et al., 2021) or fire‐induced grasses for cattle ranching (Corona et al., 2016; Trejo, 2008). Accessibility, cropland and cattle ranching management practices represent the main factors facilitating locally fire spread in the TDF, similar observation done for anthropogenic TDF disturbances in Mexico (Corona‐Núñez et al., 2021) and for the African savannas (Andela et al., 2017; Zubkova et al., 2019).
Large and high‐severity fires are controlled by climatic drivers, particularly those related to temperature and water stress. In the TDF, climate affects rainfall distribution within the year, and seasonal drought impacts fuel abundance and composition through vegetation productivity and fuel water content. These conditions influence differently across the drylands. On the one hand, in the African savannas reductions in burned area related to mild decreases in humidity (Jiang et al., 2020). On the other hand, in the TDF low humidity dries out TDF plants and litter, raising the flammability of fuel load. Moreover, we found that local and global climate conditions explain large fires with higher burned biomass. For example, water stress dominates the fire episodes in TDFs promoting years of extraordinary lower or higher burned area or burned biomass. Consequently, fires may enhance its severity and frequency under climate change scenario (IPCC, 2013). Interestingly, these results contrast to the socioeconomic factors that showed a limited influence on these types of fires, suggesting that climatic conditions are more related to wildfires dynamics. Moreover, small fires showed that are more influenced by socioeconomic drivers than large fires and severe fires. Therefore, to decreasing burned area and biomass losses and to promote C sequestration it is necessary better fire‐management controls and the improvement in agricultural practices by the integration of local and regional biophysical and socioeconomic conditions. Specifically, it is necessary to develop initiatives to avoid damage nearby areas when fires escape control, particularly during drier years. Therefore, it is important to implement differential regional land‐management practices between hemispheres and ecoregions to control fire severity.
Regional socio‐economic conditions lead to fire dynamics in the TDFs. Our results support, as other global studies (Bistinas et al., 2013; Knorr et al., 2014), that regional socio‐economic factors, such as population densities (with a peak at 20 people per km2; Arora & Melton, 2018), cropland densities and gross domestic product, related to lower fire‐affected areas (Archibald et al., 2009; Chuvieco et al., 2008). We found that ecoregions with population densities <10 people per km2 exhibit the largest burned areas and biomass burning. Human‐dominated landscapes, such as large cropland densities resulted in higher affected area and burned biomass, similar to others (Andela et al., 2019), but opposite to other global studies that found that the suppression of fire was mainly related to higher cropland fraction and/or population density, resulting on fragmentized landscapes that reduced the fire propagation (Harrison et al., 2021; Lasslop & Kloster, 2017). Interestingly, the larger the proportions of pastures, the lower mean burned area, similar observation done for other regions (Bistinas et al., 2014; Moreira et al., 2011). This can be related to the fact that pastures are transformed to more extensive management which does not need fire to induce grasses re‐growth. Consequently, future global studies would be beneficial if they distinguish major global drylands types by subcontinental regions and its dominant socio‐economic drivers. Also, fire management policies should aim in minimizing fire dispersal, and preventing its anthropogenic induced ignition during severe droughts.
4.3. Global impacts and implication of fires for the tropical dry forest conservation
There is ample literature that evaluates the impacts of major pressures on the TDFs by different cumulative impacts over different temporal and spatial scales (Lü et al., 2021) such as deforestation and forest degradation by selective wood extraction (Corona‐Núñez et al., 2021; Mendoza‐Ponce et al., 2018; Xu et al., 2021) and fires (Corona‐Núñez et al., 2020; Hartung et al., 2021; Yin et al., 2020). However, little is known about the consequences of fires on the TDF as a socio‐ecological system. The socio‐ecological system plays an important role for human well‐being and preservation of ecosystem services (Kalaba, 2014) and biodiversity. In this context, the impacts of fires in the TDF can be summarized by the next three examples. First, large proportions of TDF are burned with significant direct consequences on net biomass burning emissions. Thus, fires in the TDF are an important net source of the global C emissions (Andreae, 2019; Randerson et al., 2012). Others (Xu et al., 2021) estimated emissions from global forest clearing of 0.66 PgC annually. Fires in the TDF represent 19.7% of these total global emissions. Also, our study suggests that 20.4% of the burned dry biomass estimated by the GFEDv4 in the Pantropic is related only to the TDF. Yet, the contribution of such C emissions varies spatially and temporally across the Pantropic. Second, fires endanger biodiversity. Information about how fires affects species of plant and how they respond post‐fires are contradictory, as well as if fires can be considered or not part of the TDF ecosystem naturally (Stan & Sanchez‐Azofeifa, 2019). Some studies in India have suggested the existence of fire‐tolerant plant species in the TDF, while other global studies have suggested that TDF plants are not adapted to fires (Dexter et al., 2018; Kodandapani et al., 2008; Ratnam et al., 2011). In any case, it is recognized that fires modify composition, structure, and regeneration of this ecosystem (Andela et al., 2019; Hartung et al., 2021). These modifications in the TDF together with climate change promote the invasion of species, change of species modifying its relative abundances and composition, which returns in the modification of the ecological dynamic. Moreover, these ecological alterations may favor the. Consequently, this may reduce the potential C uptake post‐fire and during the recovery of the ecosystem. Third, fires impact differently across the ecoregions and may reduce the capability to reach the target of “half protected species” in the globe (Figure S8) (Dinerstein et al., 2017). For example, larger fires are dominant on nature imperiled ecoregions, while higher‐severity fires are recorded in ecoregions classified as nature could reach half protected. Nature imperiled ecoregions are characterized by high levels of disturbance, in which fires reduce the potential sprout of native species, promoting a decrease in abundance in the community, particularly of native species that are less tolerant to disturbance. This condition difficult the natural regeneration of the ecosystem, thus human intervention through restoration is necessary. Ecoregions classified as nature could reach half protected relates to regions with large extent of the native vegetation. In these regions fires tend to affect much strongly the habitat and its species by modifying plants and animal distribution, particularly, because fires tend to be more severe. Moreover, ecoregions where nature could recover are influenced by both, large and intense fires, suggesting that land‐management practices need a local approach to minimize the spread and the impacts of fires. Finally, it is important to highlight that the disturbance promoted by fires would induce cascade effects locally by modifying the land use/cover change dynamics re‐enforcing the impacts on C emissions and biodiversity (Mendoza‐Ponce et al., 2018, 2020; Pais et al., 2020).
We suggest that to reduce fire‐severity, it is important to recognize differences in the socio‐ecological constrains. The understanding of the fire characteristics locally are a major keystone to implement adequate land‐management practices (Kalaba, 2014; Vigna et al., 2021). However, there are necessary to implement nature‐based solutions through ecosystem‐based adaptations to implement restoration and mitigation strategies. Thus, a holistic land‐management policy should consider underlying factors that enhance or reinforce fires and its threats. With these in mind, restored ecosystems should aim to achieve the ecological conditions prior to fire disturbance to enhance adaptability and resilience (Lü et al., 2021). Nevertheless, the understanding of those prior conditions and the consequences of fires in terms of C stocks and emissions, and changes in biodiversity, structure and composition is a challenge.
Land‐management of the TDF needs to be analyzed from a socio‐ecological perspective to control and evaluate fires and the integration of the human dimension. Anthropogenic influencers may explain more frequent fires; thus, it is possible to reduce the magnitude in spatial and temporal characteristics of fires, resulting in improved conservation of the TDF and perform better restoration practices. Managing shifting cultivation and cattle ranching by induced‐grasses may play an important role for reducing forest fire‐threats. Thus, the inclusion of local and regional communities in fire‐management is important for the success of these projects.
Globally TDFs are endangered by different pressures, of which fires represent an important driver of disturbance. Under climate change scenarios, TDF would face important increments in their disturbances because of the rise of human pressures and stronger droughts. Fires in the Pantropical dry forests show different spatiotemporal patterns. Our findings highlight the variation of fire‐severity across ecoregions due to pronounced influence on year‐to‐year variations extension and severity of fires by El Niño and La Niña. Also, large variations in fires occurred across the Pantropic related to temperature and water deficit. Our findings help to explain the drivers of fires in TDF and may contribute to improving fire forecasts in this ecosystem. The degree of TDF degradation induced by fires is serious and it will continue to deteriorate the TDF unless effective protective and remedial actions are done. Consequently, the understanding of fire dynamics within a socio‐ecological framework is mandatory for the development of ecosystem‐based adaptation strategies.
AUTHOR CONTRIBUTIONS
Conceptualization: Rogelio O. Corona‐Núñez and Julio E. Campo. Data curation: Rogelio O. Corona‐Núñez. Formal analysis: Rogelio O. Corona‐Núñez. Methodology: Rogelio O. Corona‐Núñez and Julio E. Campo. Writing—original draft: Rogelio O. Corona‐Núñez. Writing—review & editing: Rogelio O. Corona‐Núñez and Julio E. Campo. Writing—final version: Rogelio O. Corona‐Núñez.
CONFLICT OF INTEREST
The authors declare that they have no known competing financial interests or personal relationships that could have appeared to influence the work reported in this paper.
Supporting information
Figure S1
Figure S2
Figure S3
Figure S4
Figure S5
Figure S6
Figure S7
Figure S8
Table S1
Table S2
Table S3
Table S4
Table S5
Table S6
ACKNOWLEDGMENTS
This study was supported by the Dirección General de Asuntos del Personal Académico (DGAPA), Universidad Nacional Autónoma de México (UNAM) with the postdoctoral fellowship to ROCN.
Corona‐Núñez, R. O. , & Campo, J. E. (2023). Climate and socioeconomic drivers of biomass burning and carbon emissions from fires in tropical dry forests: A Pantropical analysis. Global Change Biology, 29, 1062–1079. 10.1111/gcb.16516
DATA AVAILABILITY STATEMENT
Data is cited within the text in the Materials and Methods section, and included in the Reference section. All the data is publicly and freely available from diverse deposits. Global Fire Emissions Database, Version 4.1 (GFED4s) comes from Randerson et al. (2018); Biophysical variables were collected from diverse sources: Realms (Dinerstein et al., 2017); Climatic variables were taken from WorldClim version 2.1 (Fick & Hijmans, 2017); Potential evapotranspiration, and Priestley‐Taylor alpha coefficient (Trabucco & Zomer, 2019); Above‐ground biomass (Avitabile et al., 2016); Altitude comes from a digital terrain model from the SRTM (Shuttle Radar Topography Mission—V.2.1, NASA). Socioeconomic metrics are available from different sources: Population density (GPWv4) and gross domestic product (G‐Econ v4) (CIESIN, 2018); Road density (Meijer et al., 2018), and; Proportion of croplands, irrigated agriculture (Ramankutty et al., 2010a) and pastures (Ramankutty et al., 2010b).
REFERENCES
- Abatzoglou, J. T. , Williams, A. P. , Boschetti, L. , Zubkova, M. , & Kolden, C. A. (2018). Global patterns of interannual climate–fire relationships. Global Change Biology, 24, 5164–5175. [DOI] [PMC free article] [PubMed] [Google Scholar]
- Adams, M. A. (2013). Mega‐fires, tipping points and ecosystem services: Managing forests and woodlands in an uncertain future. Forest, Ecology and Management, 294, 250–261. [Google Scholar]
- Akagi, S. K. , Yokelson, R. J. , Wiedinmeyer, C. , Alvarado, M. J. , Reid, J. S. , Karl, T. , Crounse, J. D. , & Wennberg, P. O. (2011). Emission factors for open and domestic biomass burning for use in atmospheric models. Atmospheric Chemistry and Physics Discussions, 11(9), 27532–27602. 10.5194/acp-11-4039-2011 [DOI] [Google Scholar]
- Alboukadel, K. (2020). Factoextra: Extract and visualize the results of multivariate data analyses .
- Aldersley, A. , Murray, S. J. , & Cornell, S. E. (2011). Global and regional analysis of climate and human drivers of wildfire. Science of the Total Environment, 409, 3472–3481. [DOI] [PubMed] [Google Scholar]
- Andela, N. , Kaiser, J. , Heil, A. , Leeuwen, T. T. V. , Wooster, M. J. , van der Werf, G. R. , Remy, S. , & Schultz, M. G. (2013). Assessment of the global fire assimilation system (GFASv1). ECMWF. [Google Scholar]
- Andela, N. , Morton, D. C. , Giglio, L. , Chen, Y. , van der Werf, G. R. , Kasibhatla, P. S. , DeFries, R. S. , Collatz, G. J. , Hantson, S. , Kloster, S. , Bachelet, D. , Forrest, M. , Lasslop, G. , Li, F. , Mangeon, S. , Melton, J. R. , Yue, C. , & Randerson, J. T. (2017). A human‐driven decline in global burned area. Science, 356, 1356–1362. [DOI] [PMC free article] [PubMed] [Google Scholar]
- Andela, N. , Morton, D. C. , Giglio, L. , Paugam, R. , Chen, Y. , Hantson, S. , van der Werf, G. R. , & Randerson, J. T. (2019). The global fire atlas of individual fire size, duration, speed and direction. Earth System Science Data, 11, 529–552. [Google Scholar]
- Andela, N. , & van der Werf, G. R. (2014). Recent trends in African fires driven by cropland expansion and El Niño to La Niña transition. Nature Climate Change, 4, 791–795. [Google Scholar]
- Andreae, M. O. (2019). Emission of trace gases and aerosols from biomass burning—An updated assessment. Atmospheric Chemistry and Physics, 19, 8523–8546. [Google Scholar]
- Andreae, M. O. , & Merlet, P. (2001). Emission of trace gases and aerosols from biomass burning. Global Biogeochemical Cycles, 15, 955–966. [Google Scholar]
- Antonarakis, A. S. , Pacca, L. , & Antoniades, A. (2022). The effect of financial crises on deforestation: A global and regional panel data analysis. Sustainability Science, 17, 1037–1057. [DOI] [PMC free article] [PubMed] [Google Scholar]
- Archibald, S. , Lehmann, C. E. R. , Gómez‐Dans, J. L. , & Bradstock, R. A. (2013). Defining pyromes and global syndromes of fire regimes. Proceedings of the National Academy of Sciences of the United States of America, 110, 6442–6447. [DOI] [PMC free article] [PubMed] [Google Scholar]
- Archibald, S. , & Roy, D. P. (2009). Identifying individual fires from satellite‐derived burned area data. 2009 IEEE International Geoscience and Remote Sensing Symposium, pp. III‐160‐III‐163.
- Archibald, S. , Roy, D. P. , Van Wilgen, B. W. , & Scholes, R. J. (2009). What limits fire? An examination of drivers of burnt area in southern Africa. Global Change Biology, 15, 613–630. [Google Scholar]
- Arora, V. K. , & Melton, J. R. (2018). Reduction in global area burned and wildfire emissions since 1930s enhances carbon uptake by land. Nature Communications, 9, 1326. [DOI] [PMC free article] [PubMed] [Google Scholar]
- Avitabile, V. , Herold, M. , Heuvelink, G. B. M. , Lewis, S. L. , Phillips, O. L. , Asner, G. P. , Armston, J. , Ashton, P. S. , Banin, L. , Bayol, N. , Berry, N. J. , Boeckx, P. , de Jong, B. H. J. , DeVries, B. , Girardin, C. A. J. , Kearsley, E. , Lindsell, J. A. , Lopez‐Gonzalez, G. , Lucas, R. , … Willcock, S. (2016). An integrated pan‐tropical biomass map using multiple reference datasets. Global Change Biology, 22, 1406–1420. [DOI] [PubMed] [Google Scholar]
- Bastin, J. F. , Mollicone, D. , Grainger, A. , Sparrow, B. , Picard, N. , Lowe, A. , & Castro, R. (2017). Response to comment on “the extent of forest in dryland biomes”. Science, 358, 881. [DOI] [PubMed] [Google Scholar]
- Bistinas, I. , Harrison, S. P. , Prentice, I. C. , & Pereira, J. M. C. (2014). Causal relationships versus emergent patterns in the global controls of fire frequency. Biogeosciences, 11, 5087–5101. [Google Scholar]
- Bistinas, I. , Oom, D. , Sá, A. C. L. , Harrison, S. P. , Prentice, I. C. , & Pereira, J. M. C. (2013). Relationships between human population density and burned area at continental and global scales. PLoS ONE, 8, e81188. [DOI] [PMC free article] [PubMed] [Google Scholar]
- Biudes, M. S. , Geli, H. M. E. , Vourlitis, G. L. , Machado, N. G. , Pavão, V. M. , dos Santos, L. O. , & Querino, C. A. (2022). Evapotranspiration seasonality over tropical ecosystems in Mato Grosso, Brazil. Remote Sensing, 14(10), 2482. 10.3390/rs14102482 [DOI] [Google Scholar]
- Brennan, J. , Gómez‐Dans, J. L. , Disney, M. , & Lewis, P. (2019). Theoretical uncertainties for global satellite‐derived burned area estimates. Biogeosciences, 16, 3147–3164. [Google Scholar]
- Bruckman, V. J. , & Pumpanen, J. (2019). Chapter 17—Biochar use in global forests: Opportunities and challenges. In Busse M., Giardina C. P., Morris D. M., & Page‐Dumroese D. S. (Eds.), Developments in soil science (pp. 427–453). Elsevier. [Google Scholar]
- Burton, C. , Betts, R. A. , Jones, C. D. , Feldpausch, T. R. , Cardoso, M. , & Anderson, L. O. (2020). El Niño driven changes in global fire 2015/16. Frontiers in Earth Science, 8, 199. 10.3389/feart.2020.00199 [DOI] [Google Scholar]
- Charles‐Dominique, T. , Staver, A. C. , Midgley, G. F. , & Bond, W. J. (2015). Functional differentiation of biomes in an African savanna/forest mosaic. South African Journal of Botany, 101, 82–90. [Google Scholar]
- Chen, Y. , Morton, D. C. , Andela, N. , Giglio, L. , & Ran derson, J. T. (2016). How much global burned area can be fore cast on seasonal time scales using sea surface temperatures? Environmental Research Letters, 11, 045001. [Google Scholar]
- Chen, Y. , Morton, D. C. , Andela, N. , van der Werf, G. R. , Giglio, L. , & Randerson, J. T. (2017). A pan‐tropical cascade of fire driven by El Niño/southern oscillation. Nature Climate Change, 7, 906–911. [Google Scholar]
- Chuvieco, E. , Giglio, L. , & Justice, C. (2008). Global characterization of fire activity: Toward defining fire regimes from earth observation data. Global Change Biology, 14, 1488–1502. [Google Scholar]
- CIESIN . (2018). Documentation for the gridded population of the world, version 4 (GPWv4), revision 11 data sets. Center for International Earth Science Information Network (CIESIN), NASA Socioeconomic Data and Applications Center (SEDAC). [Google Scholar]
- Corona, R. , Galicia, L. , Palacio‐Prieto, J. L. , Bürgi, M. , & Hersperger, A. (2016). Local deforestation patterns and driving forces in a tropical dry forest in two municipalities of southern Oaxaca, Mexico (1985–2006). Investigaciones Geográficas, 91, 86–104. [Google Scholar]
- Corona‐Núñez, R. O. , Campo, J. , & Williams, M. (2018). Aboveground carbon storage in tropical dry forest plots in Oaxaca, Mexico. Forest, Ecology and Management, 409, 202–214. [Google Scholar]
- Corona‐Núñez, R. O. , Li, F. , & Campo, J. E. (2020). Fires represent an important source of carbon emissions in Mexico. Global Biogeochemical Cycles, 34, e2020GB006815. [Google Scholar]
- Corona‐Núñez, R. O. , Mendoza‐Ponce, A. V. , & Campo, J. (2021). Assessment of above‐ground biomass and carbon loss from a tropical dry forest in Mexico. Journal of Environmental Management, 282, 111973. [DOI] [PubMed] [Google Scholar]
- Dexter, K. G. , Pennington, R. T. , Oliveira‐Filho, A. T. , Bueno, M. L. , Silva de Miranda, P. L. , & Neves, D. M. (2018). Inserting tropical dry forests into the discussion on biome transitions in the tropics. Frontiers in Ecology and Evolution, 6, 104. 10.3389/fevo.2018.00104 [DOI] [Google Scholar]
- Dinerstein, E. , Olson, D. , Joshi, A. , Vynne, C. , Burgess, N. D. , Wikramanayake, E. , Hahn, N. , Palminteri, S. , Hedao, P. , Noss, R. , Hansen, M. , Locke, H. , Ellis, E. C. , Jones, B. , Barber, C. V. , Hayes, R. , Kormos, C. , Martin, V. , Crist, E. , … Saleem, M. (2017). An ecoregion‐based approach to protecting half the terrestrial realm. BioScience, 67, 534–545. [DOI] [PMC free article] [PubMed] [Google Scholar]
- Exbrayat, J.‐F. , Smallman, T. L. , Bloom, A. A. , Hutley, L. B. , & Williams, M. (2018). Inverse determination of the influence of fire on vegetation carbon turnover in the Pantropics. Global Biogeochemical Cycles, 32, 1776–1789. [Google Scholar]
- Ferrara, C. , Salvati, L. , Corona, P. , Romano, R. , & Marchi, M. (2019). The background context matters: Local‐scale socioeconomic conditions and the spatial distribution of wildfires in Italy. Science of the Total Environment, 654, 43–52. [DOI] [PubMed] [Google Scholar]
- Fick, S. E. , & Hijmans, R. J. (2017). WorldClim 2: New 1‐km spatial resolution climate surfaces for global land areas. International Journal of Climatology, 37, 4302–4315. [Google Scholar]
- Fischlin, A. , Ayres, M. , Karnosky, D. , Kellomaki, S. , Louman, B. , Ong, C. , Palttner, G.‐K. , Santoso, H. , & Thompson, I. (2009). Future environmental impacts and vulnerabilities. In Seppala R., Buck A., & Katila P. (Eds.), Adaptation of forests and people to climate change: A global assessment report (pp. 53–100). International Union of Forest Research Organizations (IUFRO). [Google Scholar]
- Fréjaville, T. , & Curt, T. (2017). Seasonal changes in the human alteration of fire regimes beyond the climate forcing. Environmental Research Letters, 12, 035006. [Google Scholar]
- Giglio, L. , Boschetti, L. , Roy, D. P. , Humber, M. L. , & Justice, C. O. (2018). The collection 6 MODIS burned area mapping algorithm and product. Remote Sensing of Environment, 217, 72–85. [DOI] [PMC free article] [PubMed] [Google Scholar]
- Griffith, D. M. , Lehmann, C. E. R. , Strömberg, C. A. E. , Parr, C. L. , Pennington, R. T. , Sankaran, M. , Ratnam, J. , Still, C. J. , Powell, R. L. , Hanan, N. P. , Nippert, J. B. , Osborne, C. P. , Good, S. P. , Anderson, T. M. , Holdo, R. M. , Veldman, J. W. , Durigan, G. , Tomlinson, K. W. , Hoffmann, W. A. , … Bond, W. J. (2017). Comment on "the extent of forest in dryland biomes". Science, 358, eaao1309. [DOI] [PubMed] [Google Scholar]
- Gu, G. , & Adler, R. F. (2018). Precipitation intensity changes in the tropics from observations and models. Journal of Climate, 31, JCLI‐D‐17‐0550.0551. [Google Scholar]
- Gwelo, A. S. (2019). Principal components to overcome multicollinearity problem. Oradea Journal of Business and Economics, 4, 79–91. [Google Scholar]
- Harrison, S. P. , Prentice, I. C. , Bloomfield, K. J. , Dong, N. , Forkel, M. , Forrest, M. , Ningthoujam, R. K. , Pellegrini, A. , Shen, Y. , Baudena, M. , Cardoso, A. W. , Huss, J. C. , Joshi, J. , Oliveras, I. , Pausas, J. G. , & Simpson, K. J. (2021). Understanding and modelling wildfire regimes: An ecological perspective. Environmental Research Letters, 16, 125008. [Google Scholar]
- Hartung, M. , Carreño‐Rocabado, G. , Peña‐Claros, M. , & van der Sande, M. T. (2021). Tropical dry forest resilience to fire depends on fire frequency and climate. Frontiers in Forests and Global Change, 4, 755104. 10.3389/ffgc.2021.755104 [DOI] [Google Scholar]
- Hauser, S. , & Norgrove, L. (2013). Slash‐and‐burn agriculture, effects of. In Levin S. A. (Ed.), Encyclopedia of biodiversity (2nd ed., pp. 551–562). Academic Press. [Google Scholar]
- Hijmans, R. J. , van Etteb, J. , Summer, M. , Cheng, J. , Bevan, A. , Bivand, R. , Busetto, L. , Canty, M. , Forrest, D. , Ghosh, A. , Golicher, D. , Gray, J. , Greenberg, J. A. , Hiemstra, P. , Hingee, K. , Ilich, A. , Institute for Mathematics Applied Geosciences , Karney, C. , Mattiuzzi, M. , … Wueest, R. (2020). Package ‘raster’: Geographic data analysis and modeling. R‐Project. [Google Scholar]
- IPCC . (2013). Climate change 2013: The physical science basis. Contribution of Working Group I to the fifth assessment report of the Intergovernmental Panel on Climate Change. Cambridge University Press. [Google Scholar]
- Janzen, D. H. (1988a). Tropical dry forests. Biodiversitas, 15, 538. [Google Scholar]
- Janzen, H. D. (1988b). Chapter 14, Tropical dry forests the most endangered major tropical ecosystem. In Wilson E. & Peter F. (Eds.), Biodiversity. National Academies Press (US). [PubMed] [Google Scholar]
- Jiang, Y. , Zhou, L. , & Raghavendra, A. (2020). Observed changes in fire patterns and possible drivers over Central Africa. Environmental Research Letters, 15, 0940b0948. [Google Scholar]
- Jollife, I. T. (2002). Principal component analysis. Springer. [Google Scholar]
- Kalaba, F. K. (2014). A conceptual framework for understanding forest socio‐ecological systems. Biodiversity and Conservation, 23, 3391–3403. [Google Scholar]
- Keeley, J. E. (2008). Fire. In Jørgensen S. E. & Fath B. D. (Eds.), Encyclopedia of ecology (pp. 1557–1564). Academic Press. [Google Scholar]
- Knorr, W. , Kaminski, T. , Arneth, A. , & Weber, U. (2014). Impact of human population density on fire frequency at the global scale. Biogeosciences, 11, 1085–1102. [Google Scholar]
- Kodandapani, N. , Cochrane, M. A. , & Sukumar, R. (2008). A comparative analysis of spatial, temporal, and ecological characteristics of forest fires in seasonally dry tropical ecosystems in the Western Ghats, India. Forest, Ecology and Management, 256, 607–617. [Google Scholar]
- Lang, R. (1920). Verwitterung und Bodenbildung als Einführung in die Bodenkunde. Schweizerbart Science Publishers. [Google Scholar]
- Lasslop, G. , & Kloster, S. (2017). Human impact on wildfires varies between regions and with vegetation productivity. Environmental Research Letters, 12, 115011. [Google Scholar]
- Lehmann, C. E. R. , Archibald, S. A. , Hoffmann, W. A. , & Bond, W. J. (2011). Deciphering the distribution of the savanna biome. New Phytologist, 191, 197–209. [DOI] [PubMed] [Google Scholar]
- Lhomme, J. P. (1997). A theoretical basis for the Priestley‐Taylor coefficient. Boundary‐Layer Meteorology, 82, 179–191. [Google Scholar]
- Liu, J. , Bowman, K. W. , Schimel, D. S. , Parazoo, N. C. , Jiang, Z. , Lee, M. , Bloom, A. A. , Wunch, D. , Frankenberg, C. , Sun, Y. , O'Dell, C. W. , Gurney, K. R. , Menemenlis, D. , Gierach, M. , Crisp, D. , & Eldering, A. (2017). Contrasting carbon cycle responses of the tropical continents to the 2015–2016 El Niño. Science, 358, eaam5690. [DOI] [PubMed] [Google Scholar]
- Lü, Y. , Lü, D. , Feng, X. , & Fu, B. (2021). Multi‐scale analyses on the ecosystem services in the Chinese loess plateau and implications for dryland sustainability. Current Opinion in Environmental Sustainability, 48, 1–9. [Google Scholar]
- Masson‐Delmotte, V. , Zhai, P. , Pirani, A. , Connors, S. L. , Péan, C. , Berger, S. , Caud, N. , Chen, Y. , Goldfarb, L. , Gomis, M. I. , Huang, M. , Leitzell, K. , Lonnoy, E. , Matthews, J. B. R. , Maycock, T. K. , Waterfield, T. , Yelekçi, O. , & Zhou, R. Y. A. B. (2021). Climate change 2021: The physical science basis. Contribution of Working Group I to the sixth assessment report of the Intergovernmental Panel on Climate Change. Cambridge University Press. [Google Scholar]
- Meijer, J. R. , Huijbregts, M. A. J. , Schotten, K. C. G. J. , & Schipper, A. M. (2018). Global patterns of current and future road infrastructure. Environmental Research Letters, 13, 064006. [Google Scholar]
- Mendoza‐Ponce, A. , Corona‐Núñez, R. , Kraxner, F. , Leduc, S. , & Patrizio, P. (2018). Identifying effects of land use cover changes and climate change on terrestrial ecosystems and carbon stocks in Mexico. Global Environmental Change, 53, 12–23. [Google Scholar]
- Mendoza‐Ponce, A. V. , Corona‐Núñez, R. O. , Kraxner, F. , & Estrada, F. (2020). Spatial prioritization for biodiversity conservation in a megadiverse country. Anthropocene, 32, 100267. [Google Scholar]
- Miles, L. , Newton, A. C. , DeFries, R. S. , Ravilious, C. , May, I. , Blyth, S. , Kapos, V. , & Gordon, J. E. (2006). A global overview of the conservation status of tropical dry forests. Journal of Biogeography, 33, 491–505. [Google Scholar]
- Moncrieff, G. R. , Scheiter, S. , Langan, L. , Trabucco, A. , & Higgins, S. I. (2016). The future distribution of the savannah biome: Model‐based and biogeographic contingency. Philosophical Transactions of the Royal Society B: Biological Sciences, 371, 20150311. [DOI] [PMC free article] [PubMed] [Google Scholar]
- Moreira, F. , Viedma, O. , Arianoutsou, M. , Curt, T. , Koutsias, N. , Rigolot, E. , Barbati, A. , Corona, P. , Vaz, P. , Xanthopoulos, G. , Mouillot, F. , & Bilgili, E. (2011). Landscape—Wildfire interactions in southern Europe: Implications for landscape management. Journal of Environmental Management, 92, 2389–2402. [DOI] [PubMed] [Google Scholar]
- Muimba‐Kankolongo, A. (2018). Chapter 6—Common cultivation practices. In Muimba‐Kankolongo A. (Ed.), Food crop production by smallholder farmers in southern Africa (pp. 49–58). Academic Press. [Google Scholar]
- Murphy, B. P. , Prior, L. D. , Cochrane, M. A. , Williamson, G. J. , & Bowman, D. M. J. S. (2019). Biomass consumption by surface fires across Earth's most fire prone continent. Global Change Biology, 25, 254–268. [DOI] [PubMed] [Google Scholar]
- Murphy, P. G. , & Lugo, A. E. (1986). Ecology of tropical dry Forest. Annual Review of Ecology and Systematics, 17, 67–88. [Google Scholar]
- NOAA . (2021). Cold & warm episoded by season. National Weather Service, Climate Prediction Center. [Google Scholar]
- Nolan, R. H. , Boer, M. M. , Resco de Dios, V. , Caccamo, G. , & Bradstock, R. A. (2016). Large‐scale, dynamic transformations in fuel moisture drive wildfire activity across southeastern Australia. Geophysical Research Letters, 43, 4229–4238. [Google Scholar]
- Olson, D. M. , Dinerstein, E. , Wikramanayake, E. D. , Burgess, N. D. , Powell, G. V. N. , Underwood, E. C. , D'amico, J. A. , Itoua, I. , Strand, H. E. , Morrison, J. C. , Loucks, C. J. , Allnutt, T. F. , Ricketts, T. H. , Kura, Y. , Lamoreux, J. F. , Wettengel, W. W. , Hedao, P. , & Kassem, K. R. (2001). Terrestrial ecoregions of the world: A new map of life on earth: A new global map of terrestrial ecoregions provides an innovative tool for conserving biodiversity. BioScience, 51, 933–938. [Google Scholar]
- Otterstrom, S. M. , Schwartz, M. W. , & Velázquez‐Rocha, I. (2006). Responses to fire in selected tropical dry Forest trees. Biotropica, 38, 592–598. [Google Scholar]
- Pais, S. , Aquilué, N. , Campos, J. , Sil, Â. , Marcos, B. , Martínez‐Freiría, F. , Domínguez, J. , Brotons, L. , Honrado, J. P. , & Regos, A. (2020). Mountain farmland protection and fire‐smart management jointly reduce fire hazard and enhance biodiversity and carbon sequestration. Ecosystem Services, 44, 101143. [Google Scholar]
- Pan, Y. , Birdsey, R. A. , Fang, J. , Houghton, R. , Kauppi, P. E. , Kurz, W. A. , Phillips, O. L. , Shvidenko, A. , Lewis, S. L. , Canadell, J. G. , Ciais, P. , Jackson, R. B. , Pacala, S. W. , McGuire, A. D. , Piao, S. , Rautiainen, A. , Sitch, S. , & Hayes, D. (2011). A large and persistent carbon sink in the World's forests. Science, 333, 988–993. [DOI] [PubMed] [Google Scholar]
- Pennington, R. T. , Lehmann, C. E. R. , & Rowland, L. M. (2018). Tropical savannas and dry forests. Current Biology: CB, 28, R541–R545. [DOI] [PubMed] [Google Scholar]
- Quan, C. , Han, S. , Utescher, T. , Zhang, C. , & Liu, Y.‐S. (2013). Validation of temperature–precipitation based aridity index: Paleoclimatic implications. Palaeogeography, Palaeoclimatology, Palaeoecology, 386, 86–95. [Google Scholar]
- Ramankutty, N. , Evan, A. T. , Monfreda, C. , & Foley, J. A. (2008). Farming the planet: 1. Geographic distribution of global agricultural lands in the year 2000. Global Biogeochemical Cycles, 22, GB1003. 10.1029/2007GB002952 [DOI] [Google Scholar]
- Ramankutty, N. , Evan, A. T. , Monfreda, C. , & Foley, J. A. (2010a). Global agricultural lands: Croplands, 2000. Data distributed by the Socioeconomic Data and Applications Center (SEDAC). [Google Scholar]
- Ramankutty, N. , Evan, A. T. , Monfreda, C. , & Foley, J. A. (2010b). Global agricultural lands: Pastures, 2000. Data distributed by the Socioeconomic Data and Applications Center (SEDAC). [Google Scholar]
- Randerson, J. T. , Chen, Y. , van der Werf, G. R. , Rogers, B. M. , & Morton, D. C. (2012). Global burned area and biomass burning emissions from small fires. Journal of Geophysical Research: Biogeosciences, 117, G04012. 10.1029/2012JG002128 [DOI] [Google Scholar]
- Randerson, J. T. , van der Werf, G. R. , Giglio, L. , Collatz, G. J. , & Kasibhatla, P. S. (2018). Global fire emissions database, version 4.1 (GFEDv4). ORLN DAAC—NASA. [Google Scholar]
- Ratnam, J. , Bond, W. J. , Fensham, R. J. , Hoffmann, W. A. , Archibald, S. , Lehmann, C. E. R. , Anderson, M. T. , Higgins, S. I. , & Sankaran, M. (2011). When is a ‘forest’ a savanna, and why does it matter? Global Ecology and Biogeography, 20, 653–660. [Google Scholar]
- R‐Core‐Team . (2018). R: A language and environment for statistical Computing. R Foundation for Statistical Computing. [Google Scholar]
- Rogers, B. M. , Balch, J. K. , Goetz, S. J. , Lehmann, C. E. R. , & Turetsky, M. (2020). Focus on changing fire regimes: Interactions with climate, ecosystems, and society. Environmental Research Letters, 15, 030201. [Google Scholar]
- Sanchez‐Azofeifa, G. , Quesada, M. , Rodriguez, J. , Nassar, J. , Stoner, K. , Castillo, A. , Garvin, T. , Zent, E. , Calvo‐Alvarado, J. , Kalacska, M. , Fajardo, L. , Gamon, J. , & Cuevas‐Reyes, P. (2005). Research priorities for neotropical dry forests. Biotropica, 37, 477–485. [Google Scholar]
- Sankaran, M. , Ratnam, J. , & Hanan, N. (2008). Woody cover in African savannas: The role of resources, fire and herbivory. Global Ecology and Biogeography, 17, 236–245. [Google Scholar]
- Simmons, B. A. , Marcos‐Martinez, R. , Law, E. A. , Bryan, B. A. , & Wilson, K. A. (2018). Frequent policy uncertainty can negate the benefits of forest conservation policy. Environmental Science & Policy, 89, 401–411. [Google Scholar]
- Siyum, Z. G. (2020). Tropical dry forest dynamics in the context of climate change: Syntheses of drivers, gaps, and management perspectives. Ecological Processes, 9, 25. [Google Scholar]
- Stacklies, W. , Redestig, H. , Scholz, M. , Walther, D. , & Selbig, J. (2007). pcaMethods—A Bioconductor package providing PCA methods for incomplete data. Bioinformatics, 23, 1164–1167. [DOI] [PubMed] [Google Scholar]
- Stan, K. , & Sanchez‐Azofeifa, A. (2019). Tropical dry Forest diversity, climatic response, and resilience in a changing climate. Forests, 10, 443. [Google Scholar]
- Staver, A. C. , Archibald, S. , & Levin, S. (2011). Tree cover in sub‐Saharan Africa: Rainfall and fire constrain forest and savanna as alternative stable states. Ecology, 92, 1063–1072. [DOI] [PubMed] [Google Scholar]
- Sunderland, T. , Apgaua, D. , Baldauf, C. , Blackie, R. , Colfer, C. , Cunningham, A. B. , Dexter, K. , Djoudi, H. , Gautier, D. , Gumbo, D. , Ickowitz, A. , Kassa, H. , Parthasarathy, N. , Pennington, R. T. , Paumgarten, F. , Pulla, S. , Sola, P. , Tng, D. , Waeber, P. , & Wilmé, L. (2015). Global dry forests: A prologue. International Forestry Review, 17, 1–9. [Google Scholar]
- Tang, R. , Mao, J. , Jin, M. , Chen, A. , Yu, Y. , Shi, X. , Zhang, Y. , Hoffman, F. M. , Xu, M. , & Wang, Y. (2021). Interannual variability and climatic sensitivity of global wildfire activity. Advances in Climate Change Research, 12, 686–695. [Google Scholar]
- Tanjina‐Hasnat, G. N. , & Kamal‐Hossain, M. (2020). Global overview of tropical dry forests. In Bhadouria R., Tripathi S., Srivastava P., & Singh P. (Eds.), The conservation and restoration of tropical dry forests (pp. 1–23). IGI‐Global. [Google Scholar]
- Trabucco, A. , & Zomer, R. (2019). Global aridity index and potential evapotranspiration (ET0) climate database v2. Figshare. [DOI] [PMC free article] [PubMed]
- Trejo, D. A. R. (2008). Fire regimes, fire ecology, and fire management in Mexico. Ambio, 37, 548–556. [DOI] [PubMed] [Google Scholar]
- van der Werf, G. R. , Randerson, J. T. , Collatz, G. J. , Giglio, L. , Kasibhatla, P. S. , Arellano, A. F. , Olsen, S. C. , & Kasischke, E. S. (2004). Continental‐scale partitioning of fire emissions during the 1997 to 2001 El Niño/La Niña period. Science, 303, 73–76. [DOI] [PubMed] [Google Scholar]
- van der Werf, G. R. , Randerson, J. T. , Giglio, L. , van Leeuwen, T. T. , Chen, Y. , Rogers, B. M. , Mu, M. , van Marle, M. J. E. , Morton, D. C. , Collatz, G. J. , Yokelson, R. J. , & Kasibhatla, P. S. (2017). Global fire emissions estimates during 1997–2016. Earth System Science Data, 9, 697–720. [Google Scholar]
- Verma, S. , Singh, D. , Mani, S. , & Jayakumar, S. (2017). Effect of forest fire on tree diversity and regeneration potential in a tropical dry deciduous forest of Mudumalai Tiger Reserve, Western Ghats, India. Ecological Processes, 6, 32. 10.1186/s13717-017-0098-0 [DOI] [Google Scholar]
- Vigna, I. , Besana, A. , Comino, E. , & Pezzoli, A. (2021). Application of the socio‐ecological system framework to Forest fire risk management: A systematic literature review. Sustainability, 13, 2121. [Google Scholar]
- Wang, X. , Jiang, D. , & Lang, X. (2021). Future changes in aridity index at two and four degrees of global warming above preindustrial levels. International Journal of Climatology, 41, 278–294. [Google Scholar]
- Westerling, A. L. , Hidalgo, H. G. , Cayan, D. R. , & Swetnam, T. W. (2006). Warming and earlier spring increase western U.S. forest wildfire activity. Science, 313, 940–943. [DOI] [PubMed] [Google Scholar]
- Wilks, D. S. (2011). Statistical methods in the atmospheric sciences. Academic Press. [Google Scholar]
- Xu, L. , Saatchi, S. S. , Yang, Y. , Yu, Y. , Pongratz, J. , Bloom, A. A. , Bowman, K. , Worden, J. , Liu, J. , Yin, Y. , Domke, G. , McRoberts, R. E. , Woodall, C. , Nabuurs, G.‐J. , de‐Miguel, S. , Keller, M. , Harris, N. , Maxwell, S. , & Schimel, D. (2021). Changes in global terrestrial live biomass over the 21st century. Science Advances, 7, eabe9829. [DOI] [PMC free article] [PubMed] [Google Scholar]
- Yin, Y. , Bloom, A. A. , Worden, J. , Saatchi, S. , Yang, Y. , Williams, M. , Liu, J. , Jiang, Z. , Worden, H. , Bowman, K. , Frankenberg, C. , & Schimel, D. (2020). Fire decline in dry tropical ecosystems enhances decadal land carbon sink. Nature Communications, 11, 1900. [DOI] [PMC free article] [PubMed] [Google Scholar]
- Zubkova, M. , Boschetti, L. , Abatzoglou, J. T. , & Giglio, L. (2019). Changes in fire activity in Africa from 2002 to 2016 and their potential drivers. Geophysical Research Letters, 46, 7643–7653. [DOI] [PMC free article] [PubMed] [Google Scholar]
Associated Data
This section collects any data citations, data availability statements, or supplementary materials included in this article.
Supplementary Materials
Figure S1
Figure S2
Figure S3
Figure S4
Figure S5
Figure S6
Figure S7
Figure S8
Table S1
Table S2
Table S3
Table S4
Table S5
Table S6
Data Availability Statement
Data is cited within the text in the Materials and Methods section, and included in the Reference section. All the data is publicly and freely available from diverse deposits. Global Fire Emissions Database, Version 4.1 (GFED4s) comes from Randerson et al. (2018); Biophysical variables were collected from diverse sources: Realms (Dinerstein et al., 2017); Climatic variables were taken from WorldClim version 2.1 (Fick & Hijmans, 2017); Potential evapotranspiration, and Priestley‐Taylor alpha coefficient (Trabucco & Zomer, 2019); Above‐ground biomass (Avitabile et al., 2016); Altitude comes from a digital terrain model from the SRTM (Shuttle Radar Topography Mission—V.2.1, NASA). Socioeconomic metrics are available from different sources: Population density (GPWv4) and gross domestic product (G‐Econ v4) (CIESIN, 2018); Road density (Meijer et al., 2018), and; Proportion of croplands, irrigated agriculture (Ramankutty et al., 2010a) and pastures (Ramankutty et al., 2010b).