Abstract
Tau tubulin kinase 2 (TTBK2) associated with multiple diseases is one of the kinases which phosphorylates tau and tubulin. Numerous efforts have been made to understand the role of TTBK2 in protein folding mechanisms and misfolding behavior. The misfolded protein intermediates form polymers with unwanted aggregation properties that initiate several diseases, including Alzheimer’s. The availability of TTBK2 inhibitors can enhance the understanding of the molecular mechanism of action of the kinase and assist in developing novel therapeutics. In the quest for TTBK2 inhibitors, this study focuses on screening two chemical libraries (ChEMBL and ZINC-FDA). The molecular docking, RO5/absorption, distribution, metabolism, and excretion/toxicity, density functional theory, molecular dynamics (MD) simulations, and molecular mechanics with generalized Born and surface area solvation techniques enabled shortlisting of the four most active compounds, namely, ChEMBL1236395, ChEMBL2104398, ChEMBL3427435, and ZINC000000509440. Moreover, 500 ns MD simulation was performed for each complex, which provided valuable insights into the structural changes in the complexes. The relative fluctuation, solvent accessible surface area, atomic gyration, compactness covariance, and free energy landscapes revealed that the compounds could stabilize the TTBK2 protein. Overall, this study would be valuable for the researchers targeting the development of novel TTBK2 inhibitors.
1. Introduction
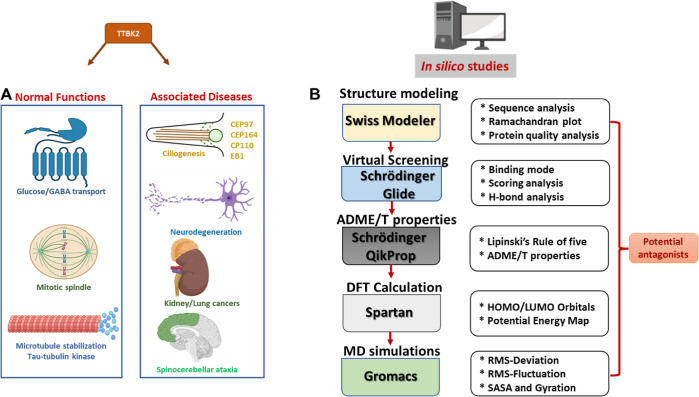
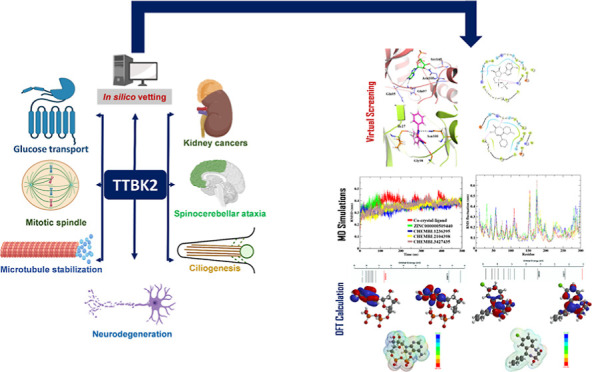
Microtubules are essential for various physiological processes like cell migration, proliferation, and morphogenesis. Microtubules contain two distinct ends: a slowly growing minus end and a rapidly growing plus end.1,2 In cells, the microtubule plus end has stochastic oscillation between phases of growth and shrinkage.1,3 Tau tubulin kinase 2 (TTBK2) belongs to the microtubule kinase superfamily of proteins, which phosphorylates tau and tubulin.4,5 The TTBK2 gene expression can be found in several tissues such as the liver, kidney, skeletal muscle, pancreas, brain, and heart.6−9 The alterations in the levels of TTBK2 in cells can lead to various abnormalities. It is also believed to play a vital role in the pathophysiology of neurodegenerative disorders by affecting cerebellar neurons.6,10 The TTBK2 role is not restricted to regulating microtubule stability in neurons. The kinase activity is important for ciliogenesis initiation, cancer progression, transporter stimulation, and TDP-43 accumulation.11−14 The known cellular processes and diseases linked with TTBK2 activity are illustrated in Figure 1A.15 Although TTBK2 is an intriguing target for treating various ailments, no computational studies on TTBK2 have been carried out yet. Owing to the importance of TTBK2 in health and disease, the study aimed to identify potential TTBK2 antagonists binding to the active pocket of the protein using molecular docking-based virtual screening on ChEMBL and ZINC compound libraries.
Figure 1.
Cellular processes and diseases associated with TTBK2 (A). Computational study workflow (B).
Bao et al. 2020 reported the adenosine diphosphate (ADP)-bound TTBK2 3D structure for the first time and demonstrated the kinase activities toward the substrate tau, including tau phosphorylation in neurons.16 The cocrystal structure of TTBK2 (6VRF) showed ADP in the active pocket; hence, it was considered a reference in the current study.16 We performed drug repurposing, one of the efficient and quick methods to identify novel therapeutic benefits of Food and Drug Administration (FDA)-approved drugs. For screening purposes, the sources of two libraries, namely, a pool of ChEMBL compounds, which contains 14,000 active compounds, and the ZINC-FDA database, which consists of 3100 drug compounds that are chemically diverse and pharmacologically active, were used. To eliminate redundancy in the collective pool, a similarity search was performed to identify structurally similar compounds from ZINC and ChEMBL data sets to obtain 10,900 molecules which were utilized for the screening with the TTBK2 active site.17,18 Furthermore, Prime molecular mechanics generalized Born surface area (MM/GBSA); chemical absorption, distribution, metabolism, excretion, and toxicity (ADME/T); density functional theory (DFT) predictions, and molecular dynamics (MD) simulations were carried out to find the best TTBK2-binding molecule.
We calculated the free energy binding of the docked complexes using Prime MM/GBSA to evaluate the binding energies of the drug compounds toward the TTBK2 active pocket. Furthermore, we analyzed the conformational stability of the four docked complexes and the ADP-TTBK2-docked complex through MD simulations. The comparative analysis of the four proposed compounds and the reference compound was accomplished by calculating the parameters such as root mean square deviation (RMSD), root mean square fluctuation (RMSF), solvent accessible surface area (SASA), radius of gyration (Rg), principal component analysis (PCA), hydrogen bond monitoring, secondary structure element (SSE) analysis, free energy landscape (FEL) analysis, and density distribution. The study workflow is shown in Figure 1B. In this study, the four proposed compounds and a reference compound were further examined for pharmacological properties, which revealed that the proposed compounds were found to be potential drug-like candidates.
2. Materials and Methods
2.1. Hardware and Software
The work was carried out on an International Business Machines (IBM) server. The High-Performance Computing (HPC) server is equipped with 2 × 20 core processors, 256 GB RAM in each slot, and an NVIDIA graphics card (GPU V100 32 GB), installed with various bioinformatics software such as GROMACS, Xmgrace, and Schrödinger.19,20
2.2. Target Selection and Active Site Prediction
The primary TTBK2 protein sequence contains 1244 amino acid residues; herein, the protein kinase domain was utilized, but the structure file has three missing amino acids, Gly31, Phe32, and Gly33, in the available crystal structure (PDB ID: 6VRF).16,21 A computational model was constructed using SWISS-MODEL to generate a complete model, including the missing residues and the stereo-chemical properties.9,22 The reliable TTBK2-modeled structure from SWISS-MODEL and the cocrystal ligand ADP embedded in the available crystal structure (6VRF) were utilized for subsequent analyses in the present study. The LIGPLOT of the interaction of the ADP and the TTBK2 receptor is presented in Supporting Information S1. The 3D structure of the ligand and PDB file formats were retrieved from the PDB database.23 The available PDB crystal structure was used as input to identify the active site, and 2D formats were retrieved from PDBsum and cross-checked with literature sources.16,24 The amino acid residues involved in the hydrogen bonds, van der Waals (vdW) region, and bond length of 2D plots were marked.25
2.3. Protein and Ligand Preparation
We modeled the TTBK2 missing loop (three residues Gly31, Phe32, and Gly33) using SWISS-MODEL.22 The initial protein structure was refined, and energy minimization was performed. The TTBK2 structure was prepared for docking using the Protein Preparation Wizard in Schrödinger Maestro by adding the missing hydrogen atoms, discarding atomic clashes, adding hetero-groups, and optimizing charges at neutral pH.20 The final structure was minimized using the optimized potential for liquid simulations force field (OPLS-2005) in Schrödinger.26 The ligand data set from ChEMBL and ZINC data sets, along with the reference molecule, was retrieved and subjected to ligand preparation using the Schrödinger LigPrep module. From the ZINC-FDA dataset, 3100 drug molecules and from ChEMBL, 14,000 active molecules were extracted. The similarity search between the downloaded compounds from ChEMBL and ZINC-FDA was performed, and finally, 10,900 diverse, active molecules were selected for screening. The ligand preparation process involves the definite chiralities to generate low-energy stereoisomers of each ligand, where the pH conditions are kept at default. The input files of the prepared ligands were saved in the .maez file format for virtual screening.
2.4. Virtual Screening-Based Molecular Docking
The prepared library was utilized for the virtual screening based on molecular docking to identify the potential antagonist against TTBK2 protein using the Schrödinger GLIDE module.27,28 The stability of a docked complex is presumed to have higher potency if it exhibits higher negative scores. The formatted PDB file formats were given as input along with the ADP reference molecule, and 10,900 drug-like compound datasets were screened against the active pocket of TTBK2. The docked compounds were ranked on the basis of binding energy scores and the best interaction poses between the ligand and receptor. The docking experiments were performed using the GLIDE three-tier protocol, where 50% filters for the compounds were used for high-throughput virtual screening (HTVS) to screen false positives, and 100% were used in standard precision (SP) and extra precision (XP) docking. The energy assessment was performed with the docking scores and the 2D interaction plots of the complexes. Furthermore, the 3D visualization plot of docked complexes was built using the Maestro interface.
2.5. Pharmacological and ADME/T Prediction
ADME/T properties were predicted using the Schrödinger QikProp module.29 The absorption includes parameters like polar surface area (PSA), membrane permeability (Log P), cell-based methods such as Caco-2, intestinal absorption, and skin permeability levels. The distribution properties of drugs include parameters like a blood–brain barrier (log BB) and central nervous system (CNS) permeability. Cytochrome models can be used for the substrate to understand the metabolism of the drug molecules. Excretion is a process where the body eliminates ineffective drugs/metabolites. The toxicity parameters include AMES toxicity, hERG inhibition, hepatotoxicity, and skin sensitization. The compounds should have good intestinal absorption and log Kp values. The blood–brain barriers (BBBs) are also one of the important factors for the suitability of a compound to be an ideal drug, which is measured as log BB where a value >0.3 shows that the compounds can easily cross the barrier, and log BB < −1 suggests that the compounds cannot cross it. Similarly, the compounds with > −2 of log PB are considered to penetrate the CNS, and <−3 are considered not to penetrate the CNS. The descriptors such as the molecular weight, dipole moment, SASA, hydrogen bond donor/acceptor traits, Lipinski rule, and human oral absorption were predicted. All these parameters were also taken into account for selecting the best compounds.
2.6. MM-GBSA Free Energy Calculations
The Schrödinger Prime module was used to produce the GBSA continuum model, and the GBSA model by the Gaussian surface was employed instead of the vdW surface to represent the SASA. The compounds with favorable interactive and binding poses were spotted with the help of free energy of binding energies (ΔG), defined using the equation as follows
where (ΔGcomplex), (ΔGreceptor), and (ΔGligand) are the average values of Gibbs free energy for the complex, receptor, and ligand, respectively.
where ΔE is the minimized energies, ΔGsolv is solvation-free energies, and ΔGSA is the difference between surface area energy and the sum of the surface energies of the docked complex.30
2.7. GROningen MAchine for Chemical Simulations
MD simulations were carried out for the best-docked complexes using GROningen MAchine for Chemical Simulation (GROMACS) (version 5.18.3) to determine the TTBK2 enzyme behavior in the presence of water.19 The topology of TTBK2 was generated using the GROMOS9643a1 force field. The PRODRG server was used to generate molecular topologies and coordinate files of ligands.31 All the systems were solvated using a simple point charge model (SPC/E) in a cubic box.32 To neutralize the system, 0.15 M counter ions (Na+ and Cl–) were added. The energy minimization of all the neutralized systems was performed using the steepest descent and conjugate gradients (50,000 steps for each). The constant number of particles, volume, and temperature (NVT) ensemble and the constant number of particles, pressure, and temperature (NPT) ensemble were run for system equilibration. The steepest descent followed by conjugate gradient algorithms was utilized for enzyme–ligand complex minimizations. The NVT ensemble at a constant temperature of 300 K and a constant pressure of 1 bar was employed. The SHAKE algorithm was used to confine the H-atoms at their equilibrium distances and under periodic boundary conditions. The particle mesh Ewald method was used to define long-range electrostatic forces.33 The cutoffs for vdW and Coulombic interactions were 1.0 nm. The LINear Constraint Solver (LINCS) algorithm was used to constrain the bonds and angles.34 Finally, the production runs were performed for a period of 500 ns. The energy, velocity, and trajectory were updated at a time interval of 10 ps. The MD simulation analyses were performed by utilizing trajectories using MDTraj-based Python scripts.
The Cα-atom deviations of TTBK2 and complexes were assessed using RMSD and RMSF for relative fluctuations of each amino acid. The compactness was measured by Rg, while SASA was used to calculate the electrostatic contributions of molecular solvation. PCA is one of the best techniques that help reduce the complexity of extracting the intensive motions in MD simulations analysis.35 The matrix was formed for the MD trajectory after excluding rotational and translational movements. The essential dynamics protocol was implemented to calculate the eigenvectors and eigenvalues and their projections along with the first two PCs.36,37 The diagonalized covariance matrix, eigenvectors, and eigenvalues were identified. The eigenvector of the matrix gives the multidimensional space and the displacement of atoms in the molecule in each direction. This analysis processed the essential subspace built to understand each atom’s movements, plotted by Cartesian trajectory coordinates using GROMACS utilities.
2.8. DFT Calculations
The DFT calculations were performed using the Spartan’20 package with the B3LYP/6-31G* basis set in the gas phase. Spartan software was installed in a Tyrone workstation with 128 GB RAM and CUDA-enabled NVIDIA (Model: Nvidia Tesla V100) graphics processing units (GPUs) with 16 GB RAM.
3. Results and Discussion
We screened a customized chemical library of biologically active molecules to discover potential lead inhibitors against the TTBK2 protein. This was followed by RO5, ADME/T property, and DFT calculations. Consequentially, all-atom MD simulations were performed. The MM/GBSA analysis was performed using the Schrödinger Prime module for the four docked complexes and the reference molecule.
3.1. TTBK2 Structure Modeling and Binding Site Analysis
The TTBK2 sequences in the FASTA format, that is, the primary protein sequence, were retrieved from UniProt, and the sequence was submitted as a query to perform Basic Local Alignment Search Tool (BLASTp) against Protein Data Bank (PDB) sequences. The PDB structure corresponding to human TTBK2 (6VRF) showed high identity, similarity, and query coverage to the query sequence; hence, it was selected as a template for model generation.38,39 The 3D structure was constructed using SWISS-MODEL to model missing amino acids (Gly31, Phe32, and Gly33) in the available crystal structure. After the successful run, the most reliable model of TTBK2 was chosen for further analysis. The PDB-Sum was referred for noting the binding site amino acid residues in the cocrystal ligand of TTBK2. The PDB-Sum entry showed an active pocket firmly bound with amino acid residues, namely, Ile35, Ala48, Lys50, Cys78, Met94, Gln95, Leu96, Gln97, Asn100, Ser 145, and Asp163.
3.2. Virtual Screening-Based Molecular Docking Analysis
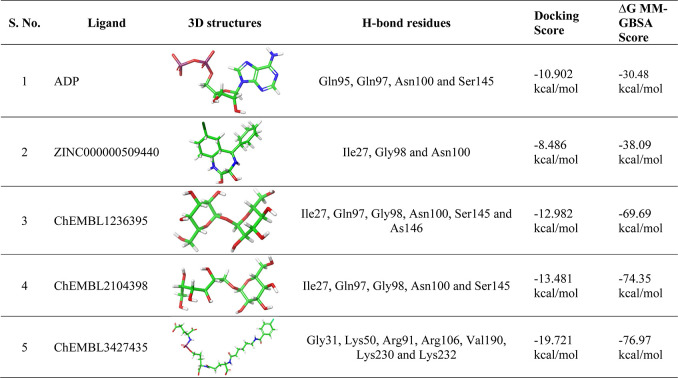
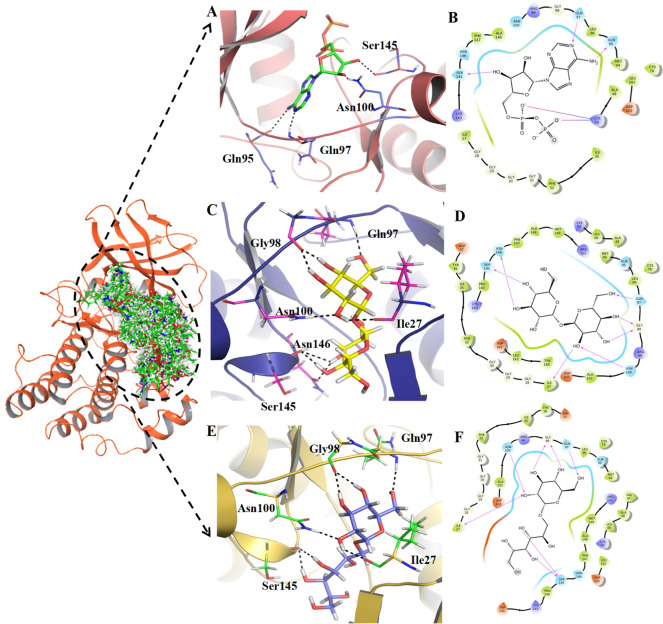
The Schrödinger GLIDE module offers high-accuracy screening of compounds to make extremely accurate binding mode predictions at every level. A grid of 20 Å × 20 Å × 20 Å was generated around the center of pocket residues that were exploited to check molecular docking interactions and scores between TTBK2 and the ligand dataset. The 10,900 ligands and ADP were docked (HTVS, SP, and XP) with the TTBK2 model, and the four top-ranked compounds were found to be ZINC000000509440, ChEMBL1236395, ChEMBL2104398, and ChEMBL3427435, based on their interaction energies. The complexes of the four compounds, along with the ADP reference complex, were analyzed at the active pocket of TTBK2. From the docking results, the best binding poses, interaction of amino acid residues, and docking scores of the compounds were noted, and the molecular graphics visualizations were generated using the PyMOL tool. The TTBK2-ADP-docked complex formed 4H-bonds with Gln95, Gln97, Asn100, and Ser145 residues toward the active pocket, forming stable confirmations with a docking score of −10.902 kcal/mol (Table 1). Additionally, the residues Ile27, Gly28, Gly29, Gly30, Gly31, Phe32, Ile35, Ala48, Cys78, Met94, Leu96, Gly98, Arg99, Asn100, Lys143, Ala148, Phe147, and Asn146 were found to form vdW interactions, which provide conformational stability to the complex (Figure 2A,B). Furthermore, for the complex of TTBK2-ADP reference molecule, MM-GBSA value was found to be −30.48 kcal/mol.
Table 1. Molecular Details of Four Proposed Compounds and the Reference Compound Produced by Molecular Docking and MM-GBSA Analysis.
Figure 2.
Representation of the binding poses, H-bonds, and amino acid residues toward the active pocket of TTBK2. (A,B) Ligand interaction site of cocrystal–ligand representing H-bond residues and the 2D plot displaying vdW residues around the 4 Å region, (C,D) ChEMBL1236395-TTBK2-docked complex and representation of the 2D plot, and (E,F) ChEMBL2104398 and 2D plot.
The molecular interaction of the compound ChEMBL1236395 with the TTBK2 active site is characterized by 6H-bonds with Ile27, Gln97, Gly98, Asn100, Ser145, and Asn146 and is stabilized with a docking score of −12.982 kcal/mol (Table 1). The amino acid residues, namely, Gly28, Gly29, Gly30, Phe32, Ile35, Tyr36, Asp37, Ala48, Leu49, Lys50, Cys78, Met94, Gln95, Leu96, Arg99, Ala102, Asp103, Lys143, Pro144, Phe147, Ala148, Met149, Arg151, Asp163, Leu162, and Tyr160, were involved in vdW interactions (Figure 2C,D). The MM-GBSA energy value of the complex was observed to be −69.69 kcal/mol.
The binding affinity of the TTBK2-ChEMBL2104398-docked complex displayed 5H-bonds with the amino acid residues Ile27, Gln97, Gly98, Asn100, and Ser145. Additional stability was accorded by the residues Gly28, Gly29, Gly30, Gly31, Phe32, Ile35, Tyr36, Val47, Ala48, Leu49, Lys50, Cys78, Met94, Gln95, Leu96, Arg99, Ala102, Asp103, Asp141, Lys143, Pro144, Asn146, Leu162, and Asp163 forming vdW interactions, stabilizing the docked complex (Figure 2E,F). The docking energy score and MM-GBSA of the complex were −13.481 and −74.35 kcal/mol, respectively, comparatively higher than those of the ADP-TTBK2 complex.
The docked complex TTBK2-ZINC000000509440 revealed the formation of 3H-bonds with the amino acid residues Ile27, Gly98, and Asn100, and hydrophobic interactions were contributed by Gly28, Gly29, Phe32, Ile35, Ala48, Lys50, Cys78, Met94, Gln95, Leu96, Gln97, Arg99, Asn100, Asp103, Ser145, Asn146, Phe147, and Ala148 (Supporting Information S2A,B). The docking score of the complexes is estimated to be −8.486 kcal/mol, and the MM/GBSA value is −38.09 kcal/mol (Table 1). The docked complex TTBK2-CHEMBL3427435 at the interactive site revealed the formation of 7H-bonds with the amino acid residues Gly31, Lys50, Arg91, Arg106, Val190, Lys230, and Lys232 and hydrophobic interactions with Ile27, Gly28, Gly30, Phe32, Ile35, Ala48, Glu64, Cys78, Met94, Gln95, Leu96, Gln97, Asn100, Asp141, Lys143, Ser145, Asn146, Leu162, Asp163, Phe164, Leu166, Phe186, Arg187, Gly188, Thr189, and Arg227, found in the 4 Å region (Supporting Information S2C,D). The docking score of the complexes is estimated to be −19.721 kcal/mol (Table 1). The MM-GBSA free energy estimates for the CHEMBL3427435 molecule are −76.97 kcal/mol at the TTBK2 active site pocket.
Overall, the MM/GBSA free binding energy (ΔG) scores of four drug complexes, namely, ZINC000000509440, ChEMBL1236395, ChEMBL2104398, and ChEMBL3427435, were found to be in the range of −38.09 to −76.97 kcal/mol. On the other hand, the reference ADP complex exhibited lower binding energy (−30.48 kcal/mol) (Table 1). To identify important amino acid residues involved in binding, 2D interaction plots were generated and visualized. The Prime-MM/GBSA analysis revealed that the proposed compounds rendered a more vital binding ability toward the active pocket of TTBK2.
3.3. ADME/T Properties
The ADME/T properties for all four compounds and the reference molecule were investigated by using Schrödinger QikProp. The molecular weight of the compounds was within the acceptable range (300 and 700 daltons) with dipole moment values between 2 and 7. The number of hydrogen bond donors (HBDs) of the compounds is 7–9, while the number of hydrogen bond acceptors (HBAs) is in the range of 6–20. The violations of Lipinski’s RO5 range between 0 and 2 and the % of human oral absorption for the compounds ranged “high” (Table 2). Other parameters were also found to be in the acceptable range. Therefore, from the results, it was evident that the ADME/T properties of the compounds were within the acceptable ranges and displayed minimal values.
Table 2. ADME/T Properties of the Ligands Compared to Those of the Cocrystal Ligand and Interpreting ADME/T and Lipinski’s Filters Using the QikProp Module of Schrödingera.
| (A) ADME/T properties | |||||||||||
|---|---|---|---|---|---|---|---|---|---|---|---|
| compound | MW | dipole | SASA | FOSA | FISA | PISA | WPSA | volume | donorHB | accptHB | HOA |
| cocrystal ligand | 429.219 | 7.039 | 660.251 | 72.19 | 404.148 | 178.256 | 5.658 | 1098.776 | 9 | 9.1 | high |
| ZINC000000509440 | 302.843 | 2.131 | 437.358 | 252.59 | 115.998 | 0 | 68.77 | 824.153 | 4 | 6.4 | high |
| ChEMBL1236395 | 342.299 | 5.293 | 520.068 | 210.852 | 309.216 | 0 | 0 | 952.581 | 8 | 18.7 | high |
| ChEMBL2104398 | 344.315 | 4.852 | 561.224 | 244.013 | 317.211 | 0 | 0 | 987.386 | 9 | 18.7 | high |
| ChEMBL3427435 | 706.615 | 4.742 | 1158.078 | 392.293 | 553.143 | 162.421 | 50.222 | 2086.721 | 7.5 | 20 | high |
| (B) ADME/T properties | ||||||||||
|---|---|---|---|---|---|---|---|---|---|---|
| compound | QPlogPo/w | QPlogS | CIQPlogS | QPlogHERG | QPPCaco | QPlogBB | QPPMDCK | QPlogKp | QPlogKhsa | PSA |
| cocrystal ligand | 1.179 | –2.391 | –4.253 | 3.095 | 0.024 | –4.635 | 0.001 | –7.092 | –1.854 | 230.238 |
| ZINC000000509440 | 0.059 | –0.008 | –0.4 | –3.437 | 48.943 | 0.59 | 55.277 | –7.591 | –0.256 | 63.272 |
| ChEMBL1236395 | –3.635 | –0.983 | 0.117 | –3.146 | 11.577 | –2.703 | 3.993 | –6.066 | –1.195 | 193.968 |
| ChEMBL2104398 | –3.83 | –0.664 | 0.109 | –3.887 | 9.723 | –3.358 | 3.307 | –5.734 | –1.567 | 192.794 |
| ChEMBL3427435 | 0.898 | –3.726 | –4.237 | 4.333 | 0 | –8.811 | 0 | –8.646 | –2.562 | 358.379 |
Minimal ranges: MW = molecular weight (130.0/725.0), accPthB = acceptor—hydrogen bonds (2.0/20.0), rotor = no. of rotatable bonds (0.0/15.0), log P o/w = log P for octanol/water (−2.0/6.5), dipole = dipole moment (1.0/12.5), log S = log S for aqueous solubility (−6.5/0.5), SASA = total solvent accessible surface area (300.0/1000.0), CI log S = log S—conformation-independent (−6.5/0.5), FOSA = hydrophobic solvent accessible surface area (0.0/750.0), log BB = log BB for brain/blood (−3.0/1.2), FISA = hydrophilic solvent accessible surface area (7.0/330.0), log Kp = log Kp for skin permeability (Kp in cm/h), PISA = carbon Pi solvent accessible surface area (0.0/450.0), log Khsa = log Khsa serum protein binding (−1.5/1.5), WPSA = weakly polar solvent accessible surface area (0.0/175.0), Lipinski Rule of 5 Violations-RO5 (maximum is 4), PSA = vdW polar surface area (7.0/200.0), human oral absorption in GI (low/high) (<25% is poor), volume = molecular volume (Â3) (500.0/2000.0), apparent Caco-2 permeability (nm/s) (<25 poor, >500 excellent), donorHB = donor—hydrogen bonds (0.0/6.0), and apparent MDCK permeability (nm/s) (<25 poor, >500 excellent).
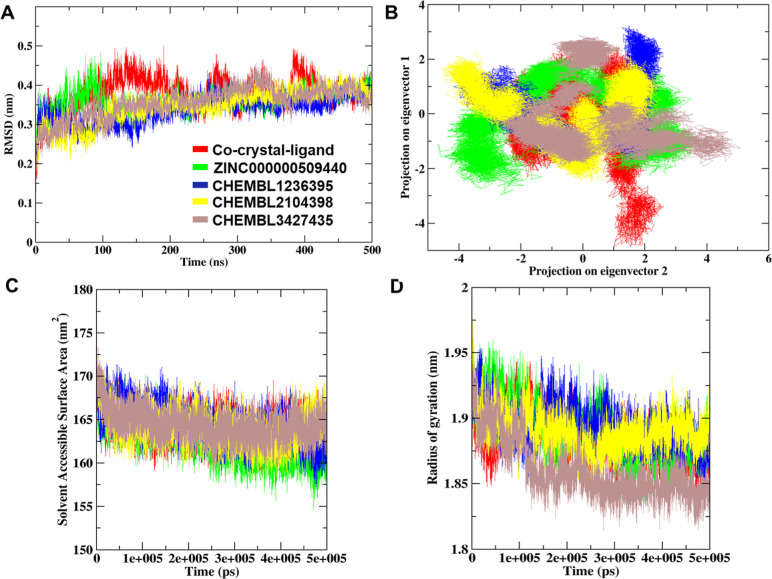
The RMSD analysis was performed for the four docked complexes and the ADP-TTBK2 complexes to assess the residual flexibility of TTBK2. The ZINC000000509440, ChEMBL1236395, ChEMBL2104398, and ChEMBL3427435 showed steady RMSD with a threshold of average 0.35, 0.33, 0.34, and 0.35 nm, respectively, whereas the TTBK2 cocrystal complex revealed an RMSD of 0.37 nm (Supporting Information S3). Additionally, the RMSD of the cocrystal of ADP showed higher fluctuations at 100–220 ns, and the next higher peaks were observed at 250–270 ns and 380–420 ns which reach up to 0.5 nm (Figure 3A). These fluctuations were found to be relatively higher as compared to those of the other complexes. The RMSD results of four compounds revealed a stable binding with TTBK2 compounds, indicating a strong binding between the complexes, which bolstered the docking results.
Figure 3.
MD simulation-allied parameters of the four drug complexes and reference molecule (ADP)-docked complex. (A) RMS deviation graph plotted against the cocrystal ligand, ZINC000000509440, ChEMBL1236395, ChEMBL2104398, and ChEMBL3427435. (B) The dynamic energy fluctuation graph plotted between eigenvector 1 and eigenvector 2 shows the conformational space of Cα-atoms for all five docked complexes. (C) SASA analysis plot of five TTBK2-docked complexes. (D) Comparative Rg plot of five docked complexes during 500 ns MD simulations.
PCA was performed to understand the dynamic behavior of TTBK2 and the conformational subspace of complexes. The two eigenvectors 1 and 2 gave the displacement of atomic fluctuation and the type of motion obtained between the complexes. The eigenvector values of the four docked complexes were calculated; ZINC000000509440 showed eigenvector 1 in the range of −2 to −2.5 nm2 and eigenvector 2 in the range of −4 to 3 nm2. The molecule ChEMBL1236395 displayed eigenvector 1 in the range between −3 and −1 nm2 and eigenvector 2 in the range of −4 to 2 nm2. Similarly, ChEMBL2104398 displayed eigenvector 1 in the range 2 to −1.5 nm2 and eigenvector 2 in the range −4 to −2 nm2, and ChEMBL3427435 showed eigenvector 1 in the range −2.5 to −1.5 nm2 and eigenvector 2 in the range −2 to −5 nm2. The cocrystal ligand showed eigenvector 1 in the range −2 to −4.5 nm2 and eigenvector 2 in the range −2.5 to −2.5 nm2, which comparatively occupied larger space than the other complexes (Figure 3B). The results revealed that the four compounds showed restricted space in complex with TTBK2, leading to well-defined internal motion better than that of the reference molecule. Furthermore, the PCA of eigenvector indices from the Cα atom MD simulations of RMS fluctuations of each complex illustrated the comparative fluctuations of all the complexes (Supporting Information S4). The RMS fluctuations 1 and 2 portrayed higher fluctuation of the atoms found to be the cocrystal, ZINC000000509440, and ChEMBL3427435 complexes. However, complexes with molecules ZINC000000509440 and ChEMBL3427435 showed minimal fluctuation compared to the cocrystal.
3.4. SASA and Rg Analysis
SASA analysis was performed to understand the solvent accessibility of all the complexes during the 500 ns MD simulation analysis of the trajectories. The results were estimated by an average of SASA values of the cocrystal ligand, ZINC000000509440, ChEMBL1236395, ChEMBL2104398, and ChEMBL3427435 which were found to be 164.25, 163.05, 164.51, 164.10, and 164.45 nm2, respectively (Figure 3C and Supporting Information S3). The results revealed that the four compounds rendered stable hydrophobic contacts. The docked complexes like the cocrystal ligand and others make the protein accessible to the solvent molecules. The compactness of all docked complexes was evaluated by Rg analysis. The results showed that the Rg values of the cocrystal ligand, ZINC000000509440, ChEMBL1236395, ChEMBL2104398, and ChEMBL3427435 remained stable with a range between ∼1.87 and ∼1.90 nm. The results with Rg an average of 1.88 nm for the cocrystal ligand and 1.89, 1.90, 1.89, and 1.87 nm for the proposed compounds ZINC000000509440, ChEMBL1236395, ChEMBL2104398, and CHEMBL3427435, respectively (Figure 3D and Supporting Information S3). The Rg results revealed a stable folding behavior of TTBK2 in the presence of three proposed compounds, indicating high compactness except for the ADP and ChEMBL3427435 complex.
3.5. Relative Residue Fluctuations
To understand the flexibility of each residue, Cα-relative residue fluctuations were analyzed for the TTBK2 with ZINC000000509440, ChEMBL1236395, ChEMBL2104398, and ChEMBL3427435. The more significantly declined drift of the RMSF graph indicated a huge increase in atomic movements of drug binding which could cause instability. ZINC000000509440 presented high unfavorable fluctuations at positions L96, S107, Q108, and S109 near −0.16 nm fluctuation. The complex with ChEMBL1236395 displayed minimum negative drifts at residue positions such as S109, near −0.11 nm-high fluctuation. Furthermore, the complex CHEMBL2104398 revealed maximum fluctuations at residue positions S107 and S109 (Figure 4C). Summarily, the comparative residue fluctuation analysis revealed a high degree of flexibility on the CHEMBL3427435 complex and showed residues S109, L259, and V279 with a minimum fluctuation peak, which is near −0.11 nm. Overall, relative residual fluctuation analysis portrayed that the docked complexes at the binding site residues do not impact the stability of TTBK2.
Figure 4.
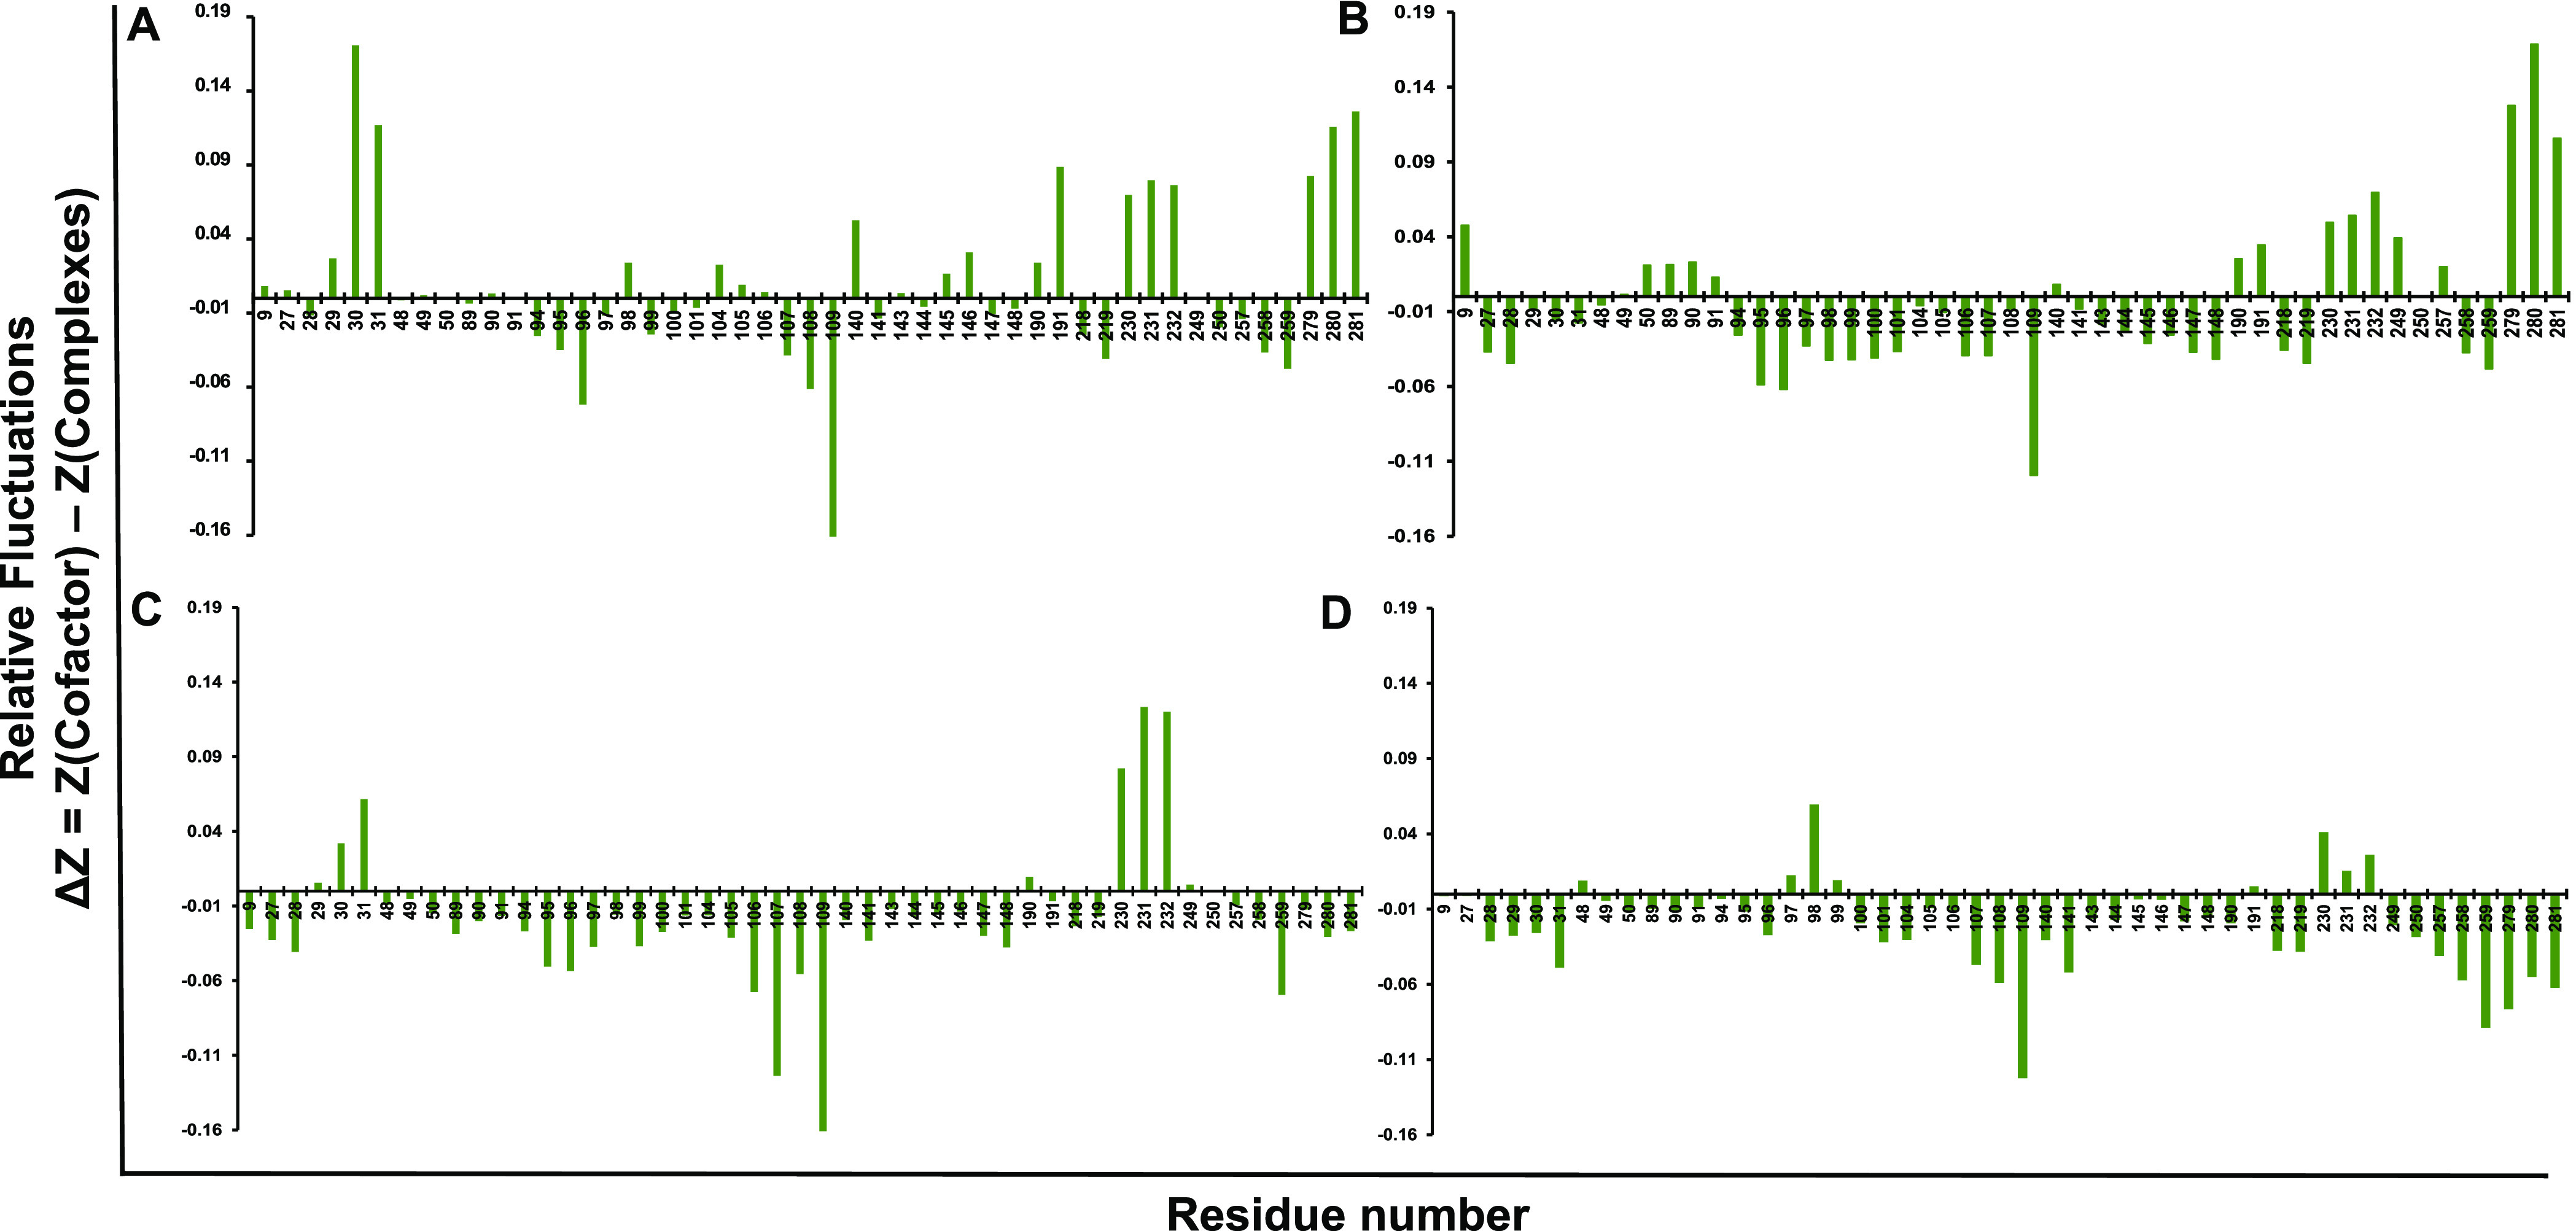
Relative residue fluctuation plot of TTBK2 (A) ZINC000000509440, (B) CHEMBL1236395, (C) CHEMBL2104398, and (D) CHEMBL3427435 complexes during MD simulations.
3.6. Hydrogen Bond
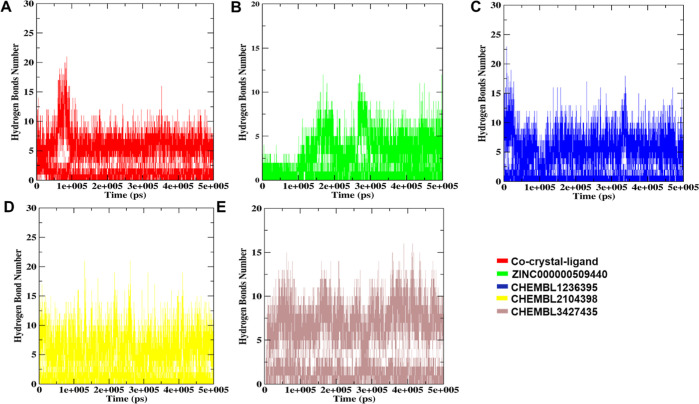
All the best-docked complexes, along with cocrystal ligands, were analyzed for hydrogen bonding patterns to calculate the total number of bonds formed during the MD simulation. As seen from Figure 5, the ZINC000000509440, ChEMBL1236395, ChEMBL2104398, and ChEMBL3427435 complexes showed that the number of hydrogen bonds was 0–10, 0–15, 0–14, and 0–15, respectively (Supporting Information S3). Consequently, the ADP-TTBK2-docked complexes revealed the number of H-bonds to be between 0 and 15. The results depicted a maximum and steady number of hydrogen bonds in all four complexes that indicated a strong interaction between the ligand and receptor, revealing stable geometry throughout the total simulation time.
Figure 5.
H-bond plots of five docked complexes analyzed during the entire simulation time of 500 ns. (A) Number of H-bonds between TTBK2 and the co-crystal-ligand, (B) H-bond between TTBK2 and the ZINC000000509440-docked complex, (C) TTBK2-ChEMBL1236395-docked complex, (D) TTBK2-ChEMBL2104398-docked complex, and (E) TTBK2-ChEMBL3427435-docked complex.
3.7. SSE, FEL, and Density Distribution Analysis
The change in SSE was examined for the docked complexes, which contribute to the shape of the TTBK2 protein structure. The analysis revealed that the four complexes, namely, ZINC000000509440, ChEMBL1236395, ChEMBL2104398, and ChEMBL3427435, projected stable structural plasticity leading to stable conformational changes and strong binding unlike that in the ADP-TTBK2 complex (Supporting Information S5).
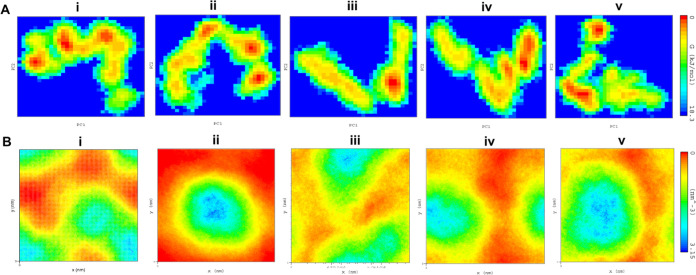
The conformational stabilities of the four proposed docked complexes were examined by FEL analysis using the PC1 and PC2 eigenvectors. The values of FEL for the cocrystal ligand, ZINC000000509440, ChEMBL1236395, ChEMBL2104398, and ChEMBL3427435 ranged from 0 to 17.1, 17.5, 18.3, 17.4, and 17.9 kJ/mol, respectively (Figure 6A). The results showed that the docked complexes revealed steady states on the folding behavior of TTBK2 following ADP. The density distribution analysis was performed to understand the atomic orientation toward TTBK2 and drug molecules. The results displayed a steady density area value for the cocrystal ligand, ZINC000000509440, ChEMBL1236395, ChEMBL2104398, and ChEMBL3427435, with an average of 3.15 nm–3 (Figure 6B). The results showed that the density areas of each of the atoms in the four docked complexes were stable, and the energy wells shared similar binding patterns indicating strong binding to the active pocket of TTBK2.
Figure 6.
FEL and density distribution analysis. (A) Free energy wells revealing the folding behavior, the direction of motions, and magnitude of dynamics of the docked complexes and (B) density distribution of docked complexes obtained in the MD trajectories during simulation timeframes: (i) co-crystal ligand, (ii) ZINC000000509440, (iii) ChEMBL1236395, (iv) ChEMBL2104398, and (v) ChEMBL3427435.
3.8. Covariance Matrix Analysis
The atomic motions in four docked complexes were analyzed using covariance matrices to calculate the trace values with a maximum number of eigenvectors. The results from the covariance analysis reveal that the four complexes ZINC000000509440, ChEMBL1236395, ChEMBL2104398, and ChEMBL3427435 were found to be in stable atomic conformation, with a covariance matrix in the range of −0.0772 to 0.324, 0.256, 0.278, and 0.438 nm2, respectively; see Supporting Information S6. The ADP-TTBK2 complex displayed a covariance matrix with a range of −0.0772 to 0.256 nm2. The results from the matrix analysis revealed that the proposed four compound complexes are stable with steady residue displacement and amplitude toward TTBK2 compared to the ADP complex.
3.9. DFT Studies
DFT studies cross various disciplines and play an essential role in physical sciences.40 DFT is widely employed to underpin the structural features, photophysical properties, and inter-/intramolecular processes at the molecular/supramolecular level.41−43 Using this technique, one can correlate the characteristics of frontier molecular orbitals (FMOs) with their reactivity, stability, and activity/performance. For instance, a molecule with a low energy gap is considered soft (high reactivity), while the one with a large gap is hard (low reactivity).44 Besides, chemical descriptors such as the ionization energy (IE), electron affinity (EA), electronegativity (χ), chemical potential (μ), chemical hardness (η), softness (σ), and electrophilicity index (ω) also give a good landscape of the stability, electrophilicity/nucleophilicity, etc., of a compound.45,46 In the past, attempts have also been made to correlate the bioactivity (IC50) of heterocyclic compounds with their FMO energy level.47 Therefore, to understand the molecular fragment contribution, we carried out DFT calculations using B3LYP/6-31G* in the gas phase (SPARTAN 20).
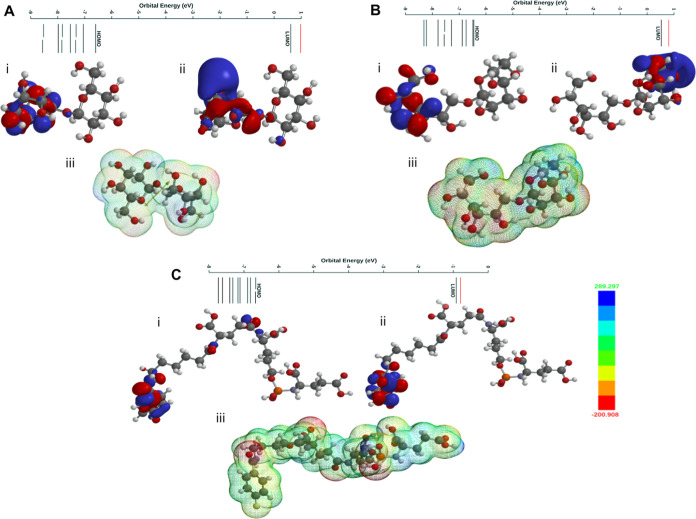
The FMOs of the screened compounds are depicted in Figure 7A–C and Supporting Information S7A,B. It is clear from the figures that in all molecules, FMOs are delocalized over the aromatic fragment of studied compounds. One exciting feature that we noted was that except for ZINC000000509440, all other screened compounds exhibit the highest occupied molecular orbital (HOMO) level (−6.45, −6.59, and −6.66 eV) close to that of the cocrystal ligand (−6.57 eV). This suggests their similar molecular features. However, the band gap (Eg) of the cocrystal ligand was 5.27 eV which was slightly higher in the case of screened compounds (5.74–5.98 eV) and is due to the variation in lowest unoccupied molecular orbital (LUMO) levels. In addition, analysis of the electrostatic potential (ESP) map revealed expected charge density (σ and π systems as blue and red, respectively) over the molecule, which is also responsible for non-covalent interactions within a system.
Figure 7.
(A) HOMO/LUMO orbitals and the energy potential map of ChEMBL1236395. (B) HOMO/LUMO orbitals and the energy potential map of ChEMBL2104398. (C) HOMO/LUMO orbitals and the energy potential map of ChEMBL3427435. The color of the potential is shown between −200 (red) and +289 kJ/mol (blue). The ESP surface area of the mesh model. The DFT calculations were performed using the Spartan’20 package with B3LYP/6-31G* in the gas phase.
The calculated chemical descriptors of the screened compounds are given in Table 3.44 Based on the energies of frontier orbitals, the calculated descriptor values are in a similar range. Besides, compounds showed a negative μ value, indicating their stable nature. Attempts have also been made to find a correlation between the LUMO level and the docking score of the compound (Figure 7A–C). It is interesting to note that a compound with a higher LUMO level favors better docking (higher docking score) and, therefore, should possess better activity.
Table 3. Calculated Chemical Reactivity Parameters.
| comp | EHOMO (eV) | ELUMO (eV) | ΔE (eV)a | I (eV)b | A (eV)c | χ (eV)d | η (eV)e | σ (eV–1)f | μ (eV)g | ω (eV)h |
|---|---|---|---|---|---|---|---|---|---|---|
| cocrystal | –6.57 | –1.30 | 5.27 | 6.57 | 1.30 | 3.93 | 2.63 | 0.19 | –3.93 | 2.68 |
| ZINC 000000509440 | –5.19 | –3.28 | 1.91 | 5.19 | 3.28 | 4.23 | 0.95 | 0.52 | –4.23 | 9.42 |
| ChEMBL 1236395 | –6.59 | –0.61 | 5.98 | 6.59 | 0.61 | 4.1 | 2.99 | 0.16 | –4.1 | 2.8 |
| ChEMBL 2104398 | –6.45 | –0.53 | 5.92 | 6.45 | 0.53 | 3.5 | 2.96 | 0.16 | –3.5 | 2.0 |
| ChEMBL 3427435 | –6.66 | –0.92 | 5.74 | 6.66 | 0.92 | 3.8 | 2.87 | 0.17 | –3.8 | 2.5 |
|EHOMO – ELUMO|.
–EHOMO.
–ELUMO.
(I + A)/2.
(I – A)/2.
1/2η.
–(I + A)/2.
μ2/2η.
4. Conclusions
This study identified potential TTBK2 antagonists using computational techniques to discover potential antagonist leads against TTBK2 activity. The homology model of a refined three-dimensional structure of TTBK2 was used to screen approved drug libraries. Out of the 10,900 screened molecules, we identified 4 molecules with a strong affinity toward the receptor. These compounds (ZINC000000509440, ChEMBL1236395, ChEMBL2104398, and ChEMBL3427435) were selected based on the binding affinity score, energies, and interaction pose at the TTBK2 active site. Moreover, the compounds also conformed to Lipinski’s RO5 and ADME/T parameters, which indicates their drug-likeliness properties. The DFT calculation has been performed to optimize the molecular geometry of the molecules. The relatively low gap of HOMO–LUMO and its high value of the dipole moment by the ESP map confirm the reactivity of the molecules. Finally, the MD simulations of the four docked complexes confirmed the stable conformational behavior of the ligands to act as TTBK2 binders. These compounds may be explored experimentally for their potential to act as TTBK2 inhibitors, which can facilitate the development of drugs for Alzheimer’s disease.
Acknowledgments
S.A. is a recipient of a Research Associate Fellowship from the Indian Council of Medical Research [grant no. 2019–6039 file no. ISRM/11(83)/2019], India. K.H. acknowledges the Department of Biotechnology, India, for the DBT-BioCARe-Women Scientist fellowship (grant no. BT/PR31715/BIC/101/1233/2019). All the authors acknowledge a bioinformatics infrastructure grant by the Department of Biotechnology, Ministry of Science and Technology, Government of India (grant no. BT/PR40151/BTIS/137/5/2021), awarded to D.G. The authors acknowledge the usage of the ICGEB HPC facility to carry out the study.
Supporting Information Available
The Supporting Information is available free of charge at https://pubs.acs.org/doi/10.1021/acsomega.3c00225.
Interaction plot illustrating the interaction of the ADP and TTBK2 generated by PDBSUM; docking study; binding poses, H-bonds, and amino acid residues around the active pocket of TTBK2, interaction site, and 2D plot displaying vdW residues around the 4 Å region; MD simulation study; average of RMSD, Rg, and SASA values observed in the 500 ns MD simulation; PCA of eigenvector indices from the Cα atom MD simulations of RMS fluctuations 1 and 2; secondary structure element analysis to monitor the helix, loop, and β-sheets generated using do_dssp; PCA results as two intense color representations, red (large fluctuations) and blue (minor changes); DFT calculations performed using the Spartan’20 package with B3LYP/6-31G* in the gas phase; DFT analysis of HOMO/LUMO orbitals showing the energy potential map of the co-crystal ligand and the shortlisted compounds; and color of the potential shown in the range −200 (red)–+289 kJ/mol (blue) (PDF)
Author Contributions
S.A. contributed to literature mining, entire in silico experiments, analysis, and write-up in the manuscript. K.H. contributed to the write-up, review, and corrections in the manuscript. D.G. contributed to designing the hypothesis, correspondence, major inputs, and entire corrections in the manuscript.
The authors declare no competing financial interest.
Supplementary Material
References
- Watanabe T.; Kakeno M.; Matsui T.; Sugiyama I.; Arimura N.; Matsuzawa K.; Shirahige A.; Ishidate F.; Nishioka T.; Taya S.; Hoshino M.; Kaibuchi K. TTBK2 with EB1/3 regulates microtubule dynamics in migrating cells through KIF2A phosphorylation. J. Cell Biol. 2015, 210, 737–751. 10.1083/jcb.201412075. [DOI] [PMC free article] [PubMed] [Google Scholar]
- Lo C.-H.; Lin I.-H.; Yang T. T.; Huang Y.-C.; Tanos B. E.; Chou P.-C.; Chang C.-W.; Tsay Y.-G.; Liao J.-C.; Wang W.-J. Phosphorylation of CEP83 by TTBK2 is necessary for cilia initiation. J. Cell Biol. 2019, 218, 3489–3505. 10.1083/jcb.201811142. [DOI] [PMC free article] [PubMed] [Google Scholar]
- Stinchcombe J. C.; Griffiths G. M. Communication, the centrosome and the immunological synapse. Philos. Trans. R. Soc., B 2014, 369, 20130463. 10.1098/rstb.2013.0463. [DOI] [PMC free article] [PubMed] [Google Scholar]
- Taylor L. M.; McMillan P. J.; Liachko N. F.; Strovas T. J.; Ghetti B.; Bird T. D.; Keene C. D.; Kraemer B. C. Pathological phosphorylation of tau and TDP-43 by TTBK1 and TTBK2 drives neurodegeneration. Mol. Neurodegener. 2018, 13, 7–14. 10.1186/s13024-018-0237-9. [DOI] [PMC free article] [PubMed] [Google Scholar]
- Liao J.-C.; Yang T. T.; Weng R. R.; Kuo C.-T.; Chang C.-W. TTBK2: A Tau Protein Kinase beyond Tau Phosphorylation. BioMed Res. Int. 2015, 2015, 575170. 10.1155/2015/575170. [DOI] [PMC free article] [PubMed] [Google Scholar]
- Taylor L. M.Understanding the role and regulation of TTBK1/2 during neurodegenerative disease progression. Ph.D. Thesis, University of Washington, 2018. [Google Scholar]
- Taylor L. M.; McMillan P. J.; Kraemer B. C.; Liachko N. F. Tau tubulin kinases in proteinopathy. FEBS J. 2019, 286, 2434–2446. 10.1111/febs.14866. [DOI] [PMC free article] [PubMed] [Google Scholar]
- McMillan P.; Wheeler J.; Gatlin R. E.; Taylor L.; Strovas T.; Baum M.; Bird T. D.; Latimer C.; Keene C. D.; Kraemer B. C.; Liachko N. F. Adult onset pan-neuronal human tau tubulin kinase 1 expression causes severe cerebellar neurodegeneration in mice. Acta Neuropathol. Commun. 2020, 8, 200. 10.1186/s40478-020-01073-7. [DOI] [PMC free article] [PubMed] [Google Scholar]
- Ahamad S.; Kanipakam H.; Kumar V.; Gupta D. A molecular journey to check the conformational dynamics of tau tubulin kinase 2 mutations associated with Alzheimer’s disease. RSC Adv. 2021, 11, 1320–1331. 10.1039/d0ra07659g. [DOI] [PMC free article] [PubMed] [Google Scholar]
- Ikezu S.; Ikezu T. Tau-tubulin kinase. Front. Mol. Neurosci. 2014, 7, 33. 10.3389/fnmol.2014.00033. [DOI] [PMC free article] [PubMed] [Google Scholar]
- Goetz S. C.; Liem K. F. Jr.; Anderson K. V. The spinocerebellar ataxia-associated gene Tau tubulin kinase 2 controls the initiation of ciliogenesis. Cell 2012, 151, 847–858. 10.1016/j.cell.2012.10.010. [DOI] [PMC free article] [PubMed] [Google Scholar]
- Bender C.; Ullrich A. PRKX, TTBK2 and RSK4 expression causes sunitinib resistance in kidney carcinoma-and melanoma-cell lines. Int. J. Cancer 2012, 131, E45–E55. 10.1002/ijc.26486. [DOI] [PubMed] [Google Scholar]
- Ha E. S.; Choi S.; In K. H.; Lee S. H.; Lee E. J.; Lee S. Y.; Kim J. H.; Shin C.; Shim J. J.; Kang K. H.; Phark S.; Sul D. Identification of proteins expressed differently among surgically resected stage I lung adenocarcinomas. Clin. Biochem. 2013, 46, 369–377. 10.1016/j.clinbiochem.2012.11.014. [DOI] [PubMed] [Google Scholar]
- Liachko N. F.; McMillan P. J.; Strovas T. J.; Loomis E.; Greenup L.; Murrell J. R.; Ghetti B.; Raskind M. A.; Montine T. J.; Bird T. D.; Leverenz J. B.; Kraemer B. C. The tau tubulin kinases TTBK1/2 promote accumulation of pathological TDP-43. PLoS Genet. 2014, 10, e1004803 10.1371/journal.pgen.1004803. [DOI] [PMC free article] [PubMed] [Google Scholar]
- Liao J.-C.; Yang T. T.; Weng R. R.; Kuo C.-T.; Chang C.-W. TTBK2: a tau protein kinase beyond tau phosphorylation. BioMed Res. Int. 2015, 2015, 575170. 10.1155/2015/575170. [DOI] [PMC free article] [PubMed] [Google Scholar]
- Bao C.; Bajrami B.; Marcotte D. J.; Chodaparambil J. V.; Kerns H. M.; Henderson J.; Wei R.; Gao B.; Dillon G. M. Mechanisms of regulation and diverse activities of tau-tubulin kinase (TTBK) isoforms. Cell. Mol. Neurobiol. 2021, 41, 669–685. 10.1007/s10571-020-00875-6. [DOI] [PMC free article] [PubMed] [Google Scholar]
- Sterling T.; Irwin J. J. ZINC 15–ligand discovery for everyone. J. Chem. Inf. Model. 2015, 55, 2324–2337. 10.1021/acs.jcim.5b00559. [DOI] [PMC free article] [PubMed] [Google Scholar]
- Mendez D.; Gaulton A.; Bento A. P.; Chambers J.; De Veij M.; Félix E.; Magariños M. P.; Mosquera J. F.; Mutowo P.; Nowotka M.; Gordillo-Marañón M.; Hunter F.; Junco L.; Mugumbate G.; Rodriguez-Lopez M.; Atkinson F.; Bosc N.; Radoux C. J.; Segura-Cabrera A.; Hersey A.; Leach A. R. ChEMBL: towards direct deposition of bioassay data. Nucleic Acids Res. 2019, 47, D930–D940. 10.1093/nar/gky1075. [DOI] [PMC free article] [PubMed] [Google Scholar]
- Abraham M. J.; Murtola T.; Schulz R.; Páll S.; Smith J. C.; Hess B.; Lindahl E. GROMACS: High performance molecular simulations through multi-level parallelism from laptops to supercomputers. SoftwareX 2015, 1-2, 19–25. 10.1016/j.softx.2015.06.001. [DOI] [Google Scholar]
- Schrödinger R.Maestro; Schrödinger; LLC: New York, NY, 2020.
- Bouskila M.; Esoof N.; Gay L.; Fang E. H.; Deak M.; Begley M. J.; Cantley L. C.; Prescott A.; Storey K. G.; Alessi D. R. TTBK2 kinase substrate specificity and the impact of spinocerebellar-ataxia-causing mutations on expression, activity, localization and development. Biochem. J. 2011, 437, 157–167. 10.1042/bj20110276. [DOI] [PMC free article] [PubMed] [Google Scholar]
- Waterhouse A.; Bertoni M.; Bienert S.; Studer G.; Tauriello G.; Gumienny R.; Heer F. T.; de Beer T. A. P.; Rempfer C.; Bordoli L.; Lepore R.; Schwede T. SWISS-MODEL: homology modelling of protein structures and complexes. Nucleic Acids Res. 2018, 46, W296–W303. 10.1093/nar/gky427. [DOI] [PMC free article] [PubMed] [Google Scholar]
- Sussman J. L.; Lin D.; Jiang J.; Manning N. O.; Prilusky J.; Ritter O.; Abola E. E. Protein Data Bank (PDB): database of three-dimensional structural information of biological macromolecules. Acta Crystallogr., Sect. D: Biol. Crystallogr. 1998, 54, 1078–1084. 10.1107/s0907444998009378. [DOI] [PubMed] [Google Scholar]
- Laskowski R. A.; Jabłońska J.; Pravda L.; Vařeková R. S.; Thornton J. M. PDBsum: Structural summaries of PDB entries. Protein Sci. 2018, 27, 129–134. 10.1002/pro.3289. [DOI] [PMC free article] [PubMed] [Google Scholar]
- DeLano W. L.Pymol: An open-source molecular graphics tool. CCP4 Newsletter on Protein Crystallography, 2002; Vol. 40( (1), ), pp 82–92.
- Jorgensen W. L.; Maxwell D. S.; Tirado-Rives J. Development and testing of the OPLS all-atom force field on conformational energetics and properties of organic liquids. J. Am. Chem. Soc. 1996, 118, 11225–11236. 10.1021/ja9621760. [DOI] [Google Scholar]
- Gudipati S.; Muttineni R.; Mankad A. U.; Pandya H. A.; Jasrai Y. T. Molecular docking based screening of Noggin inhibitors. Bioinformation 2018, 14, 15. 10.6026/97320630014015. [DOI] [PMC free article] [PubMed] [Google Scholar]
- Halgren T. A.; Murphy R. B.; Friesner R. A.; Beard H. S.; Frye L. L.; Pollard W. T.; Banks J. L. Glide: a new approach for rapid, accurate docking and scoring. 2. Enrichment factors in database screening. J. Med. Chem. 2004, 47, 1750–1759. 10.1021/jm030644s. [DOI] [PubMed] [Google Scholar]
- Schrödinger L.QikProp, version 3.5; Schrödinger: New York, NY, 2012.
- Selvaraj C.; Priya R. B.; Lee J.-K.; Singh S. K. Mechanistic insights of SrtA–LPXTG blockers targeting the transpeptidase mechanism in Streptococcus mutans. RSC Adv. 2015, 5, 100498–100510. 10.1039/c5ra12869b. [DOI] [Google Scholar]
- Schüttelkopf A. W.; Van Aalten D. M. F. PRODRG: a tool for high-throughput crystallography of protein–ligand complexes. Acta Crystallogr., Sect. D: Biol. Crystallogr. 2004, 60, 1355–1363. 10.1107/S0907444904011679. [DOI] [PubMed] [Google Scholar]
- Van Der Spoel D.; Lindahl E.; Hess B.; Groenhof G.; Mark A. E.; Berendsen H. J. GROMACS: fast, flexible, and free. J. Comput. Chem. 2005, 26, 1701–1718. 10.1002/jcc.20291. [DOI] [PubMed] [Google Scholar]
- Lee J.; Cheng X.; Swails J. M.; Yeom M. S.; Eastman P. K.; Lemkul J. A.; Wei S.; Buckner J.; Jeong J. C.; Qi Y.; Jo S.; Pande V. S.; Case D. A.; Brooks C. L.; MacKerell A. D.; Klauda J. B.; Im W. CHARMM-GUI input generator for NAMD, GROMACS, AMBER, OpenMM, and CHARMM/OpenMM simulations using the CHARMM36 additive force field. J. Chem. Theory Comput. 2016, 12, 405–413. 10.1021/acs.jctc.5b00935. [DOI] [PMC free article] [PubMed] [Google Scholar]
- Wang H.; Nakamura H.; Fukuda I. A critical appraisal of the zero-multipole method: Structural, thermodynamic, dielectric, and dynamical properties of a water system. J. Chem. Phys. 2016, 144, 114503. 10.1063/1.4943956. [DOI] [PubMed] [Google Scholar]
- Sang P.; Wang L.; Cao J. Parametric functional principal component analysis. Biometrics 2017, 73, 802–810. 10.1111/biom.12641. [DOI] [PubMed] [Google Scholar]
- Abdi H.; Williams L. J. Principal component analysis. Wiley Interdiscip. Rev. Comput. Stat. 2010, 2, 433–459. 10.1002/wics.101. [DOI] [Google Scholar]
- Ahamad S.; Hema K.; Kumar V.; Gupta D. The structural, functional, and dynamic effect of Tau tubulin kinase1 upon a mutation: A neuro-degenerative hotspot. J. Cell. Biochem. 2021, 122, 1653–1664. 10.1002/jcb.30112. [DOI] [PubMed] [Google Scholar]
- UniProt: a worldwide hub of protein knowledge. Nucleic Acids Res. 2019, 47, D506–D515. 10.1093/nar/gky1049. [DOI] [PMC free article] [PubMed] [Google Scholar]
- Altschul S. F.; Gish W.; Miller W.; Myers E. W.; Lipman D. J. Basic local alignment search tool. J. Mol. Biol. 1990, 215, 403–410. 10.1016/s0022-2836(05)80360-2. [DOI] [PubMed] [Google Scholar]
- van Mourik T.; Bühl M.; Gaigeot M.-P. Density functional theory across chemistry, physics and biology. Philos. Trans. R. Soc., A 2014, 372, 20120488. 10.1098/rsta.2012.0488. [DOI] [PMC free article] [PubMed] [Google Scholar]
- Haque A.; Al-Balushi R.; Al-Busaidi I. J.; Al-Rasbi N. K.; Al-Bahri S.; Al-Suti M. K.; Khan M. S.; Abou-Zied O. K.; Skelton J. M.; Raithby P. R. Two Is Better than One? Investigating the Effect of Incorporating Re (CO) 3Cl Side Chains into Pt (II) Diynes and Polyynes. Inorg. Chem. 2020, 60, 745–759. 10.1021/acs.inorgchem.0c02747. [DOI] [PubMed] [Google Scholar]
- Al-Balushi R. A.; Haque A.; Jayapal M.; Al-Suti M. K.; Husband J.; Khan M. S.; Koentjoro O. F.; Molloy K. C.; Skelton J. M.; Raithby P. R. Experimental and theoretical investigation for the level of conjugation in carbazole-based precursors and their mono-, di-, and polynuclear Pt (II) complexes. Inorg. Chem. 2016, 55, 6465–6480. 10.1021/acs.inorgchem.6b00523. [DOI] [PubMed] [Google Scholar]
- Al-Balushi R. A.; Haque A.; Jayapal M.; Al-Suti M. K.; Husband J.; Khan M. S.; Skelton J. M.; Molloy K. C.; Raithby P. R. Impact of the alkyne substitution pattern and metalation on the photoisomerization of azobenzene-based Platinum (II) diynes and polyynes. Inorg. Chem. 2016, 55, 10955–10967. 10.1021/acs.inorgchem.6b01509. [DOI] [PubMed] [Google Scholar]
- Mermer A.; Bayrak H.; Alyar S.; Alagumuthu M. Synthesis, DFT calculations, biological investigation, molecular docking studies of β-lactam derivatives. J. Mol. Struct. 2020, 1208, 127891. 10.1016/j.molstruc.2020.127891. [DOI] [Google Scholar]
- Parr R. G.; Szentpály L. v.; Liu S. Electrophilicity index. J. Am. Chem. Soc. 1999, 121, 1922–1924. 10.1021/ja983494x. [DOI] [Google Scholar]
- Faizi M. S. H.; Alam M. J.; Haque A.; Ahmad S.; Shahid M.; Ahmad M. Experimental and theoretical characterization of organic salt: 2-((4-bromophenyl) amino) pyrido [1, 2-a] quinoxalin-11-ium bromide monohydrate synthesized via oxidative cyclization. J. Mol. Struct. 2018, 1156, 457–464. 10.1016/j.molstruc.2017.12.014. [DOI] [Google Scholar]
- Mushtaque M.; Ahamad S.; Jahan M.; Hussain K.; Khan M. S. Azole-based compounds as antiamoebic agents: a perspective using theoretical calculations. RSC Adv. 2016, 6, 815–824. 10.1039/c5ra20552b. [DOI] [Google Scholar]
Associated Data
This section collects any data citations, data availability statements, or supplementary materials included in this article.


