

Abstract
3‐Chloroallyl alcohol (3‐CAA) can be found in the environment following the application of plant protection products. 3‐CAA is formed in groundwater following the injection of 1,3‐dichloropropene, a fumigant used to control nematodes. 3‐CAA is also formed, in leafy crops, as a glycoside conjugate following application of the herbicide, clethodim. Human exposure may occur from groundwater used as drinking water or through dietary consumption. To characterize 3‐CAA's potential to cause genotoxicity in mammals, in vitro and in vivo studies were conducted. 3‐CAA was negative in an Ames test and positive in a mouse lymphoma forward mutation assay. 3‐CAA was negative in an acute in vivo CD‐1 mouse bone marrow micronucleus assay when administered up to a dose level of 125 mg/kg/day for two consecutive days. In a combined gene mutation assay and erythrocyte micronucleus assay, using transgenic Big Blue® Fischer 344 rats, 3‐CAA was administered via drinking water at targeted dose levels of 0, 10, 30, and 100 mg/kg/day for 29 days. Peripheral blood samples, collected at the end of treatment, were analyzed for micronucleus induction in reticulocytes using flow cytometry. Liver and bone marrow samples, collected 2 days after the termination of the treatment, were analyzed for the induction of mutations at the cII locus. 3‐CAA did not induce an increase in mutant frequency or micronuclei under the experimental conditions. In conclusion, the mutagenic response observed in the in vitro mouse lymphoma assay is not confirmed in the whole animal. 3‐CAA is not considered to pose a mutagenic risk.
Keywords: Ames test, aneugenicity, Big Blue® rat, clastogenicity, mouse lymphoma assay, mutagenicity
1. INTRODUCTION
3‐Chloroallyl alcohol (3‐CAA; CAS No. 29560‐84‐7) is formed in groundwater following the injection of 1,3‐dichloropropene, a fumigant used to control nematodes. 3‐CAA is also formed in rodents following administration of 1,3‐dichloropropene via a minor hydrolytic metabolic pathway (Bartels et al., 2004). 3‐CAA occurs as a racemic mixture of cis‐ (Z) and trans‐ (E) isomers (Figure 1). Human exposure to 3‐CAA can occur from drinking polluted water and via dietary consumption of contaminated food products. 3‐CAA degrades rapidly in the environment under both aerobic and anaerobic conditions, with a half‐life of <0.5 days (McCall, 1987). Due to its short environmental half‐life, 3‐CAA has been sporadically detected and at very low levels in groundwater monitoring studies conducted in vulnerable aquifers in areas of high use of 1,3‐dichloropropene in both Europe and North America (van Wesenbeeck & Knowles, 2019). 3‐CAA is also formed as a plant metabolite in leafy crops as a glycoside following clethodim application.
FIGURE 1.

Structure of cis‐ (a) and trans‐ (b) 3‐chloroallyl alcohol
The acute oral toxicity of 3‐CAA is moderate, with the rat LD50 values in the range of 91–141 mg/kg (Stebbins & Brooks, 1999). The metabolic fate of 3‐CAA in the rat was investigated using a single oral gavage administration of radiolabeled 14C‐3‐CAA (Hansen & Bartels, 2000). Absorption of 3‐CAA following dose levels of either 5 or 65 mg/kg body weight was found to be high, with the administered 14C‐dose recovered in urine (21%), expired air (50%–52% as 14CO2), feces (13%), and tissues/carcass (5%–6%). In the 28‐day and 90‐day drinking water studies with rats, the primary target organ was identified as the liver, and the effects included hepatocellular hypertrophy, increased single hepatocyte necrosis, chronic inflammation in the periportal zones, increases in liver‐related clinical chemistry parameters, and relative liver weight increases. There was a small, equivocal effect on the kidneys. The small increase of this minor lesion was attributed to the increased metabolic demand on the kidneys for urine concentration because of a significantly decreased water intake, rather than a direct renotoxic effect (EU RAR 2018). 3‐CAA was not teratogenic when assessed by oral gavage in the rat (Carney & Liberacki, 1999).
As stated above, 3‐CAA is also an in vivo metabolite of the fumigant 1,3‐dichloropropene. 1,3‐dichloropropene has been extensively investigated in vitro and in vivo for its genotoxic potential (Gollapudi et al., 1998; Stott et al., 2001; Badding et al., 2020; Yan et al., 2020). In vitro, the soil fumigant yielded mixed results. Several of these studies were confounded by the use of a test material containing known genotoxic impurities or such impurities generated during the purification of the test substance. However, there are some studies showing positive genotoxicity in vitro, including in the Ames test. The in vivo genotoxicity of 1,3‐dichloropropene has been investigated in several studies, including DNA adduct analysis, rodent erythrocyte micronucleus test, dominant lethal assay, and the transgenic Big Blue® mouse and rat studies (Badding et al., 2020). The weight of evidence suggests that the soil fumigant does not pose a genotoxic hazard in vivo.
The purpose of the studies reported here is to investigate the in vitro and in vivo genotoxic potential of 3‐CAA. The in vitro test battery consisted of the Ames bacterial reverse mutation assay and the mouse lymphoma forward mutation assay. The in vivo battery included erythrocyte micronucleus tests in the mouse and the rat as well as an investigation for cII gene mutations in the liver and bone marrow tissues of the Big Blue® transgenic rat. All these studies were compliant to the OECD test guidelines in effect at the time of their conduct.
2. MATERIALS AND METHODS
The studies described below were conducted under Good Laboratory Practice standards and with approval from the Institutional Animal Care and Use Committee where animals were involved. The nominal concentrations of 3‐CAA in stock dosing solutions used for all the experiments described below were confirmed by analytical methods.
Test substance: 3‐CAA was obtained from Dow AgroSciences, Indianapolis (IN) with a purity of 98.6% (ratio E/Z isomers = 1.26/1) for the Ames, mouse lymphoma, and mouse bone marrow micronucleus tests or 96% (ratio of E/Z isomers: 1.05/1) for the in vivo transgenic mutation and micronucleus assay in rats.
2.1. Bacterial reverse mutation test
The mutagenic potential of 3‐CAA was assayed in Salmonella and Escherichia coli (Ames et al., 1975; OECD 471, 1983) in the presence and absence of an exogenous metabolic activation system (Aroclor‐1254 induced male Sprague–Dawley rat liver S9 fraction). The assay was conducted using pre‐incubation methodology with tester strains of Salmonella typhimurium TA98, TA100, TA1535, TA1537, and E. coli WP2uvrA. For assays with metabolic activation, 0.5 ml of S9 mix was added to 0.1 ml of appropriate tester strain and 0.05 ml of vehicle (ethanol, Sigma, CAS No. 64‐17‐5) or 3‐CAA. For assays without metabolic activation, 0.5 ml of 0.1 M phosphate buffer was substituted for the S9 mix. Ethanol was used as the vehicle to prepare stock solutions of 3‐CAA. The stock solutions containing the test material were analyzed by HPLC/UV. The analytically determined concentrations ranged from 88% to 110% of the target. The mixture was incubated for 20 min at 37°C. Two milliliter (2 ml) of molten selective top agar was added to each tube and the mixture was overlaid onto the surface of minimal agar plates. The plates were incubated for 48–56 h at 37°C. Positive controls were plated using a 0.05 ml plating volume. The following positive controls were used in the study for the respective strains and conditions: TA98 with S9 (benzo(a)pyrene; Sigma, CAS No. 50‐32‐8), TA98 without S9 (2‐nitrofluorene; Sigma, CAS No. 607‐57‐8), TA100 with S9 (2‐aminoanthracene; Sigma, CAS No. 613‐13‐8), TA100 without S9 (sodium azide; Sigma, CAS No. 26628‐22‐8), TA1535 with S9 (2‐aminoanthracene), TA1535 without S9 (sodium azide), TA1537 with S9 (2‐aminoanthracene), TA1537 without S9 (ICR‐191; Sigma, CAS No.1707‐45‐0), WP2uvrA with S9 (2‐aminoanthracene), WP2uvrA without S9 (4‐nitroquinoline‐N‐oxide; Sigma, CAS No. 56‐57‐5).
The condition of the bacterial background lawn was evaluated for evidence of cytotoxicity and test article precipitation. For a test article to be considered positive, it had to produce at least a 3‐fold (TA98, TA1535, TA1537, and WP2uvrA) or 2‐fold (TA100) dose‐related and reproducible increase in the mean revertant counts per plate of at least one tester strain over the mean revertant counts per plate of the appropriate vehicle control.
2.2. Mouse lymphoma forward mutation assay
The potential of 3‐CAA to induce gene mutations at the thymidine kinase locus was investigated in cultured mouse lymphoma cells (L5178Y Tk+/− 3.7.2) with and without S9 activation [Aroclor‐1254 induced male Sprague–Dawley rat liver S9 (OECD 476, 1997)]. The cells were routinely maintained in Fischer's medium (F10P) containing 204 mg/ml L‐glutamine (GIBCO, Grand Island, NY), 10% (v/v) heat‐inactivated (56°C, 30 min) horse serum (Hyclone Laboratories, Inc., Logan, UT), antibiotics (penicillin G, 20 units/ml; streptomycin sulfate, 20 μg/ml, GIBCO), 0.22 mg/ml sodium pyruvate (Sigma St. Louis, MO), and 10 mg/ml Plurionic F68 (GIBCO). F0P, the above medium without serum, was used during treatment. The cloning medium consisted of F10P containing 0.28% granulated agar (BBL, Becton Dickinson and Company, Cockeysville, MD) to achieve a semi‐solid state. The selection medium for the detection of Tk +/− mutants consisted of the cloning medium supplemented with 1 μg/ml trifluorothymidine (TFT, Sigma, CAS No. 70‐00‐8). The conditioned medium consisted of F10P from which cells had been removed. This medium was used during treatments.
3‐CAA was first dissolved in dimethyl sulfoxide (DMSO, Sigma, CAS No. 67‐68‐5) and further diluted in the treatment medium to obtain the desired final concentrations. The stock solutions containing the test material were analyzed by HPLC/UV and the analytically determined concentrations ranged from 98% to 103% of the target. DMSO was also used as the negative control treatment. Methyl methanesulfonate (MMS, Sigma, CAS No. 66–27‐3) dissolved in phosphate‐buffered saline was used at concentrations of 10 and 15 μg/ml as the positive control without S9 activation, while 20‐methylcholanthrene (20‐MCA, Sigma, CAS No. 56‐49‐5) dissolved in DMSO was used at concentrations of 2.5, 5.0 and 7.5 μg/ml in the presence of S9 activation.
Cells from logarithmically growing stock cultures were treated in individual 50 ml culture tubes. Each tube consisted of 6 ml of a cell suspension containing 1 × 10⁶ cells/ml in a 1:1 mix of F0P and conditioned medium. To treat the cells, 4 ml of either S9 activation (see below) or F0P was added along with the test material. The treatment consisted of duplicate cultures per concentration level, except for positive controls, where only one replicate was used. Following the addition of the test compounds, the tubes were incubated for approximately 4 h at 37°C in a roller drum. At the end of the incubation period, the cells were pelleted, rinsed with F0P, and resuspended in 20 ml F10P. The tubes were returned to the roller drum and maintained at 37°C during a standard expression period of 2 days.
S9 liver homogenate was reconstituted at a final concentration of 5% (v/v) in a co‐factor “mix.” The mix consisted of 2.0 mg/ml NADP and 11.25 mg/ml sodium isocitrate. The reconstituted mix was added to the culture medium to obtain the desired final concentration of S9 in the culture, that is, 2% v/v.
Each test concentration level was set up in duplicate from the time of treatment until the completion of the assay. At 24 h following treatment (Day 1), the test cultures were counted and diluted to a density of approximately 3 × 10⁵ cells/ml with fresh F10P. If the treated cells failed to multiply to a density of 4 × 10⁵ cells/ml on the first day following treatment, the culture was returned to the incubator without any dilution. On Day 2, cultures were again counted and treatment levels with desired levels of toxicity were selected for cloning. A total sample size of 3 × 10⁶ cells from each culture was suspended in cloning medium with trifluorothymidine (TFT) and plated into three Petri dishes (100 mm), allowed to gel for approximately 15 min at 0–6°C, and returned to the incubator for approximately 12 days to allow for mutant colony formation. The cloning efficiency (CE) was determined by serially diluting the sample in a cloning medium without TFT and then plating the cells into three Petri dishes (100 mm) at a density of approximately 200 cells per dish. The dishes were returned to the incubator for 12 days before counting the number of colonies per dish.
An image analyzer (LAI High‐Resolution Colony Counting System, Loats Associates, Inc., Westminster, MD) was used to count and size colonies. Colonies that were equal or greater than 0.55 mm were classified as large colonies, while those smaller than this were classified as small colonies.
The relative total growth (RTG) parameter was used to determine cytotoxicity of various treatments. Calculations of the RTG are described below:
% RTG = Day 2 RSG × relative cloning efficiency (RCE) × 100.
Day 2 RSG = relative suspension growth over the first 2 days.
RCE = cloning efficiency of the test culture at the time of mutant selection/Average cloning efficiency of the control at the time of mutant selection.
CE = average no. of colonies in the TFT‐free plates/no. of cells seeded per plate.
The mutant frequency (MF) per 106 clonable cells = average no. of mutants per TFT plate/CE.
Mutant index = MF of the treated/average MF of the control.
The following strategy was used to assess the statistical and biological significance of the results. The frequency of mutants per 106 clonable cells was statistically evaluated using a weighted analysis of variance (Hsie et al., 1980). Weights were derived from the inverse of the MF variance. The actual plate counts were assumed to follow a Poisson distribution; therefore, the mean plate count was used as an estimate of variance (Kirkland, 1989). A linear trend test and lack of fit test is employed (alpha = 0.05) as omnibus tests to compare treated groups to the negative control. If there is a significant increasing trend or a significant lack of fit, then a Dunnett's t‐test is conducted (Winer, 1971), comparing each treated group and the positive control to the negative control (alpha = 0.05, one‐sided). The lack of fit test is an indicator that further analysis needs to be performed (i.e., Dunnett's test). An additional comparison of the positive control to the negative control (alpha = 0.05) was conducted using a linear contrast statement. The test chemical is considered positive when the conditions below are satisfied: (a) there is a statistically significant, dose‐related, reproducible increase in MF with a range of dose levels yielding >20% RTG. (b) The MF in at least one dose level of the treated cultures (resulting in >20% RTG) is 100 × 10−6 above concurrent solvent controls (assuming these to be in the range of 20–80 × 10−6).
2.3. Mouse bone marrow micronucleus test
The clastogenic/aneugenic potential of 3‐CAA in bone marrow cells was investigated in accordance with OECD 474 (1997). Groups of mice (5/sex/dose) were treated with either the vehicle used to mix the test material (distilled water) or the test material (three dose levels, 31.25, 62.5, and 125 mg/kg/day) by oral gavage in aliquots of 10 ml/kg on two consecutive days. An additional group of five animals/sex was treated at the highest dose level (125 mg/kg/day) to ensure the availability of an adequate number of animals in the event of unexpected mortalities. All treated animals were sacrificed 24 h after the second dose for the collection of bone marrow samples. All animals were observed at least daily for signs of toxicity. The analytical determined concentrations of 3‐CAA in dosing formulations ranged from 106% to 110% of the nominal concentrations.
Cyclophosphamide monohydrate (CP) dissolved in distilled water and dosed by oral gavage (120 mg/kg) 24 h prior to sacrifice served as the positive control. The animals were euthanized, and bone marrow samples were obtained from both femurs into 1 ml of fetal bovine serum. The tubes were centrifuged at 80g for 5 min in a table‐top centrifuge, and wedge smears were prepared on microscope slides using small portions of the cell suspension. The prepared slides were allowed to air dry and stained with Wright‐Giemsa using an automatic slide stainer.
Two thousand polychromatic erythrocytes (PCE) were examined from each animal from coded slides, and the number of micronucleated (MN) PCE was recorded. Micronuclei were identified as darkly stained bodies with smooth contours and varying shapes such as round, almond, or ring (Schmid, 1976). The proportion of PCEs among bone marrow erythrocytes was determined by examining 200 erythrocytes and expressed as PCE × 100/total erythrocytes.
The raw data on the counts of MN‐PCE for each animal were first transformed by adding 1 to each count and then taking the natural log of the adjusted number. The transformed MN‐PCE data and the data on percentage PCE were analyzed separately by a three‐way analysis of variance (sex, dose, and time) assuming the three‐way interaction was zero (Winer, 1971). From these initial analyses, the two‐way interactions were reviewed for significance. Depending on these reviews, the data were analyzed by one‐, two‐, or three‐way analysis of variance by looking at the main effects only. Pairwise comparisons of treated versus control groups were done, if necessary, by Dunnett's t‐tests, one‐sided (upper) for MN‐PCE and two‐sided for percent PCE (Winer, 1971). Linear dose‐related trend tests were performed if any of the pairwise comparisons yielded significant differences. The alpha level at which all the tests were conducted was 0.01. The final interpretation of the biological significance of the responses was based on both statistical outcome and scientific judgment.
2.4. Combined gene mutation and micronucleus assay in transgenic Big Blue® rats
The effect of 3‐CAA in drinking water on MF at the cII gene in liver and bone marrow from male transgenic Fischer 344 Big Blue® rats, and the induction of micronuclei was investigated in a Big Blue® Assay transgenic rodent mutation assay in accordance with OECD Test Guideline 488 (2020). The micronucleus assay was conducted in accordance with OECD Test Guideline 474 (2016). Fischer 344 homozygous Big Blue® transgenic male rats (F344‐TgN (lambda/lacI)) were obtained from Taconic Biosciences, Germantown, NY. At the time of dosing initiation (Day 1), the animals were 8–9 weeks of age.
Animals were administered 3‐CAA by drinking water at a targeted dose of 0, 10, 30, and 100 mg/kg/day for 29 consecutive days. The drinking water route was chosen because it represents a possible route of human exposure to the test substance. Dose level selection was based on a previously conducted 28‐day drinking water study in Fischer 344 rats (EU RAR, 2018). In that study, treatment‐related effects that were not considered to be adaptive were increased liver weights, a periportal pattern of hepatocyte hypertrophy, and individual hepatocyte necrosis in males of the 30 and 100 mg/kg/day dose groups. The drinking water dosing formulations containing 3‐CAA were determined to be stable when stored for up to 6 days at 2–8°C followed by 7 days at 20.5–24.0°C in an animal room. The analytically (UHPLC/UV) determined concentrations of 3‐CAA in the drinking water of the test groups varied from 94% to 103% of the target values. CP was used as the positive control for the micronucleus portion of the study and was administered by oral gavage at a dose level of 13 mg/kg/day to six male rats. CP formulations were administered on Days 1, 2, 26, and 27 at a dose volume of 10 ml/kg. The DNA isolated from previously dosed positive control animals [F344 transgenic male rats] exposed to N‐ethyl‐N‐nitrosourea by oral gavage, at 20 mg/kg/day for 6 non‐consecutive days was used as a packaging positive control for the transgenic mutation portion of the study.
On Day 29, peripheral blood was collected for flow‐cytometric analysis of micronuclei in erythrocytes using the Micro‐Flow kit from Litron Laboratories (Rochester, NY). Flow cytometer parameters were set to score 10,000 RETs per animal, when possible, for the incidence MN and %RET. A parametric one‐way analysis of variance (ANOVA) was performed followed by Dunnett's post‐hoc analysis to compare each dose group to the concurrent vehicle control. A linear regression analysis was conducted to assess dose responsiveness in the test substance treated groups (p ≤ .01 and R 2 ≥ 70%). A pair‐wise comparison (Student's t‐test; p ≤ .05) was used to compare the positive control group to the concurrent vehicle control group.
Two days after the exposure, the animals were sacrificed for the collection of liver and bone marrow. The samples were flash frozen in liquid nitrogen. Liver was selected because it was the target tissue in the 28‐day study used to select dose levels, while bone marrow was selected to represent a rapidly proliferating tissue. Water consumption was measured on study Day 1, 4, 7, 11, 14, 15, 18, 21, 23, 25, and 30. Body weights were recorded on days 2–7, Day 8, 15, 22, 29, and prior to sacrifice on Day 31. Genomic DNA was isolated using the Recover‐Ease isolation kit from Agilent (Santa Clara, CA). Isolated DNA was processed using Packaging Reaction Mix (PRM), purchased from New York University, New York, NY. Packaging, plating, and scoring of cII mutants from coded plates following the Agilent Instruction Manuals. The MF was calculated (number of mutant phage/numbers of total phage screened) for each tissue analyzed from each animal. The log10 transformed MF data was analyzed by a parametric one‐way ANOVA followed by Dunnett's test. The significance level for all the comparisons was p ≤ 0.05.
3. RESULTS
3.1. Bacterial reverse mutation assay
3‐CAA is cytotoxic to Salmonella tester strains at ≥3330 μg/plate as evidenced by decreased background lawn. No mutagenic response was observed in any tester strain either with or without metabolic activation in two independent experiments (Table 1). The revertant counts observed in the negative and positive control plates confirmed the adequacy of the experimental conditions to detect a mutagenic response.
TABLE 1.
Results of the bacterial reverse mutation assay with 3‐CAA
| Concentration (μg/plate) | Mean revertants per plate (Exp. 1/Exp. 2) with metabolic activation | ||||
|---|---|---|---|---|---|
| TA98 | TA100 | TA1535 | TA1537 | Escherichia coli WP2uvrA | |
| 0 | 39/40 | 211/95 | 15/12 | 8/9 | 13/17 |
| 33.3 | 36/43 | 184/100 | 16/17 | 7/6 | 15/19 |
| 100 | 39/43 | 197/92 | 16/19 | 8/7 | 14/14 |
| 333 | 51/48 | 190/110 | 23/20 | 8/10 | 15/13 |
| 1000 | 63/58 | 169/99 | 26/27 | 8/9 | 16/13 |
| 3330 | 9/26 | 47/46 | 19/20 | 1/3 | 10/14 |
| 5000 | 1/0 | 1/3 | 4/4 | 0/1 | 16/14 |
| Positive control+ | 571/543 | 791/700 | 87/79 | 122/104 | 212/212 |
| Concentration (μg/plate) | Mean revertants per plate (Exp. 1/Exp. 2) without metabolic activation | ||||
|---|---|---|---|---|---|
| TA98 | TA100 | TA1535 | TA1537 | Escherichia coli WP2uvrA | |
| 0 | 21/26 | 176/93 | 14/12 | 5/7 | 9/20 |
| 33.3 | 18/28 | 162/108 | 12/10 | 4/5 | 15/15 |
| 100 | 26/30 | 180/90 | 14/14 | 7/5 | 11/20 |
| 333 | 47/30 | 185/102 | 13/16 | 8/4 | 11/21 |
| 1000 | 22/37 | 148/94 | 13/20 | 8/9 | 17/16 |
| 3330 | 33/41 | 114/120 | 19/22 | 6/4 | 11/9 |
| 5000 | 0/0 | 0/51 | 0/8 | 4/0 | 3/0 |
| Positive control+ | 221/240 | 869/695 | 686/654 | 1946/2045 | 670/720 |
Note: Positive controls (+): TA98 with S9—benzo(a)pyrene, TA98 without S9—2‐nitrofluorene, TA100 with S9—2‐aminoanthracene, TA100 without S9—sodium azide, TA1535 with S9—2‐aminoanthracene, TA1535 without S9—sodium azide, TA1537 with S9—2‐aminoanthracene, TA1537 without S9—ICR‐191, and WP2uvrA with S9—2‐aminoanthracene, WP2uvrA without S9—4‐nitroquinoline‐N‐oxide.
3.2. Mouse lymphoma forward mutation assay
In a preliminary toxicity assay (data not shown), 3‐CAA was evaluated at concentrations of 3.6–925.2 μg/ml. The highest concentration tested represented the limit concentration of 10 mM. The test substance was excessively toxic at 925.2 μg/ml in the absence of S9, resulting in RSG of 1.7%. In cultures treated in the presence of S9, however, excessive toxicity was noted at concentrations of 115.7 μg/ml and above. Based up the results of the preliminary toxicity assay, concentrations in the range of 12.5–925 μg/ml and 1.5–100 μg/ml were selected for the first gene mutation assay without and with S9, respectively.
In the mutation assay without S9, there was excessive toxicity at the top two concentrations (700 and 925 μg/ml) as measured by Day 2 RSG (4% and 1% RSG, respectively), and hence, these treatment levels were not selected for cloning. Statistical analysis of mutant frequencies in 3‐CAA treated cultures indicated no significant difference from the negative control in pair‐wise comparisons. There was a 2.3‐fold increase in MF in cultures treated with 500 μg/ml; however, the RTG at this concentration (i.e., 11%) was at the upper limit of acceptability and there was little cytotoxicity at the next lower concentration of 250 μg/ml. In an independent assay, 3‐CAA was evaluated at concentrations ranging from 12.5 to 500 μg/ml without S9. Cultures treated with the two lower concentrations (12.5 and 25 μg/ml with Day 2 RSG ≥ 95%) were considered superfluous for assessing mutagenic activity and hence were not selected for cloning. Statistically significant increases in mutant frequencies were observed at the top two concentrations of 400 and 500 μg/ml; both small and large colony mutants increased to similar levels.
In the presence of S9, RTG values in the test substance treated cultures ranged from 106% at the lowest concentration (1.5 μg/ml) to 12% at the highest (100 μg/ml). Although statistical analysis did not identify significant differences between the negative control and any of the 3‐CAA treatment levels, there was a clear, statistically significant dose‐related trend. The largest increase in mutant frequency (i.e., 2.8‐fold) occurred at a treatment level that induced 12% RTG. In the confirmatory trial (Assay 2, Tables 2, 3, 4, 5), the statistical analysis identified significant increases (up to 3‐fold) in mutant frequencies in cultures treated with the top two concentrations of 3‐CAA. These increases occurred at concentrations that induced relatively high levels of toxicity, that is, ≤ 20% RTG, with both small and large colony mutants increasing to similar levels.
TABLE 2.
Summary of results following treatment of mouse lymphoma cells with 3‐CAA in the absence of activation (assay 1)
| Concentration (μg/ml) | Cum. RSG (%)* | Plating efficiency | RTG (% survival) | Mutant frequency (× 10−6) | Mutant index | ||||||
|---|---|---|---|---|---|---|---|---|---|---|---|
| Day 1 | Day 2 | Abs % | Rel % | Total | Small | Large | Total | Small | Large | ||
| 0** | 90 | 81 | 100 | 100 | 81 | 115 | 38 | 77 | 1.10 | 1.02 | 1.14 |
| 0** | 110 | 119 | 100 | 100 | 118 | 94 | 37 | 57 | 0.90 | 0.98 | 0.86 |
| 12.5 | 174 | 172 | 92 | 92 | 158 | 96 | 30 | 66 | 0.92 | 0.79 | 0.99 |
| 12.5 | 155 | 111 | 92 | 92 | 103 | 125 | 43 | 82 | 1.20 | 1.15 | 1.22 |
| 25 | 143 | 145 | 69 | 70 | 101 | 144 | 48 | 96 | 1.38 | 1.29 | 1.43 |
| 25 | 110 | 119 | 74 | 74 | 88 | 160 | 66 | 94 | 1.52 | 1.74 | 1.40 |
| 50 | 118 | 144 | 57 | 57 | 82 | 159 | 62 | 97 | 1.52 | 1.65 | 1.45 |
| 50 | 127 | 133 | 81 | 81 | 108 | 127 | 53 | 74 | 1.21 | 1.40 | 1.11 |
| 100 | 134 | 134 | 132 | 132 | 177 | 73 | 25 | 48 | 0.70 | 0.68 | 0.72 |
| 100 | 129 | 97 | 115 | 115 | 112 | 127 | 49 | 78 | 1.21 | 1.31 | 1.16 |
| 250 | 80 | 75 | 84 | 84 | 63 | 130 | 61 | 69 | 1.24 | 1.61 | 1.04 |
| 250 | 110 | 84 | 135 | 135 | 114 | 95 | 42 | 53 | 0.91 | 1.12 | 0.79 |
| 500 | 28 | 19 | 56 | 57 | 11 | 215 | 110 | 105 | 2.06 | 2.93 | 1.57 |
| 500 | 19 | 18 | 59 | 59 | 11 | 241 | 130 | 111 | 2.30 | 3.46 | 1.65 |
| 700 | 13 | 4 | – a | – | – | – | – | – | – | – | – |
| 700 | 10 | 4 | – a | – | – | – | – | – | – | – | – |
| 925 | 6 | 1 | – a | – | – | – | – | – | – | – | – |
| 925 | 3 | 1 | – a | – | – | – | – | – | – | – | – |
| 10*** | 96 | 106 | 41 | 41 | 43 | 711 | 431 | 280 | 6.79 | 11.47 | 4.17 |
| 15*** | 80 | 80 | 37 | 37 | 30 | 784 | 472 | 311 | 7.49 | 12.58 | 4.64 |
Abbreviations: RSG, relative suspension growth; RTG, relative total growth.
Not plated due to excessive toxicity.
Absolute cumulative suspension growth of 0 μg/ml replicate 1 = 18 and replicate = 26.
Solvent control (1% dimethyl sulfoxide).
Positive control methyl methanesulfonate.
TABLE 3.
Summary of results following treatment of mouse lymphoma cells with 3‐CAA in the absence of activation (assay 2)
| Concentration (μg/ml) | Cum. RSG (%)* | Plating efficiency | RTG (% survival) | Mutant frequency (×10−6) | Mutant index | ||||||
|---|---|---|---|---|---|---|---|---|---|---|---|
| Day 1 | Day 2 | Abs % | Rel % | Total | Small | Large | Total | Small | Large | ||
| 0** | 93 | 71 | 100 | 116 | 83 | 104 | 52 | 52 | 1.04 | 1.01 | 1.08 |
| 0** | 107 | 129 | 72 | 84 | 108 | 95 | 50 | 45 | 0.96 | 0.99 | 0.92 |
| 12.5 | 142 | 123 | – a | – | – | – | – | – | – | – | – |
| 12.5 | 131 | 95 | – a | – | – | – | – | – | – | – | – |
| 25 | 116 | 124 | – a | – | – | – | – | – | – | – | – |
| 25 | 113 | 126 | – a | – | – | – | – | – | – | – | – |
| 50 | 100 | 113 | 81 | 94 | 106 | 104 | 53 | 52 | 1.05 | 1.03 | 1.07 |
| 50 | 89 | 114 | 67 | 77 | 88 | 99 | 49 | 50 | 0.99 | 0.95 | 1.04 |
| 100 | 95 | 98 | 73 | 85 | 83 | 116 | 47 | 69 | 1.17 | 0.92 | 1.43 |
| 100 | 93 | 90 | 88 | 102 | 91 | 84 | 38 | 45 | 0.84 | 0.75 | 0.94 |
| 200 | 91 | 100 | 65 | 76 | 76 | 136 | 57 | 79 | 1.37 | 1.12 | 1.64 |
| 200 | 78 | 98 | 68 | 79 | 77 | 124 | 47 | 77 | 1.25 | 0.92 | 1.60 |
| 300 | 80 | 53 | 103 | 120 | 64 | 136 | 47 | 89 | 1.36 | 0.92 | 1.84 |
| 300 | 71 | 78 | 69 | 80 | 63 | 150 | 75 | 75 | 1.51 | 1.46 | 1.56 |
| 400 | 44 | 42 | 73 | 85 | 36 | 169 b | 80 | 89 | 1.70 | 1.56 | 1.85 |
| 400 | 64 | 61 | 73 | 85 | 51 | 166 b | 73 | 92 | 1.67 | 1.43 | 1.92 |
| 500 | 41 | 36 | 67 | 78 | 28 | 212 b | 118 | 94 | 2.13 | 2.30 | 1.96 |
| 500 | 47 | 37 | 75 | 87 | 32 | 204 b | 96 | 108 | 2.05 | 1.87 | 2.24 |
| 10*** | 84 | 95 | 57 | 66 | 63 | 431 b | 247 | 183 | 4.33 | 4.84 | 3.80 |
| 15*** | 82 | 102 | 37 | 43 | 44 | 612 b | 347 | 265 | 6.16 | 6.79 | 5.50 |
Abbreviations: RSG, relative suspension growth; RTG, relative total growth.
Not plated as they were considered to be superfluous.
Significantly higher than the concurrent negative control (alpha <0.05).
Absolute cumulative suspension growth of 0 μg/ml replicate 1 = 14 and replicate = 25.
Solvent control (1% dimethyl sulfoxide).
Positive control methyl methanesulfonate.
TABLE 4.
Summary of results following treatment of mouse lymphoma cells with 3‐CAA in the presence of activation (assay 1)
| Concentration (μg/ml) | Cum. RSG (%)* | Plating efficiency | RTG (% survival) | Mutant frequency (×10−6) | Mutant index | ||||||
|---|---|---|---|---|---|---|---|---|---|---|---|
| Day 1 | Day 2 | Abs % | Rel % | Total | Small | Large | Total | Small | Large | ||
| 0** | 93 | 102 | 66 | 103 | 105 | 117 | 23 | 95 | 0.90 | 0.77 | 0.94 |
| 0** | 107 | 98 | 63 | 97 | 95 | 144 | 36 | 107 | 1.10 | 1.23 | 1.06 |
| 1.5 | 97 | 90 | 74 | 114 | 103 | 130 | 38 | 92 | 1.00 | 1.29 | 0.91 |
| 1.5 | 133 | 84 | 81 | 126 | 106 | 165 | 44 | 121 | 1.26 | 1.47 | 1.20 |
| 3 | 91 | 83 | 70 | 108 | 90 | 163 | 47 | 117 | 1.25 | 1.58 | 1.16 |
| 3 | 69 | 65 | 74 | 115 | 75 | 121 | 34 | 87 | 0.93 | 1.14 | 0.86 |
| 6.1 | 87 | 84 | 63 | 97 | 82 | 137 | 42 | 95 | 1.05 | 1.42 | 0.94 |
| 6.1 | 87 | 69 | 70 | 108 | 75 | 132 | 38 | 95 | 1.01 | 1.28 | 0.94 |
| 12.5 | 93 | 57 | 77 | 119 | 68 | 172 | 52 | 121 | 1.32 | 1.75 | 1.20 |
| 12.5 | 95 | 69 | 70 | 109 | 75 | 156 | 45 | 111 | 1.19 | 1.53 | 1.10 |
| 25 | 79 | 59 | 74 | 114 | 68 | 186 | 662 | 125 | 1.43 | 2.08 | 1.24 |
| 25 | 55 | 50 | 76 | 118 | 59 | 191 | 64 | 127 | 1.46 | 2.16 | 1.26 |
| 37.5 | 46 | 39 | 73 | 114 | 45 | 202 | 70 | 132 | 1.55 | 2.37 | 1.31 |
| 37.5 | 63 | 44 | 72 | 112 | 50 | 239 | 86 | 153 | 1.83 | 2.92 | 1.551 |
| 50 | 36 | 24 | 71 | 109 | 26 | 274 | 118 | 156 | 2.10 | 4.00 | 1.55 |
| 50 | 38 | 23 | 81 | 126 | 29 | 219 | 93 | 126 | 1.68 | 3.15 | 1.25 |
| 100 | 26 | 14 | 56 | 86 | 12 | 362 | 172 | 190 | 2.78 | 5.82 | 1.89 |
| 100 | 14 | 16 | 47 | 72 | 12 | 368 | 149 | 219 | 2.82 | 5.04 | 2.17 |
| 5*** | 38 | 9 | 22 | 34 | 3 | 1402 a | 798 | 603 | 10.74 | 27.00 | 5.98 |
| 7.5*** | 26 | 9 | 12 | 19 | 2 | 1379 a | 800 | 579 | 10.57 | 27.06 | 5.74 |
Abbreviations: RSG , relative suspension growth; RTG, relative total growth.
Significantly higher than the concurrent negative control (alpha <0.05).
Absolute cumulative suspension growth of 0 μg/ml replicate 1 = 23 and replicate = 22.
Solvent control (1% dimethyl sulfoxide).
Positive Control 3‐MCA.
TABLE 5.
Summary of results following treatment of mouse lymphoma cells with 3‐CAA in the presence of activation (assay 2)
| Concentration (μg/ml) | Cum. RSG (%)* | Plating efficiency | RTG (% survival) | Mutant frequency (×10−6) | Mutant index | ||||||
|---|---|---|---|---|---|---|---|---|---|---|---|
| Day 1 | Day 2 | Abs % | Rel % | Total | Small | Large | Total | Small | Large | ||
| 0** | 97 | 95 | 93 | 104 | 99 | 134 | 58 | 76 | 1.00 | 0.87 | 1.12 |
| 0** | 103 | 105 | 86 | 96 | 100 | 135 | 75 | 60 | 1.00 | 1.13 | 0.88 |
| 3 | 78 | 122 | – a | – | – | – | – | – | – | – | – |
| 3 | 91 | 112 | – a | – | – | – | – | – | – | – | – |
| 6.25 | 85 | 87 | 102 | 114 | 99 | 113 | 49 | 64 | 0.84 | 0.74 | 0.95 |
| 6.25 | 77 | 109 | 83 | 93 | 101 | 139 | 67 | 71 | 1.03 | 1.01 | 1.05 |
| 12.5 | 71 | 52 | 121 | 136 | 70 | 134 | 58 | 76 | 1.00 | 0.87 | 1.12 |
| 12.5 | 69 | 87 | 87 | 97 | 84 | 129 | 68 | 61 | 0.96 | 1.01 | 0.91 |
| 25 | 43 | 66 | 82 | 91 | 60 | 158 | 69 | 89 | 1.18 | 1.03 | 1.32 |
| 25 | 33 | 69 | 84 | 94 | 65 | 163 | 83 | 80 | 1.21 | 1.24 | 1.18 |
| 37.5 | 35 | 59 | 89 | 100 | 59 | 159 | 83 | 76 | 1.18 | 1.25 | 1.12 |
| 37.5 | 47 | 48 | 77 | 86 | 41 | 193 | 104 | 89 | 1.43 | 1.55 | 1.32 |
| 50 | 30 | 35 | 105 | 117 | 41 | 203 | 95 | 111 | 1.51 | 1.38 | 1.64 |
| 50 | 40 | 31 | 87 | 97 | 30 | 222 | 103 | 119 | 1.65 | 1.54 | 1.76 |
| 75 | 14 | 16 | 98 | 109 | 17 | 264 b | 114 | 150 | 1.96 | 1.70 | 2.22 |
| 75 | 18 | 21 | 85 | 95 | 20 | 286 b | 123 | 163 | 2.13 | 1.84 | 2.41 |
| 100 | 12 | 7 | 145 | 162 | 12 | 376 b | 210 | 167 | 2.80 | 3.14 | 2.46 |
| 100 | 5 | 6 | 108 | 120 | 7 | 406 b | 193 | 213 | 3.02 | 2.89 | 3.15 |
| 2.5*** | 67 | 61 | 56 | 63 | 39 | 739 b | 414 | 325 | 5.49 | 6.21 | 4.79 |
| 5*** | 46 | 20 | 34 | 38 | 8 | 936 b | 585 | 350 | 6.69 | 8.77 | 5.17 |
Abbreviations: RSG, relative suspension growth; RTG, relative total growth.
Significantly higher than the concurrent negative control (alpha <0.05).
Not plated as they were considered superfluous.
Absolute cumulative suspension growth of 0 μg/ml replicate 1 = 6 and replicate = 7.
Solvent control (1% dimethyl sulfoxide).
Positive Control 3‐MCA.
Although this study pre‐dated the International Workshop on Genotoxicity Testing (IWGT) evaluation criteria (OECD 490, 2016), the conclusion that 3‐CAA was mutagenic in this assay, both with and without S9, does not change even after application of the IWGT criteria.
3.3. Mouse bone marrow micronucleus test
In a dose‐range finding study, (4/sex/dose) all but one CD‐1 mouse receiving ≥250 mg/kg 3‐CAA died within 2 days of the first dose; there was one death at 125 mg/kg/day on Day 3 and no deaths at 62.5 and 31.25 mg/kg/day. Based on these results, dose levels of 125, 62.5, and 31.25 mg/kg/day were selected for the micronucleus test. A summary of the data on the frequencies of MN‐PCE and %PCE of various treatment groups is given in Table 6. All treated animals survived until the time of scheduled necropsy, and there were no remarkable clinical observations during the in‐life phase. There were no significant differences in MN‐PCE frequencies and % PCE values between the groups treated with 3‐CAA and the negative controls. The adequacy of the experimental conditions for the detection of induced micronuclei was ascertained from the observation of a significant increase in MN‐PCE in the positive control groups.
TABLE 6.
Frequencies (mean ± SD) of micronucleated (MN) polychromatic erythrocytes (PCEs) in the mouse bone marrow following oral gavage administration of 3‐CAA
| Dose (mg/kg b.w.) | Males | Females | ||||
|---|---|---|---|---|---|---|
| No. mice | MN/1000 PCE | %PCE a | No. mice | MN/1000PCE | %PCE | |
| 0 | 5 | 0.9 ± 0.4 | 57.3 ± 10.5 | 5 | 0.6 ± 0.7 | 58.0 ± 4.4 |
| 31.25 | 5 | 1.2 ± 1.2 | 53.2 ± 13.6 | 5 | 1.8 ± 0.4 | 60.5 ± 11.8 |
| 62.5 | 5 | 1.7 ± 1.3 | 56.5 ± 6.2 | 5 | 0.6 ± 0.5 | 61.5 ± 5.9 |
| 125 | 10 | 1.0 ± 0.7 | 49.2 ± 6.1 | 10 | 0.5 ± 0.5 | 58.3 ± 9.2 |
| 120CP | 5 | 49.1 ± 14.1 | 42.0 ± 10.7 | 5 | 50.7 ± 16.7 | 57.4 ± 8.6 |
Abbreviation: CP, cyclophosphamide.
(PCE/PCE + NCE) × 100; values are means ± SD.
3.4. Combined assay for gene mutations and micronuclei in Big Blue® rats
No mortalities were observed following treatment with 3‐CAA in drinking water. Overall, mean body weight gain was significantly lower at the high dose level compared to the vehicle control group during the exposure period; the animals started gaining weights following cessation of the treatment (Figure 2). Over the course of the study, total water consumption decreased in each of the test substance dose groups (Figure 3). The concentration of 3‐CAA in drinking water was periodically adjusted to compensate for the decreased water consumption, achieving 9.5, 28.9, and 83.9 mg/kg/day versus the targeted nominal dose levels of 10, 30, and 100 mg/kg/day over the course of the study. There was approximately a 5% increase in relative liver weight at the highest administered dose (data not shown); however, since the animals were sacrificed after a recovery period of 2 days following the final day of dosing, this increase is likely an underestimation of the actual effect.
FIGURE 2.

Body weight summary of Big Blue® rats administered 3‐chloroallyl alcohol in drinking water under the nominal concentration of 0, 10, 30, and 100 mg/kg/day
FIGURE 3.
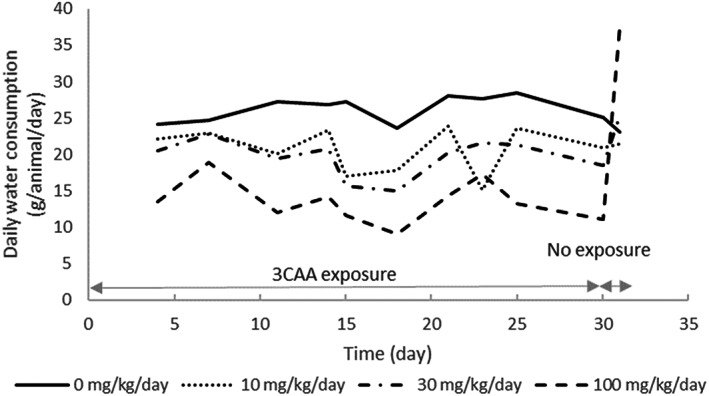
Water consumption (g/animal/day) of Big Blue® rats administered 3‐chloroallyl alcohol in drinking water under the nominal concentration of 0, 10, 30, and 100 mg/kg/day.
There was no statistically significant increase in the incidence of MN‐RET/1000 RET in the test substance groups relative to the vehicle control group (vehicle control group: 0.6 vs. 0.5–0.8 in 3‐CAA administered groups; Table 7). Furthermore, there was no remarkable effect of 3‐CAA treatment on the %RET values. The positive control group, on the other hand, had a significantly higher incidence of MN‐RET and lower %RET.
TABLE 7.
Frequencies (mean ± SD) of micronucleated (MN) reticulocytes in the peripheral blood of male rats administered 3‐CAA in drinking water
| Dose (mg/kg/day) | No. rats | MN/1000 PCE | % Reticulocytes a |
|---|---|---|---|
| 0 | 6 | 0.6 ± 0.5 | 2.01 ± 0.37 |
| 10 | 6 | 0.7 ± 0.2 | 1.98 ± 0.20 |
| 30 | 6 | 0.5 ± 0.2 | 2.55 ± 0.67 |
| 100 | 6 | 0.8 ± 0.4 | 1.50 ± 0.53 |
| 13CP | 6 | 3.8 ± 1.3 | 0.16 ± 0.07 |
Abbreviation: CP, cyclophosphamide.
(Reticulocytes/Total erythrocytes) × 100.
The mean cII MF in the liver tissue of the vehicle control rats was 35.0 × 10⁻⁶ whereas this value for the 3‐CAA treated groups ranged from 30.3 to 45.5 × 10⁻⁶ (p > .05) (Table 8). Similarly, no statistically significant difference was observed between vehicle control and any of the 3‐CAA treated groups for the mean cII MF in the bone marrow (27.7 × 10⁻⁶ in the vehicle control group versus 29.3–32.9 × 10⁻⁶ in the 3‐CAA treated groups, Table 9).
TABLE 8.
cII mutant frequencies in the liver of Big Blue® rats administered 3‐CAA in drinking water
| Dose (mg/kg/day) | Animal no. | No. of packaging | No. of phage screened | No. of mutants | cII mutant frequency (× 10−6) |
|---|---|---|---|---|---|
| 0 | 570 | 2 | 232,414 | 15 | 64.5 |
| 571 | 2 | 398,850 | 11 | 27.6 | |
| 572 | 3 | 283,494 | 6 | 21.2 | |
| 573 | 2 | 225,178 | 10 | 44.4 | |
| 574 | 3 | 346,067 | 6 | 17.3 | |
| Mean | 35.0 | ||||
| 10 | 576 | 3 | 303,500 | 14 | 46.1 |
| 577 | 2 | 296,690 | 14 | 47.2 | |
| 578 | 2 | 215,813 | 10 | 46.3 | |
| 579 | 2 | 342,662 | 11 | 32.1 | |
| 580 | 2 | 233,691 | 13 | 55.6 | |
| Mean | 45.5 | ||||
| 30 | 582 | 4 | 434,606 | 9 | 20.7 |
| 583 | 2 | 257,528 | 10 | 38.8 | |
| 584 | 2 | 223,901 | 5 | 22.3 | |
| 585 | 2 | 335,425 | 20 | 59.6 | |
| 586 | 2 | 220,070 | 7 | 31.8 | |
| Mean | 34.7 | ||||
| 100 | 588 | 2 | 203,469 | 6 | 29.5 |
| 589 | 2 | 314,142 | 7 | 22.3 | |
| 590 | 2 | 228,242 | 6 | 26.3 | |
| 591 | 2 | 342,236 | 13 | 38.0 | |
| 592 | 2 | 336,277 | 12 | 35.7 | |
| Mean | 30.3 | ||||
| PC | 437 | 2 | 471,213 | 120 | 254.7 |
| 438 | 2 | 357,560 | 71 | 198.6 | |
| 439 | 3 | 430,349 | 90 | 209.1 | |
| 440 | 2 | 427,369 | 51 | 119.3 | |
| 441 | 3 | 424,815 | 94 | 221.3 | |
| Mean | 200.6 | ||||
Abbreviation: PC, positive control.
TABLE 9.
cII mutant frequencies in the bone marrow of Big Blue® rats administered 3‐CAA in drinking water
| Dose (mg/kg/day). | Animal no. | No. of packaging | No. of phage screened | No. of mutants | cII mutant frequency (× 10−6) |
|---|---|---|---|---|---|
| 0 | 570 | 2 | 319,250 | 12 | 37.6 |
| 571 | 2 | 226,880 | 4 | 17.6 | |
| 572 | 2 | 271,916 | 7 | 25.7 | |
| 573 | 2 | 326,061 | 10 | 30.7 | |
| 574 | 2 | 297,967 | 8 | 26.8 | |
| Mean | 27.7 | ||||
| 10 | 576 | 3 | 329,892 | 10 | 30.3 |
| 577 | 3 | 503,564 | 7 | 13.9 | |
| 578 | 3 | 354,580 | 7 | 19.7 | |
| 579 | 3 | 260,934 | 17 | 65.2 | |
| 580 | 3 | 386,931 | 8 | 20.7 | |
| Mean | 30.0 | ||||
| 30 | 582 | 2 | 465,679 | 15 | 32.2 |
| 583 | 2 | 575,927 | 10 | 17.4 | |
| 584 | 2 | 354,580 | 9 | 25.4 | |
| 585 | 2 | 459,720 | 14 | 30.5 | |
| 586 | 2 | 317,547 | 13 | 40.9 | |
| Mean | 29.3 | ||||
| 100 | 588 | 2 | 375,438 | 16 | 42.6 |
| 589 | 2 | 325,805 | 11 | 33.8 | |
| 590 | 2 | 276,258 | 4 | 14.5 | |
| 591 | 2 | 273,704 | 11 | 40.2 | |
| 592 | 2 | 326,486 | 11 | 33.7 | |
| Mean | 32.9 | ||||
| PC | 437 | 3 | 482,280 | 180 | 373.2 |
| 438 | 2 | 445,247 | 180 | 404.3 | |
| 439 | 2 | 380,120 | 133 | 349.9 | |
| 440 | 2 | 397,573 | 174 | 437.7 | |
| 441 | 2 | 426,518 | 203 | 475.9 | |
| Mean | 408.2 | ||||
Abbreviation: PC, positive control.
4. DISSCUSSION
3‐CAA was mutagenic in the in vitro mouse lymphoma forward gene mutation assay (MLA); however, such mutagenic activity was not observed either in bacteria or in vivo in the liver and bone marrow tissues of transgenic Big Blue® rats. Furthermore, 3‐CAA did not induce micronuclei in the erythrocytes of mice or rats. The positive response in the MLA was relatively weak but dose‐related and reproducible. Increases were observed both with and without S9, and there was no evidence for a preferential induction of small versus large colonies. Since MLA detects a wide range of genetic events (point mutations, deletions, chromosomal rearrangements, and mitotic recombination Schisler, et al., 2019), the genetic events responsible for the increased MF are unknown. However, given the absence of mutagenic activity in bacteria, it appears that 3‐CAA and/or its metabolites are unlikely to be DNA‐reactive. This assumption is further strengthened by the absence of mutagenic or cytogenetic activity in vivo given the general observation that DNA‐reactive substances typically (but not always) induce both gene mutations and cytogenetic effects.
Although the bioavailability of orally administered 3‐CAA was not determined either in the mouse or the rat as part of the studies reported here, corroborative experimental and in silico GastroPlusTM modeling data support the conclusion that the test substance is readily absorbed and bioavailable following oral administrations. Absorption of 3‐CAA in rats following single oral gavage administration of either 5 or 65 mg/kg body weight was found to be high, with approximately 50%–52%, 21%, and 5%–6% of the radioactivity recovered in expired air, urine, and tissues/carcasses, respectively; 13% of the radioactivity was recovered in feces. The total recovery of radioactivity in this study was 92%–99%. The major metabolite of 3‐CAA was tentatively identified as 3,3‐bis‐S‐(N‐acetylcysteinyl)‐1‐propanol, which is proposed to arise from dual conjugation with glutathione (Hansen and Bartels, 2000). In this study, half‐lives for excretion of 14C‐activity were estimated to be 3.92 and 7.43 h in urine and 3.62 and 4.30 h in exhaled air for the 5 and 65 mg/kg, respectively. In a recent study (unpublished), 3‐CAA in water was administered daily for 28 days by oral gavage to male and female Sprague–Dawley rats at dose levels of 10, 25, and 50 mg/kg/day. The plasma C max, T max, and AUCTlast parameters estimated in this study, respectively, based on sampling blood and quantitative analysis of 3‐CAA following the last day of dosing were 3030 ng/ml, 10 min, and 92,100 min*ng/ml for 10 mg/kg/day dose level, 6010 ng/ml, 10 min, and 230,000 min*ng/ml for 25 mg/kg/day dose level, and 13,300 ng/ml, 10 min, and 480,000 min*ng/ml for the 50 mg/kg/day dose level. Gastro PlusTM PBPK model for predicting the toxicokinetic profile of 3‐CAA (see Table S1 for details) also showed the oral absorption via drinking water to be >99% for all the dose levels administered in the transgenic rat study. Systemic levels of this substance are predicted to be well distributed to tissues, including the liver and bone marrow.
The oral gavage route of administration, rather than the drinking water, was a logical choice for the acute study design used for the mouse bone marrow micronucleus test. Although no mortalities were observed at the highest dose of 125 mg/kg, one of the eight mice died at this dose level within 3 days in a range‐finding study; eight out of eight mice died at the next higher dose of 250 mg/kg. Thus, the highest dose level used in the mouse micronucleus test represented the maximum tolerated dose.
The most relevant route of human exposure to 3‐CAA is oral. The drinking water, rather than dietary, route was opted for the transgenic Big Blue® rat study since data were already available for dose level selection from an existing 28‐day toxicity study in Fischer 344 rats using this route of administration (Crissman et al., 1999). Secondly, the delivery of 3‐CAA via drinking water is analogous to dietary administration, and thus a separate dietary study was deemed to be unnecessary in the interest of animal welfare considerations.
The concentration of 3‐CAA administered in the drinking water to deliver the 100 mg/kg/day targeted dose had palatability issues, demonstrating that this dose level represented the maximum practicable dose without compromising the general health and welfare of the animals. In addition, the maximum concentration of 3‐CAA administered in the drinking water (1.75 mg /ml) was nearly 18,000,000‐times higher than the highest concentration of this substance measured in the EU groundwater (Terry et al., 2008).
Liver is the primary target organ in Fischer 344 rats following the drinking water administration of 3‐CAA for 28 days (Crissman et al., 1999). The effects observed included hepatocellular hypertrophy and individual cell necrosis in five out of five males in the 100 mg/kg/day dose group. These changes were also observed in the 30 mg/kg/day dose group, albeit at a lower frequency. At the 100 mg/kg/day targeted dose, the above liver effects were accompanied by chronic periportal inflammation and scattered mitotic figures––changes interpreted to be reparative responses.
The drinking water route enabled administration of much higher doses than could have been achieved via oral gavage. With oral gavage, it is unlikely that rats would have tolerated 28 days of repeat dosing at 100 mg/kg/day given 3/5 females Fischer 344 rats died on the first day of dosing at this level in an acute oral toxicity study (Stebbins & Brook, 1999). In a developmental toxicity probe study, 2 of 10 pregnant female CD rats dosed with 75 mg/kg/day died after receiving two doses of 3‐CAA (Carney & Liberacki, 1999). Thus, 3‐CAA was evaluated in the transgenic study using a route of administration that enabled the delivery of the maximum achievable internal dose level.
In conclusion, the weak mutagenic response observed in the in vitro mouse lymphoma assay is not confirmed in the in vivo transgenic study. Based on this observation along with the lack of cytogenetic activity in vivo, it is concluded that 3‐CAA is not likely to pose a mutagenic risk.
AUTHOR CONTRIBUTIONS
Aisling Redmond, WanYun Cheng, and B. Bhaskar Gollapudi analyzed the data and prepared the manuscript. Fagen Zhang conducted the GastroPlusTM in silico PBPK simulation.
CONFLICT OF INTEREST
Fagen Zhang is an employee of Dow which manufactures 1,3‐dichloropropene. Aisling Redmond and WanYun Cheng are employees of UPL, which markets clethodim herbicide, where 3‐CAA is formed in leafy crops as a glycoside following clethodim application. Bhaskar Gollapudi is a former employee of Dow and received financial compensation from Dow/UPL for his consulting work on the transgenic study and preparation of the manuscript.
Supporting information
Appendix S1: Supporting Information
ACKNOWLEDGMENTS
The Ames test was conducted at Covance, Vienna, VA under the study directorship of Mr T. E. Lawlor. The combined in vivo transgenic rat mutation assay and erythrocyte micronucleus test was conducted at BioReliance, Gaithersburg, MD under the study directorship of Dr M. Young. The in vitro mouse lymphoma forward mutation assay and the mouse bone marrow micronucleus test were conducted at Dow under the study directorship of V. A. Linscombe and S. J. Day, respectively. We thank Matthew J. LeBaron (Dow) for his guidance on GastroPlus™ simulation and Victoria Clayton (UPL Europe Ltd.) for reviewing the manuscript.
Redmond, A. , Zhang, F. , Cheng, W. & Gollapudi, B.B. (2023) In vitro and in vivo assessments of the genotoxic potential of 3‐chloroallyl alcohol. Environmental and Molecular Mutagenesis, 64(1), 26–38. Available from: 10.1002/em.22515
Accepted by: S. Dertinger
REFERENCES
- Ames, B. , McCann, J. & Yamasaki, E. (1975) Methods for detecting carcinogens and mutagens with the salmonella/mammalian‐microsome mutagenicity test. Mutation Research, 31, 347–364. [DOI] [PubMed] [Google Scholar]
- Badding, M. , Gollapudi, B.B. , Gehen, S. & Yan, Z.J. (2020) In vivo mutagenicity evaluation of the soil fumigant 1,3‐dichloropropene. Mutagenesis, 35(5), 437–443. 10.1093/mutage/geaa015 [DOI] [PubMed] [Google Scholar]
- Bartels, M.J. , Hansen, S. , Thornton, C. , Brzak, K. , Mendrala, A. , Dietz, F. et al. (2004) Pharmacokinetics and metabolism of 14C‐1,3‐dichloropropene in the Fischer 344 rat and the B6C3F1 mouse. Xenobiotica, 34(2), 193–213. [DOI] [PubMed] [Google Scholar]
- Carney, E. & Liberacki, A. (1999) 3‐chloroallyl alcohol: oral gavage developmental toxicity study in cd rats. Report number 981204. Midland, MI: The Dow Chemical Company. Available from: https://www.efsa.europa.eu/en/consultations/call/public-consultation-active-substance-13-dichloropropene [Accessed 29th September 2022] [Google Scholar]
- Crissman, J. , Dryzga, M. & Cieszlak, F. (1999) 3‐chloroallyl alcohol: 4‐week repeated dose drinking water toxicity study in Fischer 344 rats. Report number 981194. Midland, MI: The Dow Chemical Company. Available from: https://www.efsa.europa.eu/en/consultations/call/public-consultation-active-substance-13-dichloropropene [Accessed 29th September 2022] [Google Scholar]
- EU DAR (2004) 1,3‐Dichloropropene Draft Assessment Report (2004) Volume 3 B6c. Available from: https://www.efsa.europa.eu/en/consultations/call/public-consultation-active-substance-13-dichloropropene.
- EU RAR . 2018. 1,3‐Dichloropropene Rapporteur Assessment Report (2018) Volume 3 B6. Available from: https://www.efsa.europa.eu/en/consultations/call/170510.
- Gollapudi, B.B. , Cieszlak, F.S. , Day, S.J. & Carney, E.W. (1998) Dominant lethal test with rats exposed to 1,3‐dichloropropene by inhalation. Environmental and Molecular Mutagenesis, 32(4), 351–359. [DOI] [PubMed] [Google Scholar]
- Hansen, S. & Bartels, M. (2000) Pharmacokinetics and metabolism of either 14c‐3‐chloroallyl alcohol or 14c‐3‐chloroacrylic acid following a single oral administration to male Fischer 344 rats. Report number 991136. Midland, MI: The Dow Chemical Company. Available from https://www.efsa.europa.eu/en/consultations/call/public-consultation-active-substance-13-dichloropropene [Accessed 29th September 2022] [Google Scholar]
- Hsie, A.W. , Brimer, P.A. , O'Neill, J.P. , Epler, J.L. , Guerin, M.R. & Hsie, M.H. (1980) Mutagenicity of alkaline constituents of a coal‐liquified crude oil in mammalian cells. Mutation Research, 78(1), 79–84. 10.1016/0165-1218(80)90028-2 [DOI] [PubMed] [Google Scholar]
- Kirkland, D. (1989) Statistical evaluation of mutagenicity test data. New York: Cambridge University Press. [Google Scholar]
- McCall, P.J. (1987) Hydrolysis of 1,3‐dichloropropene in dilute aqueous solution. Pesticide Science, 19, 235–242. [Google Scholar]
- OECD Organisation of Economic Co‐operation and Development Guidelines for Testing of Chemicals . (2020) Test guideline No. 488 transgenic rodent somatic and germ cell. Paris: OECD. [Google Scholar]
- Schisler, M. , Morre, M. & Gollapudi, B. (2019) In vitro mouse lymphoma cell (L5178Y Tk +/− 3.7.2.C) forward mutation assay. Methods in Molecular Biology, 2031, 3–28. [DOI] [PubMed] [Google Scholar]
- Schmid, W. (1976) The micronucleus test for cytogenetic analysis. In: Hollaender, A. (Ed.) Chemical mutagens: principles and methods for their detection. New York: Plenum. [Google Scholar]
- Stebbins, K. & Brooks, K. (1999) 3‐chloroallyl alcohol: acute oral toxicity study in Fischer 344 rats. Report number 991014. Midland, MI: The Dow Chemical Company. Available from: https://www.efsa.europa.eu/en/consultations/call/public-consultation-active-substance-13-dichloropropene [Accessed 29th September 2022] [Google Scholar]
- Stott, W. , Gollapudi, B. & Rao, K. (2001) Mammalian toxicity of 1,3‐dichloropropene. Reviews of Environmental Contamination and Toxicology, 168, 1–42. [DOI] [PubMed] [Google Scholar]
- Terry, A.S. , Carter, A.D. , Humphrey, R.L. , Capri, E. , Grua, B. , Panagopoulous, A.C. et al. (2008) A monitoring programme for 1,3‐dichloropropene and metabolites in groundwater in five EU countries. Pest Management Science, 64(9), 923–932. 10.1002/ps.1585 [DOI] [PubMed] [Google Scholar]
- van Wesenbeeck, I. & Knowles, S . (2019) Groundwater monitoring for 1,3‐Dichloropropene in high fumigant use areas of North America and Europe. Pest Management Science, 75(8), 2278–2282. [DOI] [PMC free article] [PubMed] [Google Scholar]
- Winer, B. (1971) Statistical principles in experimental design, 2nd edition. New York: McGraw‐Hill. [Google Scholar]
- Yan, Z.J. , Bartels, M. , Gollapudi, B. , Driver, J. , Himmelstein, M. , Gehen, S. et al. (2020) Weight of evidence analysis of the tumorigenic potential of 1,3‐dichloropropene supports a threshold‐based risk assessment. Critical Reviews in Toxicology, 50(10), 836–860. 10.1080/10408444.2020.1845119 [DOI] [PubMed] [Google Scholar]
Associated Data
This section collects any data citations, data availability statements, or supplementary materials included in this article.
Supplementary Materials
Appendix S1: Supporting Information