Abstract
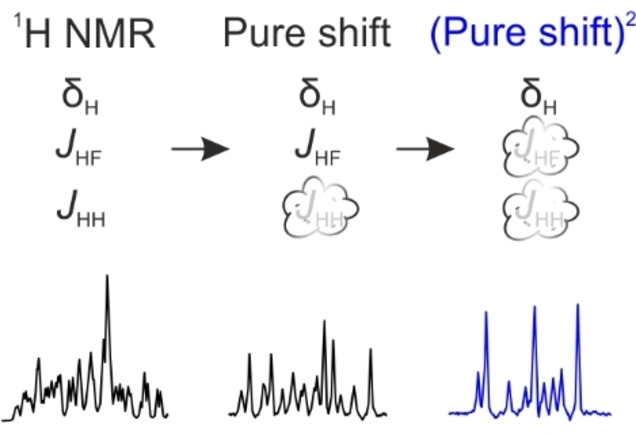
The 1H NMR analysis of species containing NMR‐active heteronuclei can be difficult due to signal overlap caused by the combined effects of homonuclear and heteronuclear scalar (J) couplings. Here, a general pure shift method is presented for obtaining ultra‐high resolution 1H NMR spectra where spectral overlap is drastically reduced by suppressing both homonuclear and heteronuclear J‐couplings, giving one single signal per 1H chemical environment. Its usefulness is demonstrated in the analysis of fluorine‐ and phosphorus‐containing compounds of pharmaceutical and biochemical interest.
Keywords: analytical methods, fluorine, NMR spectroscopy, structure elucidation, phosphorus
Ultra‐high resolution 1 H NMR spectra are obtained by simultaneous broadband suppression of both homonuclear and heteronuclear scalar couplings, giving a fully pure shift 1H NMR spectrum containing chemical shift information only. The analysis of a range of fluorine‐ and phosphorus‐containing systems highlights how this method can be used to aid the analysis of even the most complex systems.
Introduction
1H NMR is one of the most commonly used spectroscopic techniques as it provides valuable information on chemical structure and conformation. Because of the narrow spectral range of 1H, significant peak overlap due to multiplet structure caused by scalar (J) couplings is common, reducing spectral resolution and hindering the ability to extract useful information. Pure shift NMR techniques[ 1 , 2 , 3 , 4 ] greatly improve spectral resolution by suppressing the effects of homonuclear J HH couplings in 1H NMR spectra. These methods can lead to a single signal for each chemical site, but only if no other abundant NMR‐active nuclei such as 19F and 31P are present in the spin system. NMR measurements on compounds containing these particular nuclei are increasingly widespread due to their importance in pharmaceuticals[ 5 , 6 , 7 ] and biochemistry.[ 8 , 9 ] 19F and 31P have a natural abundance of 100 % and are spin‐ , so in 1H NMR their heteronuclear couplings cause multiplet structure in just the same way as homonuclear couplings. In a conventional pure shift NMR spectrum, heteronuclear couplings are still present, complicating analysis. Here we present a general method that simultaneously suppresses both homonuclear couplings and all heteronuclear couplings with a given isotope, giving a fully pure shift NMR spectrum.
Results and Discussion
An example of the sort of signal overlap caused by simultaneous homonuclear and heteronuclear couplings is shown in the 1H NMR spectrum (Figure 1a) of a diastereomeric mixture of N‐Boc‐L‐4‐fluoroprolines (Scheme 1). Fluoroprolines have a wide range of applications in protein and peptide conformational studies.[ 8 , 10 , 11 ] They typically exist in multiple conformations, leading to very complex 1H NMR spectra. Couplings to 19F can easily be suppressed in conventional 1H NMR spectra by heteronuclear decoupling during signal acquisition, leaving only homonuclear couplings.[ 12 , 13 , 14 , 15 ] However, despite the reduction in peak complexity, severe signal overlap is still observed (Figure 1b). Structural assignment of individual proton environments is near impossible, particularly in the region between 2.0 and 3.7 ppm. An alternative approach to reducing spectral complexity is to use a pure shift method to remove the effects of homonuclear coupling, leaving only those of heteronuclear coupling,[ 1 , 2 , 3 , 4 ] as seen in Figure 1c. For simple molecules, pure shift methods can be very useful for measuring heteronuclear coupling constants.[ 16 , 17 , 18 , 19 ] However, in more complex systems, even after suppressing all homonuclear couplings, heteronuclear multiplicity remains a problem for spectral analysis. For example, in the fluoroproline mixture studied, only with the aid of the fully decoupled pure shift NMR spectrum (Figure 1d), measured using the new method presented here, is the full anatomy of the spectrum exposed.
Figure 1.
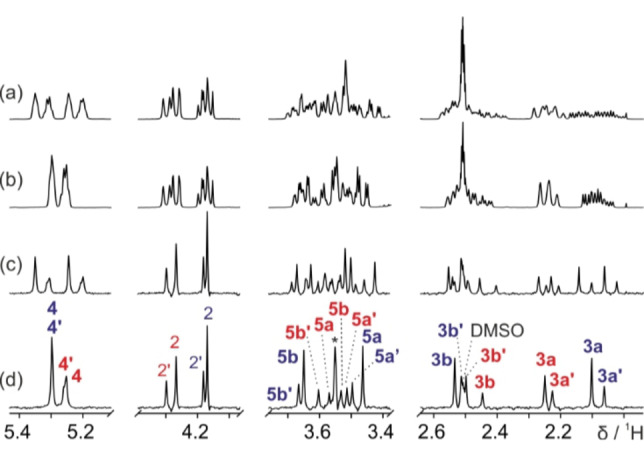
500 MHz 1H NMR spectra of a 90 mM solution of (4R)‐N‐Boc‐L‐fluoroproline and 87 mM of (4S)‐N‐Boc‐L‐fluoroproline (Scheme 1) in DMSO‐d 6, showing only the regions of interest. (a) 1H NMR, (b) 1H{19F} NMR, (c) PSYCHE pure shift, and (d) PSYCHE pure shift measured using the new method for simultaneous homonuclear and heteronuclear decoupling. The asterisk indicates a strong coupling artefact. Structural assignments are shown in (d), where peaks with suppressed J HF couplings are highlighted in bold. Further experimental details and full spectra are given in the Supporting Information.
Scheme 1.
(left) 2 major rotamers of (4R)‐N‐Boc‐L‐fluoroproline and (right) 2 major rotamers of (4S)‐N‐Boc‐L‐fluoroproline. Trans/cis refers to the amide rotation and Cγ exo/endo refers to the pyrrolidine ring pucker conformation.
At first sight, the solution seems obvious: suppress heteronuclear couplings in a pure shift NMR spectrum by applying broadband decoupling to 19F during signal acquisition, just as in the conventional 1H{19F} NMR spectrum. Unfortunately, it is not sufficient only to irradiate 19F during signal acquisition since heteronuclear couplings evolve throughout the pure shift pulse sequence (see Supporting Information, Figure S9). Application of broadband heteronuclear decoupling throughout the pulse sequence would collapse the multiplicity but can be impractical due to the use of field gradient pulses, as their application greatly increases the range of Larmor frequencies. A real‐time pure shift method published by Lokesh et al. for selective measurement of individual 1H‐19F couplings [20] could in principle allow fully 19F decoupled pure shift 1H NMR spectra to be obtained. However, this application has not yet been demonstrated and the method would not be suitable for large J HF values and/or wide 19F chemical shift ranges. There is also an existing pure shift experiment that routinely incorporates heteronuclear decoupling, the BIRD method, [21] but the decoupling mechanism is specific to the BIRD pulse sequence element, has limited heteronuclear bandwidth, and is not generally applicable.
Here, we present a general pure shift NMR approach in which both homonuclear and heteronuclear J‐couplings are efficiently suppressed over a wide range of heteronuclear coupling constants and chemical shifts, by refocussing J HX prior to decoupling. The new method provides a true pure shift 1H NMR spectrum, in which peak positions are determined solely by chemical shifts. As shown in Figure 1d, the new method yields a significant improvement in resolution when applied to the fluoroproline mixture. In the region 3.4–3.7 ppm, the complex multiplet patterns caused by J HF couplings are greatly simplified, allowing each chemical shift to be distinguished, and subsequently assigned with the aid of conventional 1D and 2D experiments. The proposed fully decoupled interferogram pure shift method is shown in Figure 2. The sequence shown uses the PSYCHE approach,[ 22 , 23 ] but the same logic can be applied using Zangger‐Sterk, [24] band‐selective[ 25 , 26 , 27 ] or BIRD elements. [28] An adiabatic heteronuclear 180° pulse is applied midway through each t 1/2 evolution period, refocusing the evolution of the heteronuclear couplings. The use of adiabatic pulses, counter‐sweeping to refocus chemical shift evolution during the pulses, ensures efficient inversion over the wide chemical shift ranges typically encountered for nuclei such as 19F and 31P. Just as in the conventional 1H{19F} NMR experiment, broadband adiabatic decoupling is applied during acquisition. This approach ensures that the effects of all heteronuclear couplings, whether large or small, are suppressed in a fully pure shift 1H NMR spectrum. In pure shift experiments, the price for signal simplification is a reduction in sensitivity, typically to about 5–20 % of that of the conventional 1H NMR spectrum. The new method does not incur any extra cost in experiment time compared with the conventional interferogram pure shift experiment, and increases the signal‐to‐noise ratio of the decoupled signals by at least a factor of two.
Figure 2.

Generally‐applicable pulse sequence for heteronuclear decoupled 1D pure shift NMR. Narrow and wide filled rectangles denote hard 90° and 180° radiofrequency pulses, respectively. Trapezoids with cross‐diagonal arrows denote low‐power saltire [23] chirp pulses of nominal flip angle β (∼20°). Trapezoids on the heteronuclear (X) channel denote frequency‐swept adiabatic 180° pulses. When t 1=0, these frequency‐swept pulses are not applied. Broadband adiabatic decoupling (CPD) is applied during acquisition. G1 and G2 represent pulsed field gradients for coherence transfer pathway selection, and G3 denotes a weak rectangular pulsed field gradient. Here, the PSYCHE pure shift version of the experiment is shown, but band‐selective and Zangger‐Sterk elements can be used in place of PSYCHE; these are coded as options in the pulse program code provided in the Supporting Information.
As previously mentioned, an alternative and simpler strategy, used by Lokesh et al., [20] is to treat the heteronuclear couplings in the same way as homonuclear couplings, simply adding a hard X 180° pulse simultaneously with the hard 1H 180° pulse in a standard pure shift sequence (see Supporting Information, Section 1b). However, this approach only gives good results when the magnitudes of heteronuclear couplings are no greater than those of homonuclear couplings (see Supporting Information, Figure S6) and the heteronucleus chemical shift range is relatively narrow, although it does away entirely with the need for broadband X irradiation, minimising sample heating. With large J HF values, such as those in the fluoroproline compounds, using this approach results in large artefacts and imperfectly decoupled signals (see Supporting Information, Figure S7).
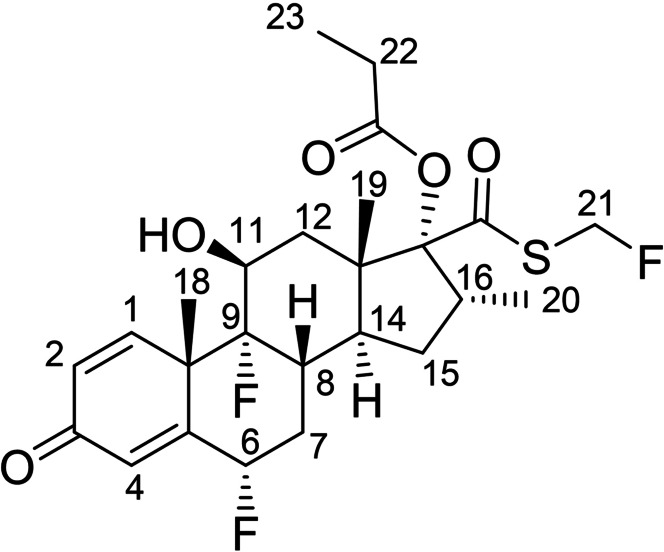
The general applicability of the new method is demonstrated in the analysis of fluticasone propionate (Scheme 2), a trifluoroglucocorticoid used in the treatment of asthma and allergic rhinitis.[ 29 , 30 ] Here, peak overlap is less severe than in the previous example, but the presence of three different fluorine chemical environments spanning over 30 ppm poses a different challenge. The conventional 1H NMR spectrum (Figure 3a) shows poor spectral resolution in several regions due to the combination of homonuclear and heteronuclear couplings, e. g. for protons 7b (1.51 ppm), 8 (2.54 ppm) and 6 (5.64 ppm). Resolution is improved when either heteronuclear or homonuclear decoupling is applied (Figures 3b and 3c, respectively), but neither method fully resolves every chemical site. Only when the new method is applied, removing the effects of both homonuclear and heteronuclear couplings, is a true pure shift 1H NMR spectrum obtained in which each distinct chemical site is represented by a single peak (Figure 3d). With a 30 ppm 19F chemical shift range, the adiabatic pulses in the new method ensure effective inversion of all 19F resonances (see Supporting Information, Figure S8).
Scheme 2.
Fluticasone propionate.
Figure 3.
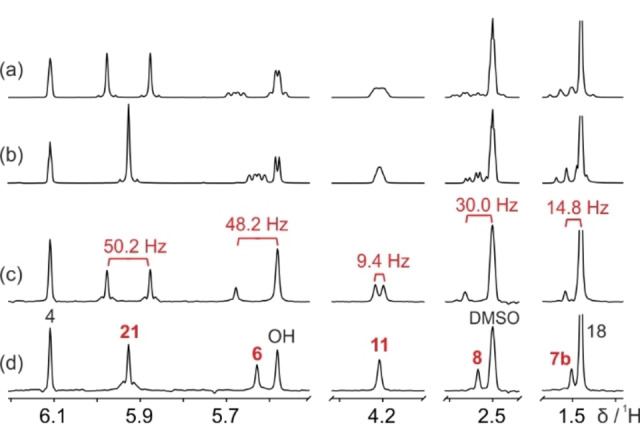
500 MHz 1H NMR spectra of a 22 mM solution of fluticasone propionate (Scheme 2) in DMSO‐d 6, showing only the regions of interest. (a) 1H NMR, (b) 1H{19F} NMR, (c) pure shift PSYCHE, and (d) fully decoupled pure shift PSYCHE. J HF couplings are shown in (c). Structure assignment is shown in (d), where peaks with suppressed J HF coupling are highlighted in red. Further experimental details and full spectra are given in the Supporting Information.
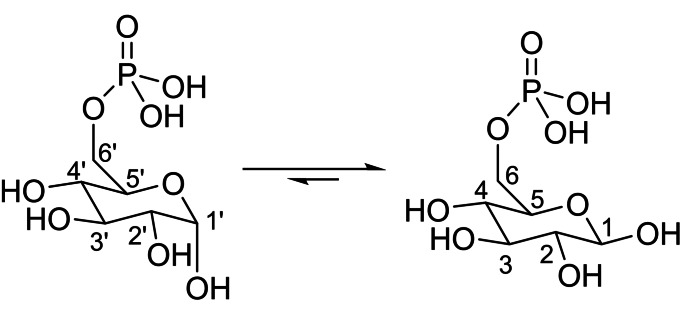
This new pure shift method is a general tool that can easily be applied to decouple other nuclei with large chemical shift ranges and/or wide ranges of J HX coupling values. Possible other examples include carbon‐13, silicon‐29 and phosphorus‐31. Here, its applicability to 31P is demonstrated on the key metabolite D‐glucose‐6‐phosphate (Scheme 3). [31] With heteronuclear couplings J HP comparable in magnitude to J HH couplings, and with most of the protons resonating within 1 ppm, spectral interpretation is difficult even for this relatively simple molecule. In water, the equilibrium between the α and β anomeric forms [32] complicates the 1H NMR spectrum further (Figure 4a). Phosphorus decoupling (Figure 4b) gives only a small improvement. The standard pure shift NMR spectrum (Figure 4c) drastically reduces signal overlap, allowing protons H4’, H4 and H2’ at 3.6 ppm to be distinguished. All signals are fully decoupled when the new method is applied (Figure 4d).
Scheme 3.
(left) α‐D‐glucose‐6‐phosphate and (right) β‐D‐glucose‐6‐phosphate.
Figure 4.
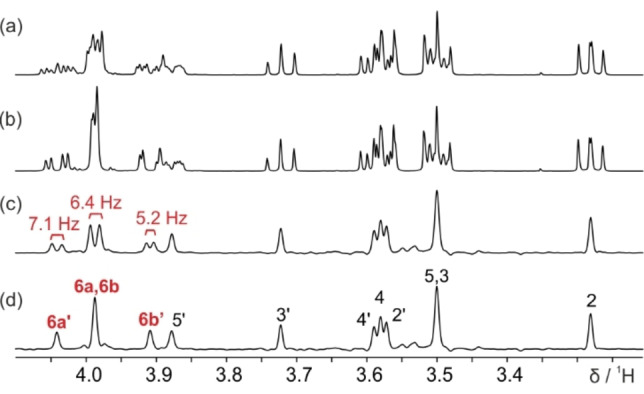
500 MHz 1H NMR spectra of a 30 mM solution of D‐glucose‐6‐phosphate in D2O, in which signals are seen from both α and β anomers (Scheme 3). (a) 1H NMR, (b) 1H{31P} NMR, (c) pure shift PSYCHE, and (d) fully decoupled pure shift PSYCHE. J HP couplings are shown in Figure 4c. Structure assignment is shown in (d), where peaks with suppressed J HP coupling values are highlighted in red. Further experimental details are given in the Supporting Information.
Conclusion
Here, we have presented a general pure shift experiment that allows the effects of homonuclear and heteronuclear scalar couplings to be simultaneously suppressed for a wide range of heteronuclear chemical shifts and couplings. This general tool is suitable for decoupling high‐abundance nuclei, including fluorine‐19 and phosphorus‐31, over the full range of chemical shifts and heteronuclear coupling constants. Its usefulness has been demonstrated in the analysis of fluorine‐ and phosphorus‐containing pharmaceutical and biochemical molecules, yielding a significant increase in resolution when compared to conventional pure shift methods, without increasing experiment time. Such experiments can be used to aid complex sample or mixture analysis, be easily applied to other NMR‐active nuclides to suppress J HX couplings in pure shift 1H NMR spectra, and have potential applications throughout chemistry, biochemistry, and chemical biology.
Experimental Section
Sample Preparation
All compounds used were commercially available from Sigma‐Aldrich and were used without further purification. Fluoroproline sample contained a mixture of 15.7 mg of (4R)‐N‐Boc‐L‐fluoroproline and 15.3 mg of (4S)‐N‐Boc‐L‐fluoroproline dissolved in 750 μL of DMSO‐d 6. Fluticasone sample contained 8.1 mg of fluticasone propionate dissolved in 750 μL of DMSO‐d 6. Glucose mixture contained 6.4 mg of D‐glucose‐6‐phosphate sodium salt dissolved in 750 μL of D2O. The sample was left overnight before analysis to ensure that equilibrium between α and β anomeric forms was reached.
Data Acquisition
All experimental spectra were recorded at 298 K on a Bruker Avance NEO 500 MHz NMR spectrometer with a 5 mm TBI probe equipped with a z‐gradient coil with a maximum nominal gradient strength of 67 G cm−1. Conventional 1H NMR experiments were recorded with 5 kHz spectral width and 16k complex points. The duration of the hard 90° pulse was set to 12.80, 13.00 and 13.93 μs for the fluoroproline, fluticasone and glucose samples, respectively. For heteronuclear decoupling during acquisition, adiabatic decoupling sequence ‘p5 m4sp180.2’ was applied, with a WURST pulse with 80 % smoothing, a Q factor of 3, and a duration of 3.82, 3.94 and 6 ms for the fluoroproline, fluticasone and glucose samples, respectively. 1D pure shift spectra were recorded with 5 kHz spectral width, 64, 20 and 20 t 1 increments and 12800, 4000 and 4000 complex points for the fluoroproline, fluticasone and glucose samples, respectively. A chunk duration of 20 ms was used in all pure shift experiments. Adiabatic WURST inversion pulses with 20 % smoothing were applied during the t 1 incremented delays, with a duration of 3 ms and a Q factor of 3. Pure shift PSYCHE data was acquired using a double saltire pulse with a flip angle of 20°, 20°, 15° and a total duration of 200, 60 and 200 ms for the fluoroproline, fluticasone and glucose samples, respectively. G1 and G2 are half‐sine shaped gradient pulses with amplitudes of 52.9 and 31.5 G cm−1, respectively, and a duration of 1 ms each. G3 is a rectangular gradient pulse, aligned with the midpoint of the double saltire pulse, and has an amplitude of 0.67 G cm−1. Further experimental details and pulse program codes for Bruker spectrometers are given in the Supporting Information.
Data Processing
All data was processed with zero‐filling, Gaussian line broadening, Fourier transformation, and phase and baseline correction using the TOPSPIN program (Bruker Biospin). Pure shift data was processed using the reconstruction macro pshift4f.
All experimental data, pulse program codes, macros and experimental parameters are freely available at https://doi.org/10.48420/19583323.
Conflict of interest
The authors declare no conflict of interest.
1.
Supporting information
As a service to our authors and readers, this journal provides supporting information supplied by the authors. Such materials are peer reviewed and may be re‐organized for online delivery, but are not copy‐edited or typeset. Technical support issues arising from supporting information (other than missing files) should be addressed to the authors.
Supporting Information
Acknowledgements
This work was supported by the Engineering and Physical Research Council (grant numbers EP/R018790/1 and EP/N033949/1), and by the University of Manchester (Dame Kathleen Ollerenshaw Fellowship to LC; studentship to CM). The authors thank Miss Beth Lloyd for her contributions on the early stage of the project and Drs. Ralph Adams and Peter Kiraly for fruitful discussions. For the purpose of open access, the author has applied a Creative Commons Attribution (CC BY) licence to any Author Accepted Manuscript version arising.
Mycroft C., Nilsson M., Morris G. A., Castañar L., ChemPhysChem 2022, 23, e202200495.
Data Availability Statement
The data that support the findings of this study are openly available in Figshare at https://doi.org/10.48420/19583323, reference number 19583323.
References
- 1. Adams R. W., eMagRes 2014, 3, 1–15. DOI: 10.1002/9780470034590.emrstm1362. [DOI] [Google Scholar]
- 2. Castañar L., Parella T., Magn. Reson. Chem. 2015, 53, 399–426. [DOI] [PubMed] [Google Scholar]
- 3. Zangger K., Prog. Nucl. Magn. Reson. Spectrosc. 2015, 86–87, 1–20. [DOI] [PubMed] [Google Scholar]
- 4. Castañar L., Magn. Reson. Chem. 2017, 55, 47–53. [DOI] [PubMed] [Google Scholar]
- 5. Martino R., Gilard V., Desmoulin F., Malet-Martino M., J. Pharm. Biomed. Anal. 2005, 38, 871–891. [DOI] [PubMed] [Google Scholar]
- 6. Shah P., Westwell A. D., J. Enzyme Inhib. Med. Chem. 2007, 22, 527–540. [DOI] [PubMed] [Google Scholar]
- 7. Mei H., Han J., Fustero S., Medio-Simon M., Sedgwick D. M., Santi C., Ruzziconi R., Soloshonok V. A., Chem. Eur. J. 2019, 25, 11797–11819. [DOI] [PubMed] [Google Scholar]
- 8. Holzberger B., Obeid S., Welte W., Diederichs K., Marx A., Chem. Sci. 2012, 3, 2924–2931. [Google Scholar]
- 9. Vetter N. D., Jagdhane R. C., Richter B. J., Palmer D. R. J., ACS Chem. Biol. 2020, 15, 2205–2211. [DOI] [PubMed] [Google Scholar]
- 10. Rubini M., Schärer M. A., Capitani G., Glockshuber R., ChemBioChem 2013, 14, 1053–1057. [DOI] [PubMed] [Google Scholar]
- 11. Hofman G. J., Ottoy E., Light M. E., Kieffer B., Kuprov I., Martins J. C., Sinnaeve D., Linclau B., Chem. Commun. 2018, 54, 5118–5121. [DOI] [PubMed] [Google Scholar]
- 12. Levitt M. H., Freeman R., Frenkiel T. A., J. Magn. Reson. 1982, 47, 328–330. [Google Scholar]
- 13. Shaka A. J., Keeler J., Frenkiel T. A., Freeman R., J. Magn. Reson. 1983, 52, 335–338. [Google Scholar]
- 14. Shaka A. J., Keeler J., Prog. Nucl. Magn. Reson. Spectrosc. 1987, 19, 47–129. [Google Scholar]
- 15. Freeman R., Kupče Ē., NMR Biomed. 1997, 10, 372–380. [DOI] [PubMed] [Google Scholar]
- 16. Aguilar J. A., Morris G. A., Kenwright A. M., RSC Adv. 2014, 4, 8278–8282. [Google Scholar]
- 17. Chaudhari S. R., Suryaprakash N., RSC Adv. 2014, 4, 15018–15021. [Google Scholar]
- 18. Marcó N., Fredi A., Parella T., Chem. Commun. 2015, 51, 3262–3265. [DOI] [PubMed] [Google Scholar]
- 19. Kakita V. M. R., Rachineni K., Hosur R. V., Magn. Reson. Chem. 2018, 56, 1043–1046. [DOI] [PubMed] [Google Scholar]
- 20. Lokesh N., Sachin S. L., Mishra S. K., Suryaprakash N., Chem. Phys. Lett. 2015, 640, 157–160. [Google Scholar]
- 21. Aguilar J. A., Nilsson M., Morris G. A., Angew. Chem. Int. Ed. 2011, 50, 9716–9717; [DOI] [PubMed] [Google Scholar]; Angew. Chem. 2011, 123, 9890–9891. [Google Scholar]
- 22. Foroozandeh M., Adams R. W., Meharry N. J., Jeannerat D., Nilsson M., Morris G. A., Angew. Chem. Int. Ed. 2014, 53, 6990–6992; [DOI] [PMC free article] [PubMed] [Google Scholar]; Angew. Chem. 2014, 126, 7110–7112. [Google Scholar]
- 23. Foroozandeh M., Morris G. A., Nilsson M., Chem. Eur. J. 2018, 24, 13988–14000. [DOI] [PubMed] [Google Scholar]
- 24. Zangger K., Sterk H., J. Magn. Reson. 1997, 489, 486–489. [Google Scholar]
- 25. Castañar L., Nolis P., Virgili A., Parella T., Chem. Eur. J. 2013, 19, 17283–17286. [DOI] [PubMed] [Google Scholar]
- 26. Adams R. W., Byrne L., Király P., Foroozandeh M., Paudel L., Nilsson M., Clayden J., Morris G. A., Chem. Commun. 2014, 50, 2512–2514. [DOI] [PubMed] [Google Scholar]
- 27. Ying J., Roche J., Bax A., J. Magn. Reson. 2014, 241, 97–102. [DOI] [PMC free article] [PubMed] [Google Scholar]
- 28. Garbow J. R., Weitekamp D. P., Pines A., Chem. Phys. Lett. 1982, 93, 504–509. [Google Scholar]
- 29. Nelson H. S., Busse W. W., Kerwin E., Church N., Emmett A., Rickard K., Knobil K., J. Allergy Clin. Immunol. 2000, 106, 1088–1095. [DOI] [PubMed] [Google Scholar]
- 30. Kariyawasam H. H., Scadding G. K., J. Asthma Allergy 2010, 3, 19–28. [PMC free article] [PubMed] [Google Scholar]
- 31. Rajas F., Gautier-Stein A., Mithieux G., Metabolites 2019, 9, 282. [DOI] [PMC free article] [PubMed] [Google Scholar]
- 32. Schray K. J., Howell E. E., Arch. Biochem. Biophys. 1978, 189, 102–105. [DOI] [PubMed] [Google Scholar]
Associated Data
This section collects any data citations, data availability statements, or supplementary materials included in this article.
Supplementary Materials
As a service to our authors and readers, this journal provides supporting information supplied by the authors. Such materials are peer reviewed and may be re‐organized for online delivery, but are not copy‐edited or typeset. Technical support issues arising from supporting information (other than missing files) should be addressed to the authors.
Supporting Information
Data Availability Statement
The data that support the findings of this study are openly available in Figshare at https://doi.org/10.48420/19583323, reference number 19583323.


