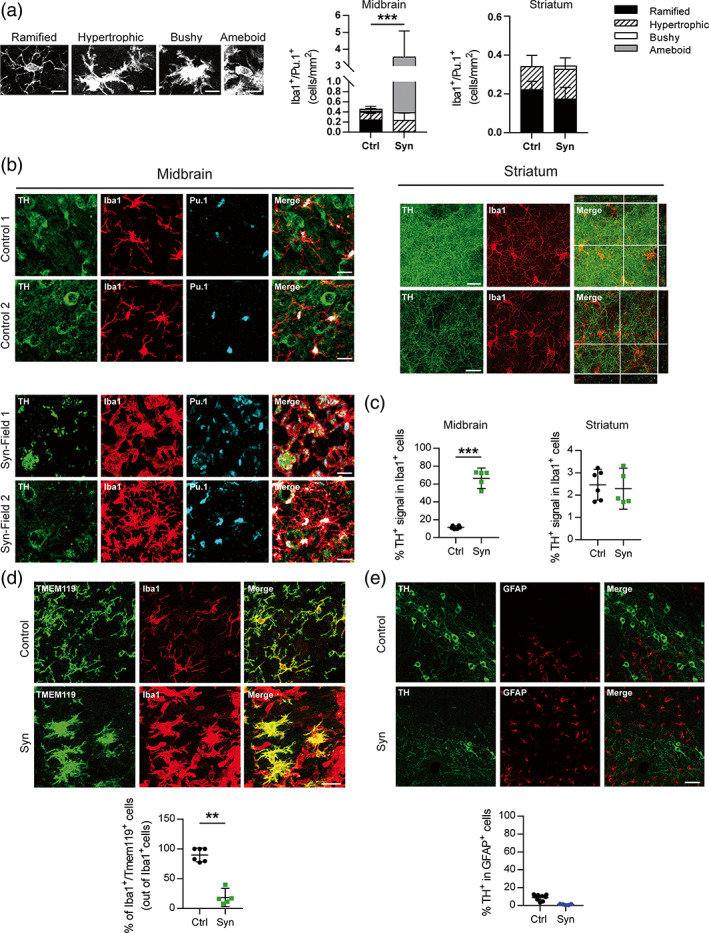
FIGURE 5.

Morphological and phagocytic analysis of glial cells from the striatum and the midbrain. Animals were perfused at 2 weeks after AAV9 administration by stereotaxic surgery in the SNpc (a) Four types of morphology were identified and quantified for Iba1+/Pu.1+ cells in the midbrain and striatum of control and αSyn mice: Ramified, hypertrophic, bushy, and amoeboid. Ramified microglia are characterized by long, thin processes and a small cell body. Hypertrophic morphology is characterized by long, thicker processes and a bigger cell body. Bushy microglia have a big cell body and short processes. Amoeboid microglia have a macrophage‐like morphology with few or no processes. (b) Representative images of TH/Iba1/Pu.1 immunofluorescence staining in the midbrain and striatum of control and αSyn mice. (c) Percentage of TH+ signal in Iba1+ cells. (d) Representative images of Tmem119/Iba1 immunofluorescence staining in the midbrain of control and αSyn overexpressing mice and percentage of Iba1+/Tmem119+ cells out of total Iba1+ cells. (e) Representative images of TH/GFAP immunofluorescence staining in the midbrain of control and αSyn mice and percentage of TH+ signal in GFAP+ cells. The data represent the mean ± 95% CI from 5 to 6 animals per group. Statistical analysis: (a) t‐test, (c) Welch's t‐test (d) t‐test. **p < .01, ***p < .001. Magnification bars: (a) 10 μm, (b and d) 20 μm, (e) 50 μm
