

Abstract
High current density reaching 1 A cm−2 for efficient oxygen evolution reaction (OER) was demonstrated by interactively optimizing electrolyte and electrode at non‐extreme pH levels. Careful electrolyte assessment revealed that the state‐of‐the‐art nickel‐iron oxide electrocatalyst in alkaline solution maintained its high OER performance with a small Tafel slope in K‐carbonate solution at pH 10.5 at 353 K. The OER performance was improved when Cu or Au was introduced into the FeO x ‐modified nanostructured Ni electrode as the third element during the preparation of electrode by electrodeposition. The resultant OER achieved 1 A cm−2 at 1.53 V vs. reversible hydrogen electrode (RHE) stably for 90 h, comparable to those in extreme alkaline conditions. Constant Tafel slopes, apparent activation energy, and the same signatures from operando X‐ray absorption spectroscopy among these samples suggested that this improvement seems solely correlated with enhanced electrochemical surface area caused by adding the third element.
Keywords: electrocatalysis, electrochemistry, high current density, nickel-iron oxide, oxygen evolution reaction
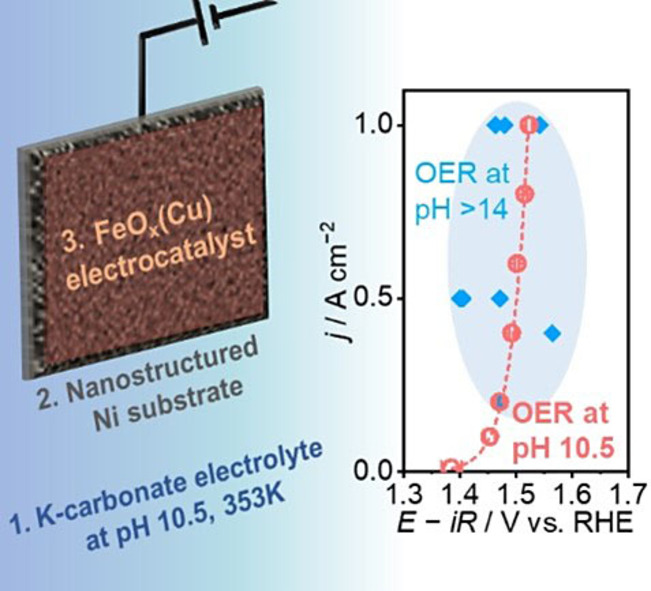
No need for extremes: Concurrent engineering of electrolyte, substrate, and electrocatalyst enables highly efficient non‐extreme pH oxygen evolution reaction at a rate of 1 A cm−2 using Ni‐ and Fe‐based electrodes, whose performance is comparable to those in extreme alkaline pH conditions.
Introduction
Renewable electricity plays a pivotal role in realizing a sustainable society, and electrocatalytic water splitting technologies can convert the ubiquitous H2O into H2.[ 1 , 2 , 3 ] However, anodic oxygen evolution reaction (OER) requires large overpotential and thus causes significant efficiency loss.[ 3 , 4 ] Accordingly, the development of active electrocatalysts for the OER is highly desired to facilitate the deployment of renewable‐electricity‐driven electrocatalytic systems on a large scale. In past studies, a variety of materials have been examined as OER electrocatalysts in acidic or alkaline pH environments, including noble metal‐based oxides,[ 3 , 5 , 6 ] Earth‐abundant transition metal oxides and (oxy)hydroxide,[ 7 , 8 , 9 ] and perovskite‐type oxides.[ 10 , 11 ] Among them, ruthenium‐ or iridium‐based electrocatalysts possess high catalytic activity, especially in acidic environments,[ 3 , 4 ] thus being used to catalyze the OER at the current density on the order of A cm−2. [2] However, utilization of these noble metals increases the system cost of electrolyzers, which necessitates the development of electrocatalysts based on earth‐abundant elements.
Mixed nickel and iron oxides (NiFeO x ) have been reported to be among the most active cost‐efficient OER catalysts in alkaline pH conditions.[ 4 , 7 , 12 , 13 ] Trotochaud et al. reported the enhanced OER activity of Ni(OH)2/NiOOH thin film during cyclic voltammetry (CVs) in iron‐containing KOH electrolyte, where incorporated Fe species improved the film conductivity and likely exerted a partial‐charge‐transfer activation effect on Ni. [14] On the other hand, Bell and co‐workers proposed the active Fe3+ sites within γ‐Ni1−x Fe x OOH based on their operando X‐ray absorption spectroscopy (XAS) analysis and density‐functional theory calculations with the Hubbard U correction (DFT+U). [15] A theoretical study by Martirez and Carter also supports the active Fe site, whose reaction pathway, however, involved more oxidized Fe4+. [16] Chen et al. experimentally observed this Fe4+ using the operando Mössbauer spectroscopy and concluded that Fe4+ species were not directly responsible for the catalytic activity. [17] While the catalytic mechanism of NiFeO x remains still under discussion, it is commonly agreed that the coexistence of Ni and Fe is required to achieve the high catalytic activity. Building upon these intensive studies on NiFeO x , recent studies incorporated other metals into NiFeO x to improve the OER activity. [7] Li et al. added V into NiFe layered double hydroxide (LDH) and ascribed its high activity to the modified electronic structure on the Fe site with DFT+U calculation. [18] Sargent and co‐workers introduced high‐valence transition metals such as Mo and W into NiFe to increase the ratio of low‐valence Fe, which facilitated Ni redox cycling and thus improved OER performance. [19] Bates et al. investigated the Ni−Fe‐Co mixed‐metal oxide. Added Co facilitated the formation of the conductive NiIIIOOH host lattice and shrank the local geometry of Ni and Fe, both of which activated Fe sites and enhanced the OER performance. [20] Similarly, other elements, including Cr, [21] Mn, [22] Mg, [23] and Ce, [24] were introduced into NiFeO x to tailor the electronic structure of Ni or Fe sites, demonstrating the successful strategy of multicomponent electrodes for the OER.
While plentiful studies of the OER focused on extreme pH conditions, non‐extreme pH medium has gained increasing attention. Non‐extreme pH conditions can maintain high carbon efficiency during CO2 electrolysis. CO2 electrolysis at alkaline pH levels suffers from the formation of (bi)carbonate ion (HCO3 −, CO3 2−) from CO2 with OH−, [25] which can readily be circumvented by the aqueous non‐extreme pH electrolyte. Note that CO2 electrolysis also employs the OER on the anode side; thus, improvement of OER at non‐extreme pH is crucial for large‐scale deployment of CO2 electrolyzer. [26] From a different point of view, non‐extreme pH can mitigate the corrosiveness and avoid using expensive corrosion‐tolerant materials in electrolyzers, [27] which can reduce electrolyzer cost and in the end hydrogen cost produced by water electrolysis. [28] Furthermore, it avoids the risk of chemical burns on the human body generally occurring at pH below 2 or above 11.5. [29] Notwithstanding these benefits, non‐extreme pH electrolysis has suffered inferior performance to those in extreme pH conditions,[ 27 , 30 ] which hinders its use in large‐scale electrocatalytic processes.
While the OER in alkaline pH conditions proceeds via the kinetically favorable oxidation of OH−, the OER in non‐extreme pH easily leads to reactant switching to H2O due to the small activity of available OH− when reaching appreciable reaction rates. [31] To mitigate the acidic pH shift during the OER, buffering species is essential, as previously reported.[ 32 , 33 , 34 ] The buffering capability is maximized when the solution is prepared close to the pK a value in pH,[ 33 , 34 ] with sufficient concentrations. [31] Furthermore, OER in buffered non‐extreme pH conditions exhibited larger temperature sensitivity than that in alkaline electrolyte, and thus became comparable with alkaline one at elevated temperatures. [34] However, most previous studies regarding the OER at non‐extreme pH focused on only low current densities (e. g., 10 mA cm−2) and room temperature,[ 35 , 36 ] being far from the practical current density.[ 1 , 37 ] To develop the electrocatalysts functioning under the industrially‐relevant productivity, OER performance should be evaluated at current densities on the order of A cm−2.
The present study reports the OER catalyzed by nickel‐ and iron‐based electrocatalysts in carbonate buffer electrolyte at non‐extreme pH via concurrent investigation of electrolyte and electrode. Our electrolyte engineering pinned down an electrolyte condition that allowed for the stable behavior and small Tafel slope of NiFeO x . In the identified electrolyte condition, nickel‐ and iron‐based electrode was developed as an active OER electrocatalyst by a sound electrochemical route, and the addition of the third element of gold or copper to it was demonstrated to improve the performance. Electrochemical and operando spectroscopic studies elucidated the origin of its performance. The findings presented in this study highlight the significance of electrolyte engineering, paving the way for developing highly efficient electrolysis systems at non‐extreme pH.
Results and Discussion
Electrolyte engineering stabilizing electrocatalyst at non‐extreme pH
This study began with determining the suitable electrolyte condition for stable OER operation. Electrolyte engineering, namely optimization of identity and molality of buffer species, drastically impacts electrocatalytic performance.[ 31 , 34 ] When the K‐carbonate solution was >1.0 mol kg−1, anodic current densities became higher than those in a dilute solution of 0.1 mol kg−1 in Figure 1a, due to the reduced concentration overpotential and facilitated buffering action, as observed for phosphate buffers;[ 31 , 34 ] nevertheless, the molality of 0.1 mol kg−1 has been often used in the previous OER studies.[ 35 , 36 ] Knowing this result, the molarity of 1.5 mol kg−1 is chosen for further investigation.
Figure 1.

Determination of the suitable electrolyte condition using NiFeO x /Pristine‐Ni foam. (a) LSV profiles in 0.1, 1.0, 1.5, and 2.5 mol kg−1 K‐carbonate solution at pH 10.5 at a scan rate of −1 mV s−1 and reaction temperature of 298 K. (b) Electrode potential reaching +10 mA cm−2 before/after 50 cycles CV at 1 mV s−1, obtained from LSV profiles recorded in 1.5 mol kg−1 buffered solutions at −1 mV s−1, 298 K (Figure S1). (c) Tafel slope and (d) exchange current density j 0 in 1.5 mol kg−1 buffered solutions, and KOH solution, obtained from Tafel analysis in the range of current density of 5–100 mA cm−2 at 298 K (Figure S2). pK a value of each buffer (carbonate: 10.3, borate: 9.2, phosphate: 12.4) is highlighted in (c) and (d). (e) LSV profiles in 1.5 mol kg−1 K‐carbonate at pH 10.5 and KOH at pH 14 at −1 mV s−1, 298 and 353 K.
In general, nickel and iron species favor dissolving in the absence of appreciable OH− activity, according to the Pourbaix diagrams.[ 38 , 39 ] The origin of the electrolyte‐dependent stability can be majorly attributed to bulk pH level, followed by distinct concentrations of OH− in the vicinity of electrode surface during the OER. The local pH shift by the reaction is minimized when pH corresponds to the buffer pK a. [40] To identify the threshold of suitable electrolyte conditions, CV was recorded in buffered solutions at varying pH levels using the conventional NiFeO x prepared by hydrothermal synthesis. [41] Figure 1b summarizes electrode potentials in carbonates, borates, and phosphates at different pH values at 10 mA cm−2 at the 1st and 50th cycle [see Figure S1 for linear sweep voltammetry (LSV) profiles]. While the anodic current densities ascribable to the OER remained identical at pH 10.5 (pK a 10.3), a decrease of pH to 9.5 led to a decrease of current density above 1.5 V vs. reversible hydrogen electrode (RHE) after 50 cycles, indicating the threshold to stably utilize NiFeO x in carbonate solutions. The potential remained almost constant in K‐borate solutions even at pH 9.2, as previously reported. [42] Using phosphate buffer caused the potential increase even at pH 7.2 and 10.5. Overall, degradation of NiFeO x in phosphate at pH 7.2 (=pK a) should occur due to the too acidic bulk pH. The OER operations in carbonate (pH 9.5) and phosphate (pH 10.5) solutions, which are away from the buffer pK a (carbonate: 10.3, phosphate: 12.4, 7.2), [43] had increased potential due to insufficient buffering capacity (Figure 1b). Literature proposed that borate species [H3BO3 and B(OH)4 −] adsorbs on the oxide surface by coordinating with the metal centers, as proposed on nickel or iron oxide surface,[ 44 , 45 ] or the formation of nickel‐borate complex oxide proposed by Nocera and co‐workers, [46] which can impede metal dissolution and prevent electrode degradation.
Buffer identity and electrolyte pH also affect the OER kinetics on the NiFeO x electrode. Figure 1c,d summarizes the Tafel slope and (apparent) exchange current density (j 0) in various electrolyte conditions, determined by Tafel analysis in the current density range of 5–100 mA cm−2 (Figure S2) according to Equation 1: [47]
| (1) |
The Tafel slope theoretically varies with the OER intermediate coverage even when the rate‐determining step is identical. [48] In the carbonate solutions, the Tafel slope became the minimum of 83±4 mV dec−1 at pH 10.5, consistent with the theoretical prediction considering buffer capacity and surface adsorbate to provide the smallest Tafel slope at pH close to buffer pK a by Dau and Pasquini. [40] The slope value again decreased at greater pH levels and reached 43 mV dec−1 at pH 14.0, which quantitatively coincided with the values in KOH and those in literature.[ 41 , 49 ] In contrast, the slope value in the borate solution was found not to be minimum at pH 9.2 (=pK a) but at pH 10.5 (91±1 mV dec−1), indicating the participation of borate species in the OER mechanism. [46] The degree of Ni‐borate complex oxide formation varies with the pH‐dependent buffer fraction and thus influences the Tafel slope.[ 43 , 46 ] The use of phosphate electrolyte made the large slope value at pH 10.5, but it decreased to 83 mV dec−1 at pH 13, which was smaller than carbonate and borate counterparts. The larger slope values in carbonate and borate solutions at pH 13 likely originated from insufficient buffering capacity and negative influences of the fractions of B(OH)4 − and CO3 2−, which are proposed to be stronger adsorbates.[ 46 , 50 ] While phosphate anions such as HPO4 2− and PO4 3− also adsorb on the electrode surface, [51] its buffering capacity was probably high enough to allow the small slope value due to its pK a (12.4) being close to the pH (13.0).
Interestingly, the exchange current density j 0 was in a trade‐off relationship with the Tafel slope (Figure 1d). This relationship indicates that j 0 varies with the rate expression of the OER that depends on the Tafel slope. [48] However, within the difference in j 0, the smaller Tafel slope is more effective at lowering overpotential at high current densities (ca. >25 mA cm−2, Figure S2), consistent with the literature. [34] From this point of view, carbonate solution at pH 10.5 is suitable for achieving high OER performance at high current densities.
This study further elucidates the impact of reaction temperature on the OER performance, which drastically influences diffusion coefficient D and standard rate constant k 0 that is described by the Stokes–Einstein equation [52] [Eq. (2)] and Arrhenius’ equation [47] [Eq. (3)], respectively:
| (2) |
| (3) |
where k is the Boltzmann constant, d is the effective diameter of the hydrated ion, μ is the viscosity of the solution, A' is the pre‐exponential factor in Arrhenius’ equation, E a,app is the apparent activation energy, R is the gas constant, and T is the absolute temperature. These equations predict facilitated ion diffusion and electrode surface reaction by increasing temperature. Figure 1e shows that the difference in overpotential at, for example, 30 mA cm−2 between buffered K‐carbonate and KOH solutions decreased from 151 to 18 mV by elevating the temperature from 298 to 353 K, indicating that the OER performance in the carbonate solutions can be relatively comparable to the alkaline ones at the industrially relevant temperatures. The larger decrease in the overpotential in K‐carbonate solution with the temperature is ascribable to a larger E a,app than the alkaline pH counterpart (see below). Note that higher current densities in the K‐carbonate solution than in the KOH solution at 353 K below 1.41 V vs. RHE originated from the larger j 0, which, however, became reversed above 1.41 V vs. RHE due to the larger Tafel slope in K‐carbonate solution, as shown in Figure S3 and Table S1. The distinct j 0 and Tafel slope likely originate from the distinct surface coverage of OER intermediates because such kinetic parameters can vary with the change of intermediate coverage even when the rate‐determining step is identical, [48] as reported over iridium oxide electrode. [53] These results highlight that investigating at high temperatures is important for practical application. Based on these electrolyte engineering data, the electrolyte condition of 1.5 mol kg−1 K‐carbonate solution at pH 10.5 and 353 K was selected and used in the subsequent electrocatalytic testing.
Nanostructured Ni‐ and Fe‐based electrodes achieved efficient OER at non‐extreme pH
Three‐dimensionally structured Ni foam is one of the most commonly used substrates due to its large surface area. The Ni foam was, in a previous study, electrochemically activated in K‐carbonate solution to develop nanostructure on the surface and enlarge its surface area. [54] Following that report, this study employed the electrochemically activated Ni foam (ECA−Ni) as the substrate (see Figure S4 for the activation protocol). Figure 2a,b shows the scanning electron microscopy (SEM) images of Pristine‐ and ECA−Ni foam, respectively, which revealed the rougher and flake‐like morphology of ECA−Ni foam. For quantitative evaluation of the electrochemically active surface area, the double‐layer capacitance (C dl) was determined in Figure 2c based on CVs (Figure S5). The ECA−Ni foam showed the C dl of 1.9±0.2 mF cm−2, nearly twice that of 1.1±0.2 mF cm−2 on Pristine‐Ni foam, demonstrating the enlarged surface area by electrochemical activation.
Figure 2.

Characterization and OER performance comparison of electrodes. SEM images of (a) Pristine‐ and (b) ECA−Ni foam. (c) C dl of each substrate obtained at 0.60 V vs. RHE on CV (Figure S5). (d) Current densities at 1.47 V vs. RHE over electrocatalysts deposited on Pristine‐ and ECA−Ni foam. Current densities were calculated from Tafel analysis in the range of current density of 5–100 mA cm−2 (Figure S6). (e) Relationship between the ratio of C dl and the ratio of current density over electrocatalyst‐modified Pristine‐ and ECA−Ni foam. C dl values obtained at 0.60 V vs. RHE on CV (Figure S7) and current densities in (d) were used to calculate the ratio, respectively. The arrow indicates the ratio of C dl over Ni substrates in (c). (f) Relationship between Tafel slope and j 0 of each electrode, obtained from Tafel analysis in Figure S6. Electrochemical tests were performed in 1.5 mol kg−1 K‐carbonate solution at pH 10.5 and 353 K.
Using Pristine‐ or ECA−Ni foam as the substrate, electrodes with MnO x , FeO x , CoO x , or CuO x electrocatalysts were first fabricated by cathodic electrochemical deposition (see Figure S6 for electrocatalytic testing). Figure 2d shows current densities at 1.47 V vs. RHE, where all electrocatalysts showed higher current densities when ECA−Ni foam was used as the substrate. Importantly, C dl values on electrocatalyst‐modified ECA−Ni foam were 1.8 times larger than those on Pristine‐Ni foam (Figure 2e), and this ratio coincided with the substrate C dl ratio of ECA−Ni to Pristine‐Ni foams as shown in Figure 2d (see Figure S7 for C dl determination), revealing that the enlarged surface area on ECA−Ni foam remained even after the deposition of electrocatalysts. In addition, the current densities over MnO x , CoO x , and CuO x on ECA−Ni foam were around 1.8 times greater than those on Pristine‐Ni foam. This result indicates that the larger current densities originated from the roughened surface of the ECA−Ni foam substrate rather than the tailored nature of the active site. In the case of FeO x , the current density ratio was 1.4, being slightly lower than 1.8. The discrepancy likely originated from the slightly distinct kinetics between over ECA‐ and Pristine‐Ni substrates suggested by the slight shift of Tafel slope (Figure S6). Among the fabricated electrodes, FeO x /ECA−Ni exhibited the highest current density of 100 mA cm−2 at the fixed potential (Figure 2d). Figure 2f summarizes the Tafel slope and j 0 determined by the Tafel plots in Figure S6. While FeO x /ECA−Ni showed the smallest j 0, it also exhibited the smallest value of Tafel slope that contributed to the highest current density in Figure 2d. It is concluded that the combination of nanostructured ECA−Ni foam substrate and Fe‐containing electrocatalyst is promising to facilitate the OER in K‐carbonate solution at pH 10.5.
The introduction of the group 11 elements is tested to further improve the performance of FeO x /ECA−Ni introduced by cathodic co‐electrodeposition. The molar ratio of the third element to iron was targeted to be 1. Figures S8–S11 show the characterization data on as‐prepared electrodes. SEM and energy‐dispersive X‐ray spectroscopy (EDS) unraveled the coexistence of Fe and group 11 element, while areas rich with the third element were apparent, and some Ni substrate surface was found to be exposed. X‐ray diffraction (XRD) profiles showed patterns compatible with metallic Fe, Ag, and Au on the electrodes of FeO x , FeO x (Ag), and FeO x (Au), respectively. In contrast, no pattern other than metallic Ni derived from the Ni substrate was observed on FeO x (Cu), indicating the amorphous structure of Fe and Cu species in FeO x (Cu).
Figure 3a summarizes OER performances over a series of the developed Fe‐based electrocatalysts on the ECA−Ni foam. As a figure of merit, potentials at industrially relevant 1 A cm−2 were adopted in the same order as that in proton exchange membrane electrolyzer (>1.0 A cm−2).[ 1 , 55 ] The FeO x ‐modified ECA−Ni foam reached 1 A cm−2 at a potential of 1.54 V vs. RHE, being superior to the previously reported NiFeO x ‐based electrodes (Figure S12). The OER rate over the FeO x /ECA−Ni was substantially enhanced when modified with third elements. The potential reaching 1 A cm−2 was merely 1.52 or 1.51 V vs. RHE over Cu‐ or Au‐modified electrodes, respectively, with almost unity Faradaic efficiency to O2 (see Figure S13).
Figure 3.

OER performance over Fe‐based electrocatalysts on ECA−Ni foam. (a) Electrode potentials reaching +1 A cm−2 and Tafel slope in the range of current density of 10–1000 mA cm−2. (b) Relationship between C dl and current densities at 1.51 V vs. RHE. C dl were obtained at 0.60 V vs. RHE on CV (Figures S5, S7, and S16). Current densities were calculated from Tafel analysis (Figure S15). Dashed line represents a fixed specific current density. (c) LSV profiles at −1 mV s−1. (d) Arrhenius plot of the OER over ECA−Ni electrodes. The j 0 values were obtained from Tafel plot (Figure S18). (e) Current‐potential relationship over FeO x (Au)/ECA−Ni and FeO x (Cu)/ECA−Ni compared with reported performances in extremely alkaline conditions at 333–358 K,[ 19 , 63 , 64 , 65 , 66 , 67 , 68 , 69 ] where dashed line is current–potential curves calculated from Tafel analysis (Figure S15). (f) Potential profile during stability test over FeO x (Cu)/ECA−Ni, obtained by periodic CP at 1 A cm−2 for 10 h (On) with an interval of 1 h open‐circuit condition (Off). The solution was replaced with a fresh one sometimes because of the decrease in the amount of aqueous solution due to evaporation or/and consumption of water. All the electrochemical tests were conducted in 1.5 mol kg−1 K‐carbonate solution at pH 10.5 and 353 K, except for data of FeO x (Au) electrode in (e) that was obtained in KOH solution at pH 14.
Figure 3a also addresses Tafel slope of each electrode (see Figures S14 and S15 for comparison with previously reported electrocatalysts and Tafel plots, respectively), which revealed a slope value of 69±8 mV dec−1 over the FeO x /ECA−Ni. Notably, this Tafel slope value remained almost unchanged even after adding Cu or Au at values of 68±7 mV dec−1 or 71±4 mV dec−1, respectively. This result implies that the enhanced OER performance by adding Cu and Au originates from factors other than the altered kinetic mechanism or nature of active sites, even though most previous studies regarding NiFeO x with third elements attributed the performance enhancement to such factors.[ 7 , 18 , 19 , 20 , 21 , 22 , 23 , 24 ]
To clarify the origin of the improved performance by adding the third element, Figure 3b plots the current densities at 1.51 V vs. RHE as a function of C dl (see Figures S5, S7, and S16 for C dl determination). The figure reveals that over Fe‐based catalyst modified ECA−Ni electrodes, the OER rates almost proportionally increased with C dl. Although the values of C dl were determined at non‐OER potentials and we failed to experimentally determine those after the OER due to the faradaic currents in the CV, this linear correlation indicates that the increase in the current density upon the addition of the third element likely originated from the enlarged surface area of the electrode. This increase in current density by adding group 11 elements was not limited to a certain range of current density shown in Figures 3a and b because LSV profiles at tens of mA cm−2 scale (Figure 3c) showed onset potential shift to lower values and the higher current density when the third element was introduced into FeO x . Onset potential shift by adding group 11 elements likely originated from (1) the increased j 0 in Equation (1) due to the enlarged surface area, [47] and/or (2) the improved active site nature as proposed in literature on third element‐modified NiFeO x .[ 7 , 18 , 19 , 20 , 21 , 22 , 23 , 24 ] Nevertheless, the identical Tafel slope in Figure 3a and linear correlation in Figure 3b suggest that enlarged surface area dominantly affected the OER performance at high current densities targeted in this study.
The idea that adding the third element enlarged electrochemically active surface area can be rationalized considering the previously reported Fe adsorption on group 11 elements under the OER potential,[ 56 , 57 , 58 ] which can increase the Fe site density over electrode surfaces. It should be noticed that, while the total Fe amount on FeO x electrode was larger than those on FeO x (Cu) and FeO x (Au) revealed by inductively coupled plasma (ICP) analysis (Figure S17), the number of electrochemically active Fe site could be larger in the presence of Cu or Au element because only Fe site in direct contact with the conductive host elements is OER‐active due to its poor conductivity[ 59 , 60 ] and Cu or Au was reported to act as such a host element.[ 56 , 58 ] Consistently, the analysis of apparent activation energy (E a,app) for the OER supported the above consideration. Figure 3d shows Arrhenius plots over the ECA−Ni electrodes (see Figure S18 for Tafel plots). E a,app over the FeO x /ECA−Ni was 88 kJ mol−1, substantially higher than that of 25 kJ mol−1 over NiFeO x in 1.0 m NaOH solution, [61] and the addition of Cu or Au did not apparently change this E a,app; for example, 82 or 77 kJ mol−1, respectively. Similar values of E a,app observed over ECA−Ni electrodes indicate almost identical active site and reaction mechanism over these electrodes, consistent with the discussion on the Tafel slope. The data of ECA−Ni without additional elements in Figure 3b deviated from the linear relationship observed for Fe‐containing ECA−Ni electrodes, while the C dl of ECA−Ni with and without FeO x was similar, indicating that iron species would most likely act as the active site over Fe‐containing ECA−Ni electrodes. The addition of Ag to the FeO x did not substantially change OER performance and increased Tafel slope, likely due to the dissolution of silver at OER potentials, as suggested by its substantial loss from EDS and XRD analysis (Figure S10).
Our rationalization herein of iron species being solely responsible for the OER activity contrasts with a recent study that claims over Au/NiFeO x electrode; the OER would proceed via direct O−O coupling at the heterointerface between Au and NiFeO x . [62] While such heterointerface may exist even in the present study due to Au remaining on the post‐OER electrode confirmed by ICP analysis (Figure S17), this discrepancy likely arose from the range of current densities in interest; claimed direct O−O coupling mechanism would not catch up with the rate of hundreds of mA cm−2, and therefore the OER proceeded without the kinetical involvement of Au.
Figure 3e shows the current‐potential relationship over the developed FeO x (Au)/ECA−Ni and FeO x (Cu)/ECA−Ni electrodes, in which reported performances of alkaline OER at 333–358 K[ 19 , 63 , 64 , 65 , 66 , 67 , 68 , 69 ] are also plotted for comparison. Over the best FeO x (Au) electrode, alkaline OER at 1 A cm−2 was achieved merely at 1.46 V vs. RHE, whose performance was superior to those reported at the same current density. Its OER performance compares favorably with those in extremely alkaline pH conditions even at pH 10.5 with carbonate buffer. Notably, the FeO x (Cu) electrode performance was also comparable to the reported alkaline OER. Since FeO x (Cu) is more attractive because of the lower cost of Cu than Au, this electrode was employed for the following investigation.
Figure 3f shows the potential profile over the FeO x (Cu)/ECA−Ni during the stability test with 1 h open‐circuit condition for each 10 h operation at 1 A cm−2, where iR‐correction employed series resistance values right after each 1 A cm−2 operation. Note that some noises and increases in potential observed in Figure 3f are likely caused by gas bubble formation because of the high rate of O2 evolution. [70] Our testing disclosed that 1.53 V vs. RHE was sufficient to reach 1 A cm−2 for the intermittent operation of >60 h, and the overpotential increased by merely around 40 mV after 90 h running. Such a stable behavior was also observed on FeO x (Au)/ECA−Ni foam (Figure S19). The developed electrodes possessed high activity and stability at high current densities and reaction temperatures at pH 10.5.
Characterizations of electrodes were performed to address the origin of their OER performance. Transmission electron microscopy (TEM) images of FeO x (Cu) in Figure S20 revealed the presence of nanometric particles on the post‐OER surface, which was polycrystalline according to selected‐area electron diffraction (SAED) patterns. Since the XRD profile of FeO x (Cu) showed only patterns compatible with metallic Ni that the Ni substrate contained (Figure S9), such nano‐sized polycrystalline particles exist only near the electrode surface. SEM‐EDS images with high magnification revealed the surface change during the OER (Figure S21). The grain‐like morphology on as‐made FeO x (Cu)/ECA−Ni turned into a sharp and flake‐like one after the OER. Indeed, some area on the as‐made electrode lacked Cu and Fe, indicating the localization of these metal elements to some extent. However, Cu and Fe were uniformly observed on the post‐OER electrode, indicating surface reconstruction during the OER.
The local structure characteristics were investigated by X‐ray absorption near‐edge structure (XANES) and extended X‐ray absorption fine structure (EXAFS) analysis using ECA−Ni felt substrates. Figure 4a shows Cu K‐edge XANES spectrum of post‐reaction FeO x (Cu) electrode, which was analyzed at open‐circuit in 1.5 mol kg−1 K‐carbonate solution at 298 K. The peak of Cu K‐edge observed on FeO x (Cu) electrode implies the presence of Cu species within the electrode even after the OER, consistent with the EDS and ICP analysis (Figures S9 and S17). In addition, the white‐line of the FeO x (Cu) electrode was distinct from CuO and Cu2O but like Cu(OH)2, indicating the existence of a Cu(OH)2‐like structure around the Cu center. Figure 4b compares XANES spectra of Fe K‐edge over FeO x and FeO x (Cu) electrodes, revealing that the white‐lines of FeO x and FeO x (Cu) at open circuit potential were similar to those of γ‐Fe2O3 and γ‐FeOOH, respectively. These observations were consistent with ex situ X‐ray photoelectron spectroscopy (XPS) analysis on post‐OER electrodes (Figure S22). Besides, the γ‐FeOOH‐like structure in FeO x (Cu) was also suggested by local structure‐sensitive EXAFS analysis in both k and R space (Figure 4c,d), in which its Fe K‐edge peaks in both k and R space are similar to those of γ‐FeOOH. When the anodic potential was applied to catalyze the OER, the operando XANES spectra of FeO x (Cu) slightly changed in intensity yet without any clear shift of peak positions (Figure 4b), while the peak positions in k space EXAFS spectra remained almost identical (Figure 4c). These spectra, therefore, indicate the stable γ‐FeOOH‐like structure around the Fe center even at the OER potential, which indicates that the local structure around Fe sites within FeO x (Cu) is similar to that of conventional NiFeO x .[ 15 , 71 ] This rationale is also consistent with the discussion in Figure 3, which concluded that the performance increment upon adding group 11 elements originates from the enlarged surface area, especially at the high current density region.
Figure 4.

X‐ray spectroscopy analysis. (a) Cu K‐edge and (b) Fe K‐edge XANES spectra over FeO x or FeO x (Cu)/ECA−Ni at open‐circuit potential, obtained after the OER test. (c) k 3 ‐weighted Fe K‐edge EXAFS spectra for FeO x (Cu)/ECA−Ni corresponding to (b). (d) Magnitudes of the Fourier‐transformed Fe K‐edge EXAFS spectra for FeO x (Cu)/ECA−Ni and γ‐FeOOH corresponding to (b). Operando XANES or EXAFS spectra for FeO x (Cu)/ECA−Ni were measured at 1.5 V vs. RHE. All the measurements were conducted using Ni felt substrate in 1.5 mol kg−1 K‐carbonate solution at pH 10.5 and 298 K.
Conclusion
As a result, oxygen evolution reaction (OER) reaching 1 A cm−2 was demonstrated in carbonate buffer solution at non‐extreme pH using Ni and Fe‐based electrodes. Electrolyte conditioning in this study achieved stable OER operation with a small Tafel slope in K‐carbonate solution at pH 10.5 and 1.5 mol kg−1. This condition allows the active FeO x to endure under thermodynamically harsh OER kinetic conditions. Further modification of the electrode with Cu, Ag, or Au introduction into FeO x was found to further improve the OER performance. Remarkably, electrodes of FeO x (Cu) or (Au)/ECA−Ni foam achieved 1 A cm−2 at around 1.53 V vs. reversible hydrogen electrode stably for 90 h, comparable to the performances in extremely alkaline pH conditions. The addition of the third element increased the double‐layer capacitance but did not change the Tafel slope and apparent activation energy. X‐ray absorption characterization pointed to a stable γ‐FeOOH‐like structure in FeO x (Cu), which was similar to the local structure of conventional NiFeO x . All of these results suggest that the improved performance coherently originated from the enlarged surface area of the electrode. The findings reported in the present study reveal the significance of concurrent engineering of electrolyte and electrode, which enables highly efficient OER at non‐extreme pH whose performance was comparable to alkaline ones, demonstrating the potential of non‐extreme pH electrolyzers in industrial applications.
Experimental Section
NiFeO x electrodes were prepared by the hydrothermal [41] or precipitation [72] synthesis following a previous recipe. Before the synthesis, Ni foam with a geometric size of 1×1 cm2 was washed by immersing in 0.1 mol kg−1 HCl, ultrapure water, and ethanol sequentially for 5 min each. Regarding the hydrothermal synthesis, washed Ni foam was transferred to a 190 mL Teflon‐lined stainless‐steel autoclave together with 152 mL of solution containing 1.9 mmol of Ni(NO3)2 ⋅ 6H2O, 1.9 mmol of Fe(NO3)3 ⋅ 9H2O, and 9.5 mmol of CO(NH2)2. These were heated at 393 K for 12 h. The autoclave was then naturally cooled to room temperature. [41] The precipitation synthesis began by immersing the Ni foam in 60 mL of ethanol containing 0.814 mmol of FeCl3 ⋅ 6H2O for 12 h. Subsequently, the Ni foam was immersed in 60 mL of ethanol containing 0.814 mmol of FeCl3 ⋅ 6H2O and 4.46 mmol NH4HCO3 for 6 h under stirring. Finally, the substrate was taken out and washed with ultrapure water several times. [72]
Electrochemical activation of Ni substrate was conducted following a reported protocol. [54] Prior to the activation, Ni substrate was washed with ethanol and ultrapure water several times and immediately used. The electrochemical activation was conducted in 1.5 mol kg−1 K‐carbonate at pH 10.5 and 340 K with O2 (99.99995 %) bubbling using a three‐electrode configuration with Pt wire (Nilaco) and Hg/Hg2Cl2 (saturated with KCl) as the counter and reference electrodes, respectively. Electrochemical cell setup employed at elevated temperatures is described in the experimental section in the Supporting Information. After immersing the Ni substrate in the electrolyte. open circuit potential (OC) for 20 min followed by chronopotentiometry (CP) at +50 mA cm−2 for 25 min was repeated three times. Subsequently, chronoamperometry (CA) at 1.0 V vs. RHE for 10 min followed by CP at +50 mA cm−2 for 25 min was repeated twice, as shown in Figure S4. After the electrochemical activation, the substrate was taken out and washed with ultrapure water several times. It should be noticed that the CV and Tafel plot of electrochemically activated Ni foam obtained in this study well‐reproduced those in the original literature [54] (Figure S4). The thus obtained Ni foam is named hereafter as ECA−Ni foam.
MnO x , FeO x , CoO x , and CuO x electrocatalysts were prepared by electrochemical deposition on Pristine‐Ni or ECA−Ni substrates. The deposition baths for MnO x , FeO x , CoO x , and CuO x contain 0.1 m of Mn(NO3)2 ⋅ 6H2O, 5 mm of Fe(NO3)3 ⋅ 9H2O, 0.1 m of Co(NO3)2 ⋅ 6H2O, and 5 mm of Cu(NO3)2 ⋅ 3H2O, respectively. Prior to the deposition, Pristine‐Ni or ECA−Ni substrates were washed with ultrapure water several times. The electrochemical deposition was conducted using a three‐electrode configuration with Pt wire (Nilaco) and Hg/Hg2Cl2 (saturated with KCl) as the counter and reference electrodes, respectively. MnO x , FeO x , CoO x , or CuO x was deposited onto the Ni substrate by immersing the substrate in the prepared deposition bath and immediately applying a constant current density of −10 mA cm−2 for 1 h at room temperature. Immediately after the electrochemical deposition, the substrate was taken out and washed with ultrapure water several times.
FeO x (M) (M=Cu, Ag, or Au) electrocatalysts were prepared by co‐electrochemical deposition of Fe and third metal species on ECA−Ni substrate. The deposition bath for each electrocatalyst contains 5 mm of Fe(NO3)3 ⋅ 9H2O with 5 mm of third metal precursor, that is, Cu(NO3)2 ⋅ 3H2O, AgNO3, or HAuCl4. As mentioned above, each electrocatalyst was deposited onto the ECA−Ni substrate by immersing the substrate in the prepared deposition bath and immediately applying a constant current density of −10 mA cm−2 for 1 h at room temperature. Immediately after the electrochemical deposition, the substrate was taken out and washed with ultrapure water several times.
NiFeCrO x , [21] NiFeCeO x , [73] and NiFeWO x [74] electrodes were prepared by the electrochemical deposition and NiFeVO x [18] electrode was prepared by the hydrothermal synthesis on Pristine‐Ni foam following a previous recipe. In the same manner as described in the previous paragraph regarding the NiFeOx synthesis, Ni foam was washed before the electrodeposition or hydrothermal synthesis. NiFeCrO x was prepared by immersing the Ni foam in the deposition bath containing 10 mm of NiCl2 ⋅ 6H2O, 1 mm of Fe(NO3)3 ⋅ 9H2O, and 1 mm of Cr(NO3)3 ⋅ 9H2O and immediately applying a constant potential of −0.9 V vs. RHE for 5 min at room temperature. After electrodeposition, the electrode was rinsed and immersed in 1.0 m KOH solution. Subsequently, it was activated by 10 cycles CV in the potential range of 1.0–1.8 V vs. RHE at a scan rate of 100 mV s−1. [21] NiFeCeO x was prepared by immersing the Ni foam in the deposition bath containing 9 mm of NiSO4 ⋅ 6H2O, 9 mm of FeSO4 ⋅ 7H2O, 3 mm of Ce(NO3)3 ⋅ 6H2O, 20 mm H2SO4, 50 mm NH4OH and HCl to adjust its pH to 2.5 and immediately applying a constant current density of −20 mA cm−2 for 15 min at room temperature. [73] NiFeWO x was prepared by immersing the Ni foam in the deposition bath containing 6 mm of Ni(NO3)2 ⋅ 6H2O, 8.25 mm of Fe(NO3)3 ⋅ 9H2O, and 0.75 mm of Na2WO4 ⋅ 2H2O and immediately applying a constant current density of −2 mA cm−2 for 1 h at room temperature. [74] Regarding NiFeVO x preparation, Ni foam was transferred to a 190 mL Teflon‐lined stainless‐steel autoclave together with 166.25 mL of solution containing 11.4 mmol of Ni(NO3)2 ⋅ 6H2O, 1.9 mmol of Fe(NO3)3 ⋅ 9H2O, 1.9 mmol of VCl3, and 23.75 mmol of CO(NH2)2, which was subsequently heated at 393 K for 12 h. The autoclave was then naturally cooled to room temperature. [18]
Conflict of interest
The authors declare no conflict of interest.
1.
Supporting information
As a service to our authors and readers, this journal provides supporting information supplied by the authors. Such materials are peer reviewed and may be re‐organized for online delivery, but are not copy‐edited or typeset. Technical support issues arising from supporting information (other than missing files) should be addressed to the authors.
Supporting Information
Acknowledgments
A part of this work was supported by Asahi Kasei Corporation, UTokyo‐KAUST collaborative research OSR #4191 “Towards Sustainable Production of H2”, JSPS KAKENHI Grant Number 19KK0126, and the Mohammed bin Salman Center for Future Science and Technology for Saudi‐Japan Vision 2030 at The University of Tokyo (MbSC2030). XAFS measurements were performed at the Spring‐8 facility (2021B1168). We thank Y. Kono for the electrochemical test, which was conducted at the University of Tokyo.
Nishimoto T., Shinagawa T., Naito T., Harada K., Yoshida M., Takanabe K., ChemSusChem 2023, 16, e202201808.
Data Availability Statement
The data that support the findings of this study are available from the corresponding author upon reasonable request.
References
- 1. Lagadec M. F., Grimaud A., Nat. Mater. 2020, 19, 1140. [DOI] [PubMed] [Google Scholar]
- 2. Hao S., Sheng H., Liu M., Huang J., Zheng G., Zhang F., Liu X., Su Z., Hu J., Qian Y., Zhou L., He Y., Song B., Lei L., Zhang X., Jin S., Nat. Nanotechnol. 2021, 16, 1371. [DOI] [PubMed] [Google Scholar]
- 3. Reier T., Nong H. N., Teschner D., Schlögl R., Strasser P., Adv. Energy Mater. 2017, 7, 1601275. [Google Scholar]
- 4. McCrory C. C. L., Jung S., Ferrer I. M., Chatman S. M., Peters J. C., Jaramillo T. F., J. Am. Chem. Soc. 2015, 137, 4347. [DOI] [PubMed] [Google Scholar]
- 5. Seitz L. C., Dickens C. F., Nishio K., Hikita Y., Montoya J., Doyle A., Kirk C., Vojvodic A., Hwang H. Y., Nørskov J. K., Jaramillo T. F., Science 2016, 353, 1011. [DOI] [PubMed] [Google Scholar]
- 6. Yu J., He Q., Yang G., Zhou W., Shao Z., Ni M., ACS Catal. 2019, 9 9973. [Google Scholar]
- 7. Dionigi F., Strasser P., Adv. Energy Mater. 2016, 6, 1600621. [Google Scholar]
- 8. Deng X., Tüysüz H., ACS Catal. 2014, 4, 3701. [Google Scholar]
- 9. Park S., Lee Y. H., Cho S., Seo H., Lee M. Y., Balamurugan M., Nam K. T., Energy Environ. Sci. 2020, 13, 2310. [Google Scholar]
- 10. Sun C., Alonso J. A., Bian J., Adv. Energy Mater. 2021, 11, 2000459. [Google Scholar]
- 11. Yagi S., Yamada I., Tsukasaki H., Seno A., Murakami M., Fujii H., Chen H., Umezawa N., Abe H., Nishiyama N., Mori S., Nat. Commun. 2015, 6, 8249. [DOI] [PMC free article] [PubMed] [Google Scholar]
- 12. McCrory C. C. L., Jung S., Peters J. C., Jaramillo T. F., J. Am. Chem. Soc. 2013, 135. 16977. [DOI] [PubMed] [Google Scholar]
- 13. Schäfer H., Sadaf S., Walder L., Kuepper K., Dinklage S., Wollschläger J., Schneider L., Steinhart M., Hardege J., Daum D., Energy Environ. Sci. 2015, 8, 2685. [Google Scholar]
- 14. Trotochaud L., Young S. L., Ranney J. K., Boettcher S. W., J. Am. Chem. Soc. 2014, 136. 6744. [DOI] [PubMed] [Google Scholar]
- 15. Friebel D., Louie M. W., Bajdich M., Sanwald K. E., Cai Y., Wise A. M., Cheng M.-J., Sokaras D., Weng T.-C., Alonso-Mori R., Davis R. C., Barger J. R., Nørskov J. K., Nilsson A., Bell A. T., J. Am. Chem. Soc. 2015, 137, 1305. [DOI] [PubMed] [Google Scholar]
- 16. Martirez J. M. P., Carter E. A., J. Am. Chem. Soc. 2019, 141, 693. [DOI] [PubMed] [Google Scholar]
- 17. Chen J. Y. C., Dang L., Liang H., Bi W., Gerken J. B., Jin S., Alp E. E., Stahl S. S., J. Am. Chem. Soc. 2015, 137, 15090. [DOI] [PubMed] [Google Scholar]
- 18. Li P., Duan X., Kuang Y., Li Y., Zhang G., Liu W., Sun X., Adv. Energy Mater. 2018, 8. 1703341. [Google Scholar]
- 19. Zhang B., Wang L., Cao Z., Kozlov S. M., de Arquer F. P. G., Dinh C. T., Li J., Wang Z., Zgeng X., Zhang L., Wen Y., Voznyy O., Comin R., Luna P. D., Regier T., Bi W., Alp E. E., Pao C.-W., Zheng L., Hu Y., Ji Y., Li Y., Zhang Y., Cavallo L., Peng H., Sargent E. H., Nat. Catal. 2020, 3, 985. [Google Scholar]
- 20. Bates M. K., Jia Q., Doan H., Liang W., Mukerjee S., ACS Catal. 2016, 6, 155. [Google Scholar]
- 21. Fan L., Zhang P., Zhang B., Daniel Q., Timmer B. J. J., Zhang F., Sun L., ACS Energy Lett. 2018, 3. 2865. [Google Scholar]
- 22. Lu Z., Qian L., Tian Y., Li Y., Sun X., Duan X., Chem. Commun. 2016, 52, 908. [DOI] [PubMed] [Google Scholar]
- 23. Wang N., Cao Z., Zheng X., Zhang B., Kozlov S. M., Chen P., Zou C., Kong X., Wen Y., Liu M., Zhou Y., Dinh C. T., Zheng L., Peng H., Zhao Y., Cavallo L., Zhang X., Sargent E. H., Adv. Mater. 2020, 1906806. [DOI] [PubMed] [Google Scholar]
- 24. Liu M., Min K.-A., Han B., Lee L. Y. S., Adv. Energy Mater. 2021, 2101281. [Google Scholar]
- 25. Rabinowitz J. A., Kanan M. W., Nat. Commun. 2020, 11, 5231. [DOI] [PMC free article] [PubMed] [Google Scholar]
- 26. Jiang N., Zhu Z., Xue W., Xia B. Y., You B., Adv. Mater. 2021, 2105852. [DOI] [PubMed] [Google Scholar]
- 27. Naito T., Shinagawa T., Nishimoto T., Takanabe K., ChemSusChem 2022, 15, e202102294. [DOI] [PMC free article] [PubMed] [Google Scholar]
- 28. Chatenet M., Pollet B. G., Dekel D. R., Dionigi F., Deseure J., Millet P., Braatz R. D., Bazant M. Z., Eikerling M., Staffell I., Balcombe P., Shao-Horn Y., Schäfer H., Chem. Soc. Rev. 2022, 51, 4583. [DOI] [PMC free article] [PubMed] [Google Scholar]
- 29. Koh D.-H., Lee S.-G., Kim H.-C., Burns 2017, 43, 654. [DOI] [PubMed] [Google Scholar]
- 30. Wang X., Klingan K., Klingenhof M., Möller T., Ferreira de Araújo J., Martens I., Bagger A., Jiang S., Rossmeisl J., Dau H., Strasser P., Nat. Commun. 2021, 12, 794. [DOI] [PMC free article] [PubMed] [Google Scholar]
- 31. Shinagawa T., Ng M. T.-K., Takanabe K., ChemSusChem 2017, 10, 4155–4162. [DOI] [PubMed] [Google Scholar]
- 32. Surendranth Y., Kanan M. W., Nocera D. G., J. Am. Chem. Soc. 2010, 132, 16501. [DOI] [PubMed] [Google Scholar]
- 33. Yamaguchi A., Inuzuka R., Takashima T., Hayashi T., Hashimoto K., Nakamura R., Nat. Commun. 2014, 5, 4256. [DOI] [PMC free article] [PubMed] [Google Scholar]
- 34. Nishimoto T., Shinagawa T., Naito T., Takanabe K., ChemSusChem 2021, 14, 1554. [DOI] [PMC free article] [PubMed] [Google Scholar]
- 35. Li P., Zhao R., Chen H., Wang H., Wei P., Huang H., Liu Q., Li T., Shi X., Zhang Y., Liu M., Sun X., Small 2019, 15, 1805103. [DOI] [PubMed] [Google Scholar]
- 36. Jiang N., Zhu Z., Xue W., Xia B. Y., You B., Adv. Mater. 2021, 2105852. [DOI] [PubMed] [Google Scholar]
- 37. Schmidt O., Gambhir A., Staffell I., Hawkes A., Nelson J., Few S., Int. J. Hydrogen Energy 2017, 42, 30470. [Google Scholar]
- 38. Beverskog B., Puigdomenech I., Corros. Sci. 1997, 39, 969. [Google Scholar]
- 39. Beverskog B., Puigdomenech I., Corros. Sci. 1996, 38, 2121. [Google Scholar]
- 40. Dau H., Pasquini C., Inorganics 2019, 7, 20. [Google Scholar]
- 41. Lu Z., Xu W., Zhu W., Yang Q., Lei X., Liu J., Li Y., Sun X., Duan X., Chem. Commun. 2014, 50, 6479. [DOI] [PubMed] [Google Scholar]
- 42. Görlin M., Gliech M., de Araújo J. F., Dresp S., Bergmann A., Strasser P., Catal. Today 2016, 262, 65. [Google Scholar]
- 43.W. M. Haynes, D. R. Lide, Handbook of Chemistry and Physics, 92nd ed. CRC Press, Boca Raton, FL, 2011.
- 44. Scharifker B. R., Habib M. A., Carbajal J. L., O'M. Bockris J., Surf. Sci. 1986, 173, 97. [Google Scholar]
- 45. Boinet M., Maximovitch S., Dalard F., de Bouvier O., J. Mater. Sci. 2003, 38, 4041. [Google Scholar]
- 46. Bediako D. K., Surendranath Y., Nocera D. G., J. Am. Chem. Soc. 2013, 135, 3662. [DOI] [PubMed] [Google Scholar]
- 47.A. J. Bard, L. R. Faukner, Electrochemical Methods: Fundamentals and Applications, Wiley, New York, NY, 2010.
- 48. Shinagawa T., Garcia-Esparza A. T., Takanabe K., Sci. Rep. 2015, 5, 13801. [DOI] [PMC free article] [PubMed] [Google Scholar]
- 49. Louie M. W., Bell A. T., J. Am. Chem. Soc. 2013, 135, 12329. [DOI] [PubMed] [Google Scholar]
- 50. Iwasita T., Rodes A., Pastor E., J. Electroanal. Chem. 1995, 383, 181. [Google Scholar]
- 51. Gisbert R., Garcia G., Koper M. T. M., Electrochim. Acta 2010, 55, 7961. [Google Scholar]
- 52.P. Atkins, J. D. Paula, Atkins’ Physical Chemistry, 8th ed. W. H. Freeman and Company: New York, 2006.
- 53. Nishimoto T., Shinagawa T., Naito T., Takanabe K., J. Catal. 2020, 391, 435. [Google Scholar]
- 54. Shinagawa T., Ng M. T.-K., Takanabe K., Angew. Chem. Int. Ed. 2017, 56, 5061; [DOI] [PubMed] [Google Scholar]; Angew. Chem. 2017, 129, 5143. [Google Scholar]
- 55. David M., Ocampo-Martínez C., Sánchez-Peña R., J. Energy Storage 2019, 23, 392. [Google Scholar]
- 56. Chung D. Y., Lopes P. P., Farinazzo Bergamo Dias Martins P., He H., Kawaguchi T., Zapol P., You H., Tripkovic D., Strmcnik D., Zhu Y., Seifert S., Lee S., Stamenkovic V. R., Markovic N. M., Nat. Energy 2020, 5, 222. [Google Scholar]
- 57. Yu M., Moon G.-H., Castillo R. G., DeBeer S., Weidenthaler C., Tüysüz H., Angew. Chem. Int. Ed. 2020, 59, 16544; [DOI] [PMC free article] [PubMed] [Google Scholar]; Angew. Chem. 2020, 132, 16687. [Google Scholar]
- 58. Klaus S., Trotochaud L., Cheng M.-J., Head-Gordon M., Bell A. T., ChemElectroChem 2016, 3, 66. [Google Scholar]
- 59. Zou S., Burke M. S., Kast M. G., Fan J., Danilovic N., Boettcher S. W., Chem. Mater. 2015, 27, 8011. [Google Scholar]
- 60. Burke M. S., Enman L. J., Batchellor A. S., Zou S., Boettcher S. W., Chem. Mater. 2015, 27, 7549. [Google Scholar]
- 61. Nurlaela E., Shinagawa T., Qureshi M., Dhawale D. S., Takanabe K., ACS Catal. 2016, 6, 1713. [Google Scholar]
- 62. Kitano S., Noguchi T. G., Nishihara M., Kamitani K., Sugiyama T., Yoshioka S., Miwa T., Yoshizawa K., Staykov A., Yamauchi M., Adv. Mater. 2022, 34, 2110552. [DOI] [PubMed] [Google Scholar]
- 63. Jothi V. R., Karuppasamy K., Maiyalagan T., Rajan H., Jung C.-Y., Yi S. C., Adv. Energy Mater. 2020, 10, 1904020. [Google Scholar]
- 64. Tang T., Jiang W.-J., Yuan L.-P., Niu S., Hu J.-S., Wan L.-J., J. Mater. Chem. A 2020, 8, 11573. [Google Scholar]
- 65. Tan Y., Li Q., Che Q., Chen X., Xu X., Chen Y., Electrochim. Acta 2019, 324, 13489. [Google Scholar]
- 66. Chen R., Hung S.-F., Zhou D., Gao J., Yang C., Tao H., Yang H. B., Zhang L., Zhang L., Xiong Q., Chen H. M., Liu B., Adv. Mater. 2019, 31, 1903909. [DOI] [PubMed] [Google Scholar]
- 67. Shang X., Liu Z.-Z., Zhang J.-Q., Dong B., Zhou Y.-L., Qin J.-F., Wang L., Chai Y.-M., Liu C.-G., ACS Appl. Mater. Interfaces 2018, 10, 42217. [DOI] [PubMed] [Google Scholar]
- 68. Yu J., Cao Q., Li Y., Long X., Yang S., Clark J. K., Nakabayashi M., Shibata N., Delaunay J.-J., ACS Catal. 2019, 9, 1605. [Google Scholar]
- 69. Todoroki N., Wadayama T., ACS Appl. Mater. Interfaces 2019, 11, 44161. [DOI] [PubMed] [Google Scholar]
- 70. Darband G. B., Aliofkhazraei M., Shanmugam S., Renewable Sustainable Energy Rev. 2019, 114, 109300. [Google Scholar]
- 71. Kuai C., Xu Z., Xi C., Hu A., Yang Z., Zhang Y., Sun C.-J., Li L., Sokaras D., Dong C., Qiao S.-Z., Du X.-W., Lin F., Nat. Catal. 2020, 3, 743. [Google Scholar]
- 72. Zhou H., Yu F., Zhu Q., Sun J., Qin F., Yu L., Bao J., Yu Y., Chen S., Ren Z., Energy Environ. Sci. 2018, 11, 2858. [Google Scholar]
- 73. Obata K., Takanabe K., Angew. Chem. Int. Ed. 2018, 57, 1616; [DOI] [PubMed] [Google Scholar]; Angew. Chem. 2018, 130, 1632. [Google Scholar]
- 74. Rajendiran R., Chinnadurai D., Chen K., Selvaraj A. R., Prabakar K., Li O. L., ChemSusChem 2021, 14, 1324. [DOI] [PubMed] [Google Scholar]
Associated Data
This section collects any data citations, data availability statements, or supplementary materials included in this article.
Supplementary Materials
As a service to our authors and readers, this journal provides supporting information supplied by the authors. Such materials are peer reviewed and may be re‐organized for online delivery, but are not copy‐edited or typeset. Technical support issues arising from supporting information (other than missing files) should be addressed to the authors.
Supporting Information
Data Availability Statement
The data that support the findings of this study are available from the corresponding author upon reasonable request.