

Abstract
Genomic analyses have revealed heterogeneity among glial progenitor cells (GPCs), but the compartment selectivity of human GPCs (hGPCs) is unclear. Here, we asked if GPCs of human grey and white brain matter are distinct in their architecture and associated gene expression. RNA profiling of NG2‐defined hGPCs derived from adult human neocortex and white matter differed in their expression of genes involved in Wnt, NOTCH, BMP and TGFβ signaling, suggesting compartment‐selective biases in fate and self‐renewal. White matter hGPCs over‐expressed the BMP antagonists BAMBI and CHRDL1, suggesting their tonic suppression of astrocytic fate relative to cortical hGPCs, whose relative enrichment of cytoskeletal genes presaged their greater morphological complexity. In human glial chimeric mice, cortical hGPCs assumed larger and more complex morphologies than white matter hGPCs, and both were more complex than their mouse counterparts. These findings suggest that human grey and white matter GPCs comprise context‐specific pools with distinct functional biases.
Keywords: glial heterogeneity, human glial progenitor cells, NG2, white and grey matter
Main Points
GPCs in the adult human white and gray matter are transcriptionally distinct.
GM and WM hGPCs differentially express WNT, NOTCH, BMP and TGFβ pathway genes.
The expression of BMP antagonists is significantly higher in WM hGPCs.
hGPCs in the GM are larger and more complex than in the WM.

1. INTRODUCTION
Glial progenitor cells (GPCs) comprise 3%–4% of all cells in the human brain (Roy et al., 1999; Scolding et al., 1998). They can be identified based on the expression of gangliosides recognized by the monoclonal antibody (mAb) A2B5 (Roy et al., 1999; Scolding et al., 1998), by chondroitin sulfate proteoglycan 4 as recognized by mAb NG2, and by the CD140a epitope of PDGF receptor alpha (PDGFRa) (Sim et al., 2011). GPCs are the source of mature oligodendrocytes in the adult human brain, and are required for both myelin turnover and repair of demyelinated lesions. As such, they are operationally synonymous with oligodendrocyte progenitor cells (OPCs) and NG2 cells (Suzuki & Nishiyama, 2009). Yet these cells are bipotential for astrocytes as well (Huang et al., 2014; Raff et al., 1983; Zhu et al., 2008) and in some circumstances can also generate neurons, indicating their retention of cell‐autonomous multi‐lineage competence (Belachew et al., 2003; Dimou & Gallo, 2015; Nunes et al., 2003). The intrinsic phenotypic plasticity of GPCs suggests the potential for their context‐dependent heterogeneity.
GPCs are ubiquitous throughout the central nervous system (CNS), pervading both grey (GM) and white matter (WM), with extensive fiber arbors that establish tiled domains of spatial exclusivity, much like astrocytic domains (Hughes et al., 2013). They have been traditionally viewed as a homogenous population, given their relatively uniform appearance throughout the CNS; nonetheless, single‐cell RNA, RNAscope in situ hybridization (ISH) and in situ sequencing (ISS) studies have revealed significant heterogeneity among cells of oligodendroglial lineage during development (Floriddia et al., 2020; Marques et al., 2018; Marques et al., 2016), as well as across different brain regions (Floriddia et al., 2020), and in the context of disease (Falcao et al., 2018; Jakel et al., 2019). Heterogeneity among WM hGPCs in particular has been described in terms of their context‐dependent proliferation, differentiation and remyelination potential (Crawford et al., 2016; Marisca et al., 2020; Psachoulia et al., 2009; Rivers et al., 2008; Vigano et al., 2013; Young et al., 2013), as well as in their transmitter responsiveness and physiology (Chittajallu et al., 2004; Karadottir et al., 2008; Spitzer et al., 2019).
Yet few studies have distinguished the context‐dependent responses of hGPCs to occupancy within grey and white matter. Relative to GM GPCs, those isolated from the WM have demonstrated greater myelinogenic potential (Dimou et al., 2008; Vigano et al., 2013), higher proliferative rates in response to PDGF (Hill et al., 2013), and shorter cell cycles (Dawson et al., 2003; Dimou et al., 2008; Psachoulia et al., 2009; Rivers et al., 2008; Young et al., 2013). These studies raise the possibility that grey and white matter GPCs might be fundamentally distinct, whether on the basis of cell‐autonomous constraints, environmental context‐dependent determinants, or both. Yet these observations have been made almost exclusively in rodent models; little is known regarding the relative morphologies, distributions or transcriptional patterns of GPCs in the adult human brain.
In this study, we asked if GPCs of the human cortical GM and subcortical WM comprise transcriptionally‐distinct phenotypes, and the extent to which that distinction might be contextually incited. To this end, we first defined the densities of GPCs in the WM and GM compartments of the adult human brain, and the gene expression patterns of those GPCs as directly sorted from human brain, to define the transcriptional distinctions between GM and WM‐derived GPCs. We found that agonists of the TGFβ/BMP pathway were enriched in the GM, while the antagonists BAMBI and CHRDL1 were highly and differentially expressed by white matter GPCs, suggesting the relative protection of WM GPCs from BMP‐induced astroglial differentiation, and thus preservation of oligodendrocyte fate potential. We then introduced WM‐derived hGPCs into neonatal mice so as to establish human adult glial chimeras, and then assessed the regional morphometrics of GM and WM hGPCs, while also evaluating the extent to which the hGPCs differed from their murine counterparts in size and complexity. We found that the donor hGPCs assumed the morphologies and distributions typical of the GM and WM compartments into which they immigrated, highlighting the maintenance of plastic signaling programs that allow the context‐dependent differentiation of human GPCs.
2. MATERIALS AND METHODS
2.1. Human tissue
Human brain tissue was obtained from temporal lobe biopsy from four male patients diagnosed with medication‐refractory epilepsy. We selected samples without defined histopathological abnormalities or malformations and distant from the epileptic foci. Donor mean age was 27 ± 7.1 years; all were males. All samples were obtained with consent under approved protocols of the University of Rochester Institutional Review Board.
2.2. Human glial chimeric mice for morphologic studies
Chimeric brain samples were obtained from four adult male immune‐deficient Rag2−/− mice, that received neonatal intracerebral grafts of human fetal GPCs, according to previously published methods (Han et al., 2013; Mariani et al., 2019; Windrem et al., 2008). Human cells were obtained from 18 to 22 weeks' gestation fetal forebrain at the University of Rochester Medical Center. hGPCs were purified by A2B5‐based immunomagnetic sorting with serial depletion of neuronal precursors expressing PSA‐NCAM, as previously described (Windrem et al., 2004). Before transplantation, the cells were transduced with a lentivirus vector expressing membrane‐bound EGFP under the control of the EF1α promoter (Benraiss et al., 2013). Rag2−/− males of similar age without human cell grafts were used as controls. Mice were sacrificed at 12 months of age. All animal experiments were approved by the University of Rochester's Committee on Animal Resources and conducted following institutional guidelines for the proper and humane use of animals in research.
2.3. Histology
The human tissue was obtained in the operative room, transported in a buffered solution, fixed for 1 h with 4% paraformaldehyde, cryoprotected with 30% sucrose and cryosectioned in 50 or 100 μm slices. The mouse brains were perfused with phosphate buffered saline (PBS) followed by 4% paraformaldehyde, then post‐fixed in 4% paraformaldehyde for 2 h, cryoprotected in 30% sucrose and sectioned in 100 μm slices using a cryostat. Free‐floating sections were washed in PBS with 0.1% Triton X‐100 (PBS‐T), blocked with 10% goat serum in PBS‐T for 1 h at room temperature, followed by primary antibody incubation diluted in PBS‐T with 1% goat serum for 3 days. Sections were washed in PBS‐T, incubated with secondary antibodies for 2 h in PBS‐T with 1% goat serum, then washed. Primary antibodies used included the human‐specific mouse anti‐NG2 (Millipore/Merck MAB2029, clone 9.2.27; 1:200) and rabbit anti‐mouse NG2 (Millipore/Merck AB5320; 1:250) to label human and mouse GPCs, respectively; rabbit anti‐OLIG2 (Neuromics RA25081; 1:1500), mouse anti‐OLIG2 (Millipore/Merck MABN50, clone 211F1.1; 1:200) and rabbit anti‐GFP IgG (ThermoFisher Scientific A11122; 1:500). Goat anti‐mouse Alexa Fluor 555 (ThermoFisher Scientific A32727; 1:400), goat anti‐rabbit Alexa Fluor 555 (ThermoFisher Scientific A21428; 1:400) and goat anti‐rabbit Alexa Fluor 488 (ThermoFisher Scientific A11034; 1:400) were used as secondary antibodies.
2.4. Imaging
To perform NG2+ GPC density counts in human sections, 30 μm z‐stacks with 2 μm step size of cortex (CTX) (layers V‐VI) and adjacent subcortical WM were obtained using an Olympus BX‐51 microscope driven by Stereo Investigator software (MBF, Williston, VT) at ×40 magnification. Cell density counts were done using the stereological optical fractionator method, by which the total number of cells covering the entire region of interest is estimated using a systematic randomly sampled set of unbiased virtual counting spaces with a uniform distance between them. The coefficient of Gundersen (n = 1) <.2 was used to estimate the precision of the number estimate (Gundersen et al., 1999; StereoInvestigator, MBF Bioscience, Williston, VT). For NG2+ cell counts, the average counting frame area across different specimens was 66,833 μm2 and the sampling grid area 486,821 μm2. A mean of 18 sites were sampled with an average of 158 cells counted per sample. For DAPI+ cell counts, the average counting frame area was 10,306 μm2 and the sampling grid area 463,797 μm2. Again, 18 sites were sampled; an average of 748 cells were counted in each. The average measured thickness was 29 μm; this was used to estimate the total number of cells.
For morphological mapping of GPCs, confocal stacks of NG2‐stained sections with 0.2–0.5 μm step size were obtained using an Olympus FV1000 laser scanning confocal microscope at ×60 or ×100 magnification. The average staining penetration of the NG2 antibody in the human glial chimeric mouse brain was 60–70 μm. Cells for analysis were imaged from the frontoparietal CTX layers V‐VI and underlying corpus callosum (CC). The cell tracing and 3D reconstruction was performed with the 3D‐neuronal software Neurolucida v.11.03 (MBF Bioscience, Williston, VT USA). Volume estimates were quantified using a convex hull analysis (Rodieck, 1973), which measures the size of a branched structure by interpreting it as a convex polygon limited by the tips of the distal ramifications and calculates its volume. For cell complexity analysis, Sholl analysis (Rodger et al., 2012; Sholl, 1953) and branching analysis (Neurolucida, MBF Bioscience, Williston, VT USA) were used. For the Sholl analysis, concentric spheres, with 5 μm radial increments from the center of the cell body were selected, and the number of intersections of each traced cell was calculated. Co‐labeling for human NG2 and EGFP was used to identify human NG2+ GPCs in the human glial chimeric mice sections, allowing a clear definition of single EGFP+ GPCs, as only a subset of cells was efficiently transduced with EGFP. Only double‐labeled processes were traced during cell reconstruction. To exclude NG2+ pericytes, GPCs were confirmed as such by their co‐expression of NG2 and nuclear OLIG2.
2.5. Statistics
Unpaired t‐test and analysis of variance (ANOVA) were used for comparisons between two or more groups, respectively. For analysis of Sholl curves, two‐way ANOVA followed by Bonferroni Multiple Comparisons tests were used. Mann‐Whitney tests were used for the in situ hybridization analysis. All the analyses were done in GraphPad Prism v.7.0c for Mac, GraphPad Software, La Jolla California USA. Data are shown as means ± SEM unless otherwise specified. Analyses were deemed significant at p < .05.
2.6. Expression profiling
Matched GM and WM tissue was obtained from four adult temporal lobe samples resected from medication‐refractory epileptic patients (30–46 years old), and hGPCs were isolated on the basis of A2B5 expression, as previously described (Auvergne et al., 2013; Nunes et al., 2003). RNA was then isolated from sorted and unsorted samples and hybridized to Affymetrix U133 + 2 arrays for analysis of gene expression. Raw data were deposited at the NCBI Gene Expression Omnibus under Accession GSE29796, where they were originally published as healthy controls for comparison against tumor samples (Auvergne et al., 2013). Re‐analysis of these data was carried out to investigate previously unexplored differences between GM and WM hGPCs. Following import of raw data into R (R Core Team, 2017), robust multiarray analysis (RMA; Irizarry et al., 2003) was employed for preprocessing and initial normalization. Present‐absent calls were made using PANP (Warren, 2017) at a threshold of p < .01 where a probe was called if present in at least one A2B5+ sample. Probes were further selected for those that were specific to one annotated gene with AnnotationDbi (Pagès et al., 2017). Adjustment for batch effects based on known batches was performed via ComBat (Johnson et al., 2007), prior to differential expression testing in limma (Ritchie et al., 2015), where the sample groups were input into a model following patient blocking. Three contrasts were then obtained: WM hGPCs vs unsorted WM tissue, GM hGPCs versus unsorted GM tissue, and WM vs GM hGPCs; genes with adjusted p‐value <.05 were considered differentially expressed from these contrasts.
Gene ontology network construction: Genes differentially expressed between WM and GM GPCs were then assessed using ingenuity pathway analysis (IPA) (http://www.qiagen.com/ingenuity), by which significantly enriched CNS and Stem Cell terms were obtained. Network construction of curated terms of interest, and their contributing genes with the manual addition of some notable relationships, was carried out in Cytoscape (Shannon, 2003). R analysis script and processed data can be assessed at https://github.com/CTNGoldmanLab/Adult_WM_vs_GM_hGPC_2022.
2.7. In situ hybridization
Samples were obtained from chimeric homozygous Rag1−/− immunodeficient mouse transplanted neonatally with a total of 200,000 hESCs‐derived hGPCs into the anlagen of the CC. The mice were sacrificed at 42 weeks, when chimerization is complete (Windrem et al., 2014), perfusion‐fixed with 4% paraformaldehyde, cryopreserved after sequential incubation in 6% and then 30% sucrose in phosphate buffer solution and then frozen. Sections were cut at 14 μm onto Fisher SuperFrost Plus slides and stored at −80°C. In situ hybridization (ISH) for RNA target probes was performed using RNAscope®Multiplex Fluorescent v2 System in conjunction with and ACD HybEZ™ II Hybridization System (ACDBio). Slides were baked in the hybridization oven at 40°C overnight the day immediately prior to ISH run. Day of run, slides were rehydrated, and endogenous peroxidases were quenched with a treatment of 0.15% hydrogen peroxide for 1 h. The remainder of the RNAscope protocol was performed as outlined in the ACDBio User Manual. Probes used included Hs‐BAMBI, Hs‐CHRDL1 and Hs‐PDGFRA‐No‐XMm, fluorescently labeled for visualization with Opal™ Dyes in 520 or 570 (PerkinElmer) at a dilution of 1:1000. RNAscope 4‐plex negative control probes from ACDBio (universal negative control with probes targeting the DapB gene from the Bacillus subtilis strain SMY) were used to ensure no background staining related to the RNAscope assay. Neighboring cells not expressing the probes within the same image were used as an additional internal negative control.
3. RESULTS
3.1. Human NG2 + GPC density is conserved across the grey and white matter
To first estimate the incidence of NG2+ GPCs in the neocortex (CTX) and underlying capsular white matter (WM) of the adult human brain, we immunostained 40 μm sections of resected temporal lobe for NG2 and OLIG2 and quantified the density of OLIG2+/NG2+ parenchymal GPCs. We imaged a 30 μm z‐stack using a step size of 2 μm, including both the CTX (layers V‐VI) and the underlying subcortical WM. Cell counts were estimated as described in the methods. In the human temporal CTX, the GPC density was 5531 ± 667 cells/mm3 (n = 10; 4 samples, 2–3 measurements per sample), whereas in the underlying subcortical WM, it was 5668 ± 449 cells/mm3 (NS, unpaired t‐test; Figure 1a). Thus, the density of hGPCs, expressed as the numbers of GPCs per unit volume, did not differ appreciably between GM and WM, suggesting their relatively uniform tiling across compartments.
FIGURE 1.
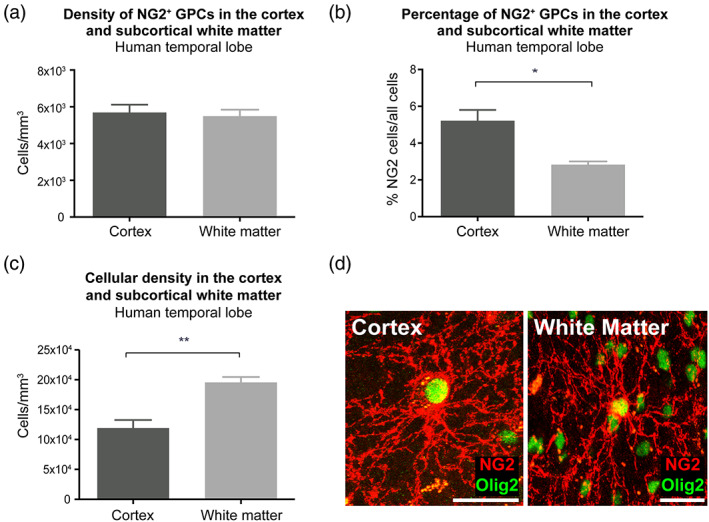
hGPC density is conserved across adult human grey and white matter compartments. (a) The density of hGPCs was similar in the deep cortical GM (layers V/VI) and subcortical WM of the human temporal lobe. (b) The proportion of hGPCs among all cells was higher in the cortical GM than in the subcortical WM of the human temporal lobe. (c) The total cellular density was higher in the subcortical WM than in the cortical GM of the human temporal lobe. (d) Representative confocal images of NG2+ hGPCs (red) co‐labeled with nuclear OLIG2 (green) in the CTX and WM. Mean ± SEM. *p < .05, **p < .01 by unpaired t‐test. n = 4 samples. Scale: 20 μm. GM, grey matter; hGPC, human glial progenitor cell; WM, white matter
However, we noted a significantly higher overall net cell density in the WM than the CTX (209,713 ± 18,769 cells/mm3 vs. 114,001 ± 10,343 cells/mm3; p = .0043, unpaired t‐test), as estimated by DAPI+ nuclear counts in the same sections (Figure 1c). As such, GPCs comprised a higher proportion of cells in the CTX than the WM, due to the lesser cellular density of the GM relative to WM: NG2+ hGPCs comprised 4.9% ± 0.7% of all cells in the CTX, yet only 2.7% ± 0.2% of all cells in the subcortical WM (p = .027, unpaired t‐test; n = 4 samples; 2–3 measurements per sample; Figure 1b). The percentage of cells within the WM was thus in line with what has been previously reported in normal appearing human WM (Roy et al., 1999; Scolding et al., 1998).
3.2. Adult human GPCs exhibit a core shared set of differentially‐expressed genes
We next asked if and how human GM and WM‐derived GPCs might differ in their respective patterns of gene expression. To this end, we utilized a microarray dataset of matched A2B5‐sorted GPCs derived from adult human temporal neocortex or subjacent WM, as isolated from four adult patients subjected to temporal lobectomy for medication‐refractory epilepsy. While the raw data from Affymetrix U133 + 2 arrays of WM‐ and GM‐derived samples of this comparison were assessed as normal reference samples in a previous study of gliomagenesis (Auvergne et al., 2013), in this case we specifically compared the gene expression profiles of CTX and WM‐derived hGPCs from our four sampled patients. An average of 133,700 cells were used for the analysis for the various samples (range: 11,000–330,000).
Principle component analysis (PCA) of all four pairs, as well as the parental unsorted tissues from which they were each derived, revealed that cortical and white matter hGPCs were distinct from one another and hGPCs within each compartment were closer to the tissue each derived from (Figure 2a). The intersection of WM and GM hGPCs was significantly enriched for genes associated with early oligodendroglial lineage including OLIG1, OLIG2, PDGFRA, FABP7, CSPG4/NG2, ASCL1, and the A2B5 synthetic enzyme ST8SIA1, along with the astrocytic markers SLC1A2/GLT1, ATP1B2, MT3, ALDOC and MOXD1 (Fu et al., 2021) and the neural stem cell‐associated genes SOX1 and SOX2 (Avilion, 2003; Pevny et al., 1998). Of note, the hGPCs also possessed a markedly lower expression of the mature oligodendrocyte or astrocyte markers MBP, CNP, MOBP, and GLUL, as compared to their surrounding tissue (Figure 2b).
FIGURE 2.
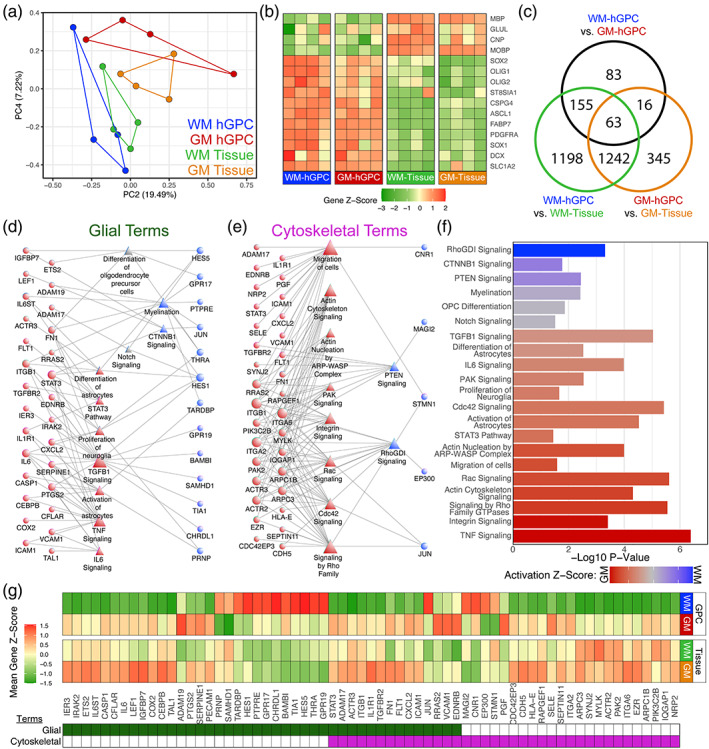
Adult hGPCs in the grey and white matter are transcriptionally distinct. Unsorted tissue and A2B5 selected hGPCs were obtained from WM and GM in four adult human patients and analyzed via microarray. (a) Principal component analysis of all samples illustrated separation of regional hGPCs. (b) Heatmap representation of differentially expressed CNS lineage markers in both WM and GM hGPCs, versus their respective unsorted tissue. (c) Intersection of differentially expressed genes (adjusted p < .05) in either tissue, versus their derived hGPCs or between WM or GM hGPCs. (d, e) Two curated networks were constructed of select ingenuity pathway analysis terms and their contributing genes for primarily glial (d), or cytoskeletal (e) terms. Circles represent genes, triangles IPA terms, and their relative size represents node degree. (f) Significance and activation Z‐scores of network IPA terms. Red indicates expression bias for grey matter GPCs; blue indicates white matter GPC bias. (g) Heatmap of the mean gene Z‐scores of all genes included in either network. Their presence in the glial or cytoskeletal network is indicated underneath. CNS, central nervous system; GM, grey matter; hGPC, human glial progenitor cell; WM, white matter
3.3. Adult hGPCs within the cortex and subcortical WM are transcriptionally distinct
We next sought to define those patterns of gene expression that distinguished hGPCs of the cortical GM from those in the subcortical WM. This analysis revealed 88 significantly enriched genes in WM hGPCs compared to GM hGPCs, and 229 genes enriched in GM hGPCs relative to WM (FDR < 0.05, Figure 2c, Table S1). Functional analysis of this differentially regulated cohort using ingenuity pathway analysis (IPA) identified several signaling pathways and mechanisms potentially associated with phenotypic divergence (Figure 2d–g, Table S2).
GM hGPCs exhibited heavy enrichment of genes involved in cytoskeletal remodeling and glial morphogenesis, including the actin‐related genes ACTR2, ACTR3, ARPC1B and ARPC3, and the actin binding TPM3 (Seixas et al., 2019; Zuchero et al., 2015). Additionally, genes related to the Rho GTPase signaling pathway, involved in the regulation of neuronal morphogenesis and growth (Luo, 2000), were also upregulated in GM hGPCs. Among these were effectors of the RhoA pathway ROCK2 and MYLK, both kinases that phosphorylate MLC and consequently activate the NMII gene, a key regulator of cytoskeleton dynamics preventing GPC maturation (Biname et al., 2013; Leitman et al., 2011; Liang et al., 2004; Melendez‐Vasquez et al., 2004; Thomas et al., 2002; Wang et al., 2012) and PAK2 which is involved in neurite outgrowth through the Rac‐Cdc42 signaling pathway (Shin et al., 2002). This disparity in genes involved in cytoskeletal remodeling may contribute to the observed differences in hGPC size and complexity between GM and WM. GM hGPCs were also enriched in genes driving astrocyte fate, with pronounced expression of various related signaling pathways and mechanisms, including differentiation of astrocytes, activation of astrocytes, STAT3 pathway and IL6 signaling. Among the genes involved in IL6 signaling, critical in astroglial specification (Bonni et al., 1997; Cao et al., 2010; Nakanishi et al., 2007), were IL6, its signal transducer IL6ST/Gp130, and the effector STAT3. Key genes involved in Wnt/βcatenin signaling, a pathway with a critical role in GPC self‐renewal, were upregulated in GM hGPCs. Among these were LEF1, the Wnt effector ETS2 and IGFBP7, which all serve as negative regulators of oligodendrocyte differentiation (Fancy et al., 2009; Fancy et al., 2014; Goldman & Osorio, 2014; Li et al., 2018).
In contrast to GM hGPCs, WM hGPCs differentially expressed genes involved in the inhibition of astrogliogenesis. BAMBI and CHRDL1 were selectively enriched, two potent competitive antagonists of the TGFβ superfamily BMP signaling, a key pathway driving astrocytic fate (Bonaguidi, 2005; Mabie et al., 1997; Onichtchouk et al., 1999; Sakuta et al., 2001; Sim et al., 2006). Also involved in the inhibition of astrocytic fate was ZFP36L2, whose paralog ZFP36L1 promotes oligodendrogenesis and suppresses astrocytic fate (Weng et al., 2019) and EP300, which cooperates with HDAC3 as an epigenetic regulator, inhibiting NFIA and STAT3‐mediated astrogliogenesis to promote oligodendrocyte identity (Zhang et al., 2016). In contrast, genes involved in oligodendrocyte specification were selectively enriched in WM GPCs, including the T3 receptor THRA, the protein tyrosine phosphatase PTPRE and the TAR binding TDP43 (TARDBP), all necessary for oligodendrocytic differentiation (Billon, 2002; Peretz et al., 2000; J. Wang et al., 2018). Enrichment of the downstream Notch target DTX3, whose paralog, DTX1 is critical for oligodendrocyte specification (Cui et al., 2004; Hu et al., 2003), was also enriched in WM hGPCs. Predicted NOTCH signaling activity, critical for GPC self‐renewal, was more pronounced in WM hGPCs, driven by the enriched expression of HES1 and HES5 (Genoud et al., 2002; Kondo & Raff, 2000; Wang et al., 1998; Zhang et al., 2009). The G protein‐coupled receptor GPR17 (Chen et al., 2009; Lu et al., 2018; Ou et al., 2016), also tightly linked to the maintenance of the GPC state, was additionally enriched in WM hGPCs. In contrast to the elevated levels of transcripts involved in cytoskeletal remodeling in GM hGPCs, WM hGPCs exhibited pronounced expression of genes involved in the Rho GDI signaling pathway, which functions as a negative regulator of Rho GTPases (Garcia‐Mata et al., 2011).
3.4. Human GPCs are larger and more complex in the chimeric cortex than in white matter
We next asked whether grey and white matter hGPCs differed in their volumetric and domain structures and volume occupancy. However, human tissue samples cannot be perfusion fixed, and are thus subject to significant artifactual changes in volume and quality, that impact not only net cell volume, but also the apparent distribution of distal fibers. To address the limitations of human tissue, we therefore established human glial chimeric mice, by transplanting neonatal Rag2‐null immunodeficient mice with A2B5‐sorted human fetal GPCs. In this model, the hGPCs outcompete the resident mouse GPC population to colonize the host, ultimately replacing the mouse GPC population with hGPCs, which retain both astrocytic and oligodendrocytic fate competence (Goldman et al., 2015; Mariani et al., 2019). Mice were sacrificed 1 year later and hGPCs were imaged using confocal stacks with 0.2–0.5 μm steps and subsequently reconstructed in 3D software, as described in the Methods section (Figure 3a–c). The sizes and complexity of the resident hGPCs in the frontoparietal CTX layers V‐VI and underlying callosal WM were assessed in the mouse host.
FIGURE 3.
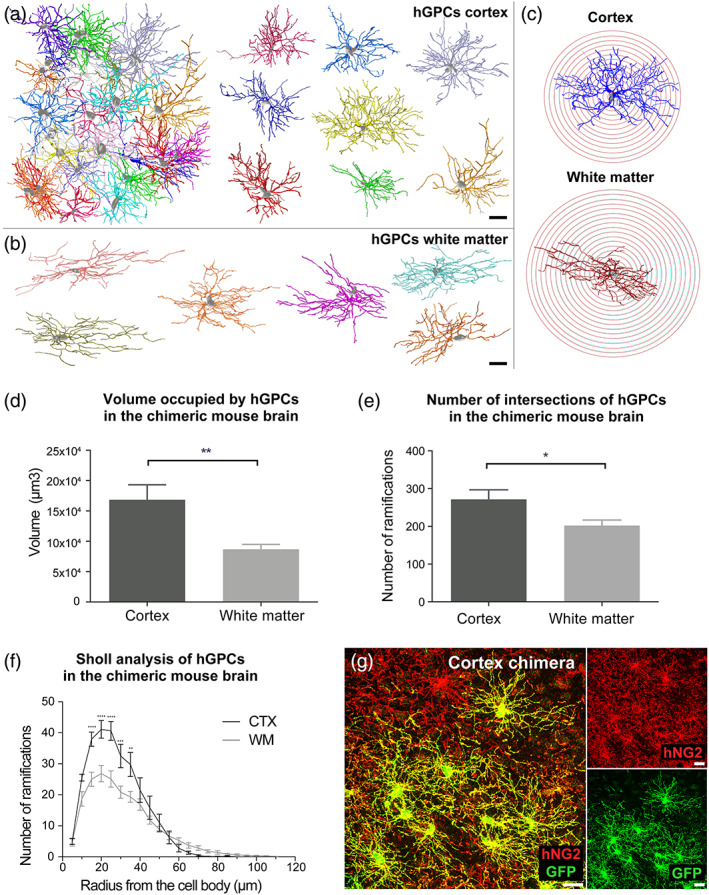
GM hGPCs are larger and more complex than WM hGPCs in adult glial chimeric mice. (a, b) Prototypic examples of 2D flat projections of 3D‐mapped hGPC morphologies in the CTX and callosum of the adult human glial chimeric mouse, as used for volumetric and branch analysis. (c) Representative 2D projections of individual, 3D‐mapped hGPCs, in both the CTX and CC of the adult human glial chimeric mouse used for Sholl analysis with superimposed 5 μm radius spheres. (d) hGPCs in the GM occupied larger volumes than those in the WM of human glial chimeric mice. (e) The total number of ramifications intersecting the Sholl's spheres was higher in cortical than in WM hGPCs. (f) Sholl analysis of individual hGPC morphologies in the CTX and CC of adult human glial chimeric mice revealed that cells within the CTX have increased branching at 15–35 μm distally from the cell body. (g) Representative confocal image of hGPCs in the mouse chimeric CTX. The human specific NG2+ is immunolabeled in red and overlapped with EGFP expression in a subset of cells, allowing a clear distinction of cell borders and hence reliable reconstruction of complete cells. Mean ± SEM. *p < .05, **p < .01, ***p < .001, ****p < .0001, by unpaired t‐test (d, e) and two‐way ANOVA with Bonferroni's post hoc (f). n = 4 mice. Scale: 20 μm. GM, grey matter; hGPC, human glial progenitor cell; WM, white matter
We found that the human cells in the adult human glial chimeric CTX occupied significantly larger volumes than those in the callosal white matter (168,419 ± 24,632 μm3 vs. 86,795 ± 8024 μm3, p = .008 by unpaired t‐test; Figure 3d). Besides their larger volumes, hGPCs in the CTX were more complex than in the WM. To assess fiber complexity, we used Sholl analysis with fiber morphometry, as we have described (Windrem et al., 2017). This analysis revealed that individual cortical hGPCs had significantly more branches intersecting the concentric spheres of the Sholl analysis than did cells in the callosum (272 ± 25 vs. 202 ± 15 branches, p = .03 by unpaired t‐test; Figure 3e). In particular, the number of ramifications were significantly increased in cortical hGPCs 15–35 μm distally from the center of the cell body, the distance at which complexity peaks in cells within both compartments (p ≤ .01, two‐way ANOVA with Bonferroni's post hoc tests; Figure 3f). Data presented as mean ± SEM. n = 4 mice used as biological replicates with 3 measurements per mouse.
3.5. Mouse cortical GPCs are larger and more complex than mouse callosal GPCs
Using control mice with the same strain and age but not chimerized, mouse GPCs (mGPCs) in the CTX and corpus callosum (CC) were compared in size and complexity, similar to the approach previously described for hGPCs in the chimeras. Cortical mGPCs also occupied significantly larger volumes than mGPCs in the callosal white matter (97,002 ± 6269 μm3 vs. 73,249 ± 7358 μm3, p = .02 by unpaired t‐test; Figure 4b). mGPCs within the CTX also exhibited higher complexity than their analogues within the CC, evidenced by the higher total number of ramifications intersecting the Sholl's spheres (200.0 ± 9.1 total ramifications in the CTX and 152.9 ± 11.3 in the CC, p = .004 by unpaired t‐test; Figure 4c). Similar to the human cells, the Sholl analysis of individual mGPCs revealed that cells in the CTX had increased branching at 10–35 μm distally from the cell body, the distance at which the complexity reaches the highest in cells occupying both compartments (p ≤ .01, two‐way ANOVA, followed by post hoc Bonferroni tests; Figure 4d). Data presented as mean ± SEM. n = 4 mice used as biological replicates with three measurements per mouse.
FIGURE 4.
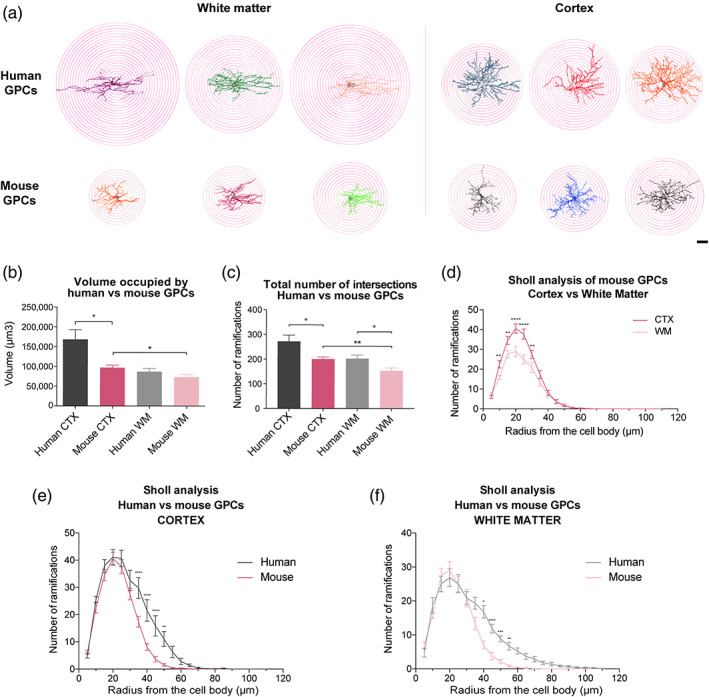
Human GPCs are larger and more complex than their mouse counterparts. (a) 2D projections of hGPCs and mGPCs 3D reconstructions in the CTX and WM, superimposed on the 5 μm radius spheres selected for the Sholl analysis. (b) hGPCs occupied larger volumes than mGPCs in the CTX but similar within the WM. mGPCs in the CTX occupied larger volumes than their counterparts in the underlying callosum. (c) hGPCs exhibited increased number of ramifications intersecting the Sholl's spheres than mGPCs, both in the CTX and callosum. mGPCs in the GM had higher number of ramifications intersecting the Sholl's spheres than mGPCs in the WM. (d) Sholl analysis of individual mGPCs showed that cells in the CTX were more complex than those in the WM at 15–35 μm distally from the cell body. (e, f) Sholl analysis revealed that hGPCs differ from mGPCs, with increased distal branching, both in the CTX (e) and WM (f). Mean ± SEM. *p < .05, **p < .01, ***p < .001 ****p < .0001 by unpaired t‐tests (b, c), and 2‐way ANOVA with Bonferroni's post hoc tests (d–f). n = 4 mice per group. Scale: 20 μm. GM, grey matter; hGPC, human glial progenitor cell; WM, white matter
3.6. Human cortical GPCs occupy larger domains than their mouse counterparts
We next used the reconstructed hGPCs from human glial chimeric mice and mGPCs from control mice to compare the volume occupancy between human and mouse GPCs within each compartment. hGPCs in the CTX were significantly larger than mGPCs (168,419 ± 24,632 vs. 97,002 ± 6269 μm3, p = .02 by unpaired t‐test). The average volume occupied by hGPCs was >1.7‐fold greater than that of murine GPCs. No significant differences were observed in the domain volumes of human and mouse GPCs in the white matter (human 86,795 ± 8024 vs. mouse 73,249 ± 7,358; p = .23, unpaired t‐test). Data presented as mean ± SEM. n = 4 mice used as biological replicates per group with three measurements per mouse (Figure 4b).
3.7. Human GPCs are more complex than mouse in both grey and white matter
Subsequently, we analyzed the fiber complexity of human and mouse GPCs. hGPCs in the CTX of the human chimeric mice exhibited significantly more ramifications intersecting the Sholl spheres than did mouse cells (271.1 ± 25.2 vs. 200.0 ± 9.1 ramifications; p = .02, unpaired t‐test; mean ± SEM. n = 4 mice per group, three measurements per mouse), and did so as well in sampled WM (202.2 ± 14.6 vs. 152.9 ± 11.7 ramifications, respectively; p = .02; Figure 4c). The Sholl analysis of these cells revealed differences in complexity manifested at a distance of 35–50 μm from the cell body, both for cells in the CTX and WM (p < .05 two‐way ANOVA, followed by post hoc Bonferroni tests; Figure 4e,f). The higher complexity of human cells was largely accounted for by their greater number of ramifications with greater distance from the cell body, suggesting that their increased branching is primarily due to their larger domain occupancy.
3.8. BAMBI and CHRDL1 expression distinguish white matter from cortical hGPCs
We found that the endogenous BMP antagonists BAMBI and CHRDL1 were selectively expressed by WM hGPCs in the adult WM, relative to both GM hGPCs, as well as to other WM cells. In light of the critical role of both BAMBI and CHRDL1 in inhibiting BMP4‐induced astrocytic fate (Sim et al., 2006; Sim et al., 2009), we selected these two targets for validation using in situ hybridization (ISH). Using a neonatal transplanted 42‐week‐old human glial chimeric mouse, we performed hybridization for Hs‐BAMBI and Hs‐CHRDL1 RNA fluorescent probes, using RNAscope® Multiplex Fluorescent v2 System in conjunction with the ACD HybEZ™ II Hybridization System (ACDBio). Since both BAMBI and CHRDL1 are highly differentially expressed by hGPCs relative to all other cell types in their surrounding brain (Sim et al., 2006), and since by 42‐weeks after neonatal chimerization there is complete or near‐complete replacement of mouse by human GPCs in both the cortex and CC (Windrem et al., 2014), we considered cells expressing either of these markers as hGPCs, and confirmed this by their co‐expression of PDGFRA (Figure 5).
FIGURE 5.
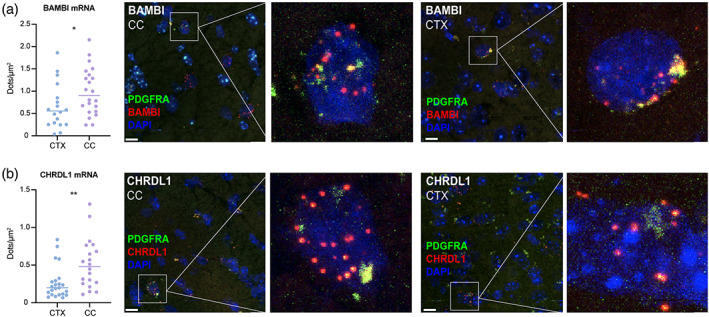
BAMBI and CHRDL1 are differentially expressed by WM hGPCs relative to cortical hGPCs. In neonatally chimerized human glial chimeric mice sacrificed as adults, the BAMBI and CHRDL1 mRNA signal intensity was significantly higher in hGPCs resident within the callosal white matter (CC) than in their cortical counterparts (CTX). (a, b) In this analysis using RNAScope detection, the number of RNA dots was normalized to the area of the nucleus. Representative images are shown of cells in both compartments expressing BAMBI (a) and CHRDL1 (b) (red, BAMBI and CHRDL1; blue, DAPI); PDGFRA as a marker of hGPCs, green. *p < .05, **p < .01, by Mann–Whitney test. Scale 10 μm. CTX, cortex, CC, corpus callosum.
On that basis, BAMBI and CHRDL1‐expressing cells were identified by the presence of fluorescent RNA dots, each representing a single transcript. High power confocal images were obtained from labeled cells in the CTX (layer IV‐VI) and CC using constant laser intensity and gain/voltage with respect to each individual probe. For each marker, the total number of RNA dots within the nucleus was determined in cells from the CTX and CC and normalized by the area occupied by each nucleus. Only nuclear transcripts were considered due to the lack of single cell resolution of the images required to detect extranuclear RNA on a single cell basis. The expression of BAMBI was significantly increased in cells within the CC compared to the adjacent cortical layers, demonstrated by the total number of dots per cell within the nucleus (CC 0.90 [0.24, 2.15] dots/μm2, n = 22, CTX 0.56 [0.04, 1.86] dots/μm2, n = 18), median [minimum, maximum], Mann–Whitney, p = .048. Similarly, the expression of CHRDL1 was also increased in the CC (0.48 [0.11, 1.31] dots/μm2, n = 20) compared to the CTX (0.20 [0.07, 0.84] dots/μm2, n = 23), median [minimum, maximum], Mann–Whitney, p = .003 (Figure 5). As noted, WM hGPCs selectively express BAMBI and CHRDL1 relative to all other white matter cells (Sim et al., 2006); these additional data indicate that WM hGPCs express higher levels of these transcripts than do GM hGPCs, and that this pattern of selective BMP inhibitor expression is retained in vivo in human glial chimeric mice.
4. DISCUSSION
In this study, we report that glial progenitor cells of the human neocortex and forebrain white matter differ substantially from one another in their size, complexity and patterns of gene expression. Both human and mouse cortical GPCs occupy larger domains and exhibit higher structural complexity than their counterparts in the callosal WM. Cells in each compartment express distinct transcriptional signatures, suggesting that key signaling pathways are regionally restricted and context‐dependent in adult hGPCs. In particular, genes promoting astrocytic gliogenesis are upregulated in GM hGPCs, while their antagonists are differentially‐expressed in WM hGPCs, in line with an enrichment in genes involved in oligodendrocyte specification in WM hGPCs. This suggests a selective bias in the fate of bipotential hGPCs toward astrocyte lineage in the GM, and oligodendrocyte differentiation in the WM. Tellingly, genes involved in cytoskeletal remodeling are enriched in the larger and more complex GM hGPCs, perhaps auguring their bias toward complex astrocytic morphologies. Lastly, NOTCH signaling is more pronounced in WM hGPCs, while WNT‐related genes are enriched in GM hGPCs, both critical pathways involved in the self‐renewal of GPCs (Figure 6).
FIGURE 6.
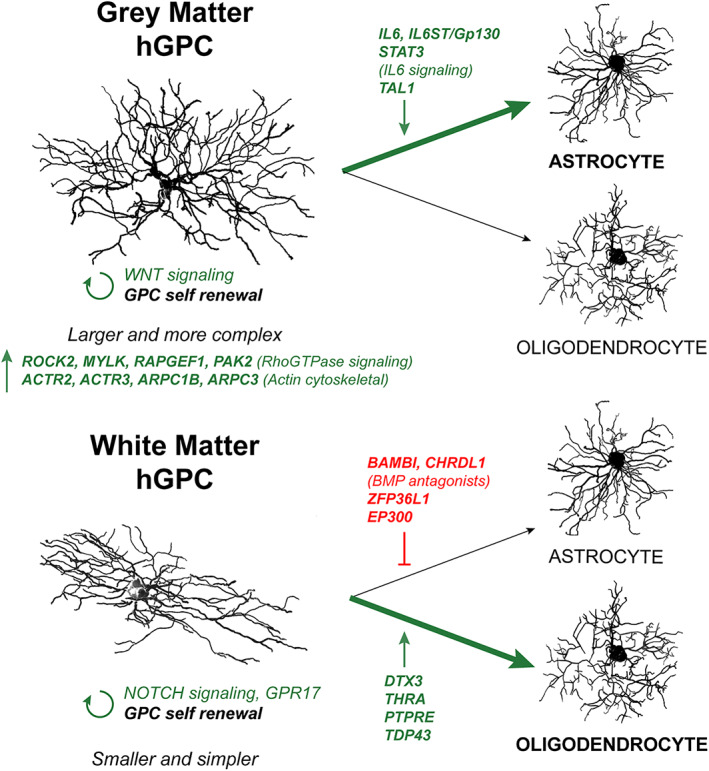
Key distinguishing features of GPCs of the human cortical grey matter and callosal white matter. Cortical hGPCs are larger and more complex than white matter hGPCs. Accordingly, they express genes involved in cytoskeletal function at higher levels compared to WM hGPCs. Whereas GM GPCs are enriched in pro‐astroglial transcripts involved in IL6 signaling, the expression of BMP antagonists by WM GPCs suggests an inhibition of astrogliogenesis at homeostatic baseline, favoring oligodendrocyte differentiation upon mobilization. GM, grey matter; hGPC, human glial progenitor cell; WM, white matter
While our data highlight broad differences in the operative pathways of grey and white matter‐resident hGPCs, the nature of bulk‐RNA microarray data does not allow us to conclude whether compartment‐selective transcripts are differentially expressed by all hGPCs in a uniform manner or, alternatively, whether net differential expression is driven by subpopulations within a larger, heterogenous pool. Such heterogeneity of oligodendrocyte lineage cells has been previously shown in both the developing and adult brain (Fu et al., 2021; Marques et al., 2016; Marques et al., 2018). Follow‐up studies using single‐cell RNA‐Seq of freshly sampled, normal adult human grey and white matter will be needed to address this question. That said, the distinct transcriptional signatures that we observed in our bulk RNA expression data suggests that glial progenitors within the environment of the cortical grey matter are more biased to acquire astrocytic fate and less prone to oligodendrocyte differentiation, whether uniformly so or as restricted to a subpopulation thereof.
Regardless of their compartment‐selective distinctions in gene expression, we noted that the density of hGPCs was as high in adult temporal cortex as in its subjacent subcortical white matter. The incidence of hGPCs in normal‐appearing human WM (NAWM) has previously been estimated as 140–150 cells/mm2 in 30 μm sections, corresponding to 4666–4839 cells/mm3 (Chang et al., 2000), slightly lower than suggested by our data. The differences in our respective estimates may derive from the dissimilar patient samples used: Chang and colleagues used NAWM sampled at autopsy from subjects with multiple sclerosis. In contrast, our data derived from subjects who underwent surgical resection of tissue for medication‐refractory epilepsy, and who demonstrated no other pathology besides mesial temporal sclerosis. While we cannot exclude any effect of seizure history on activity‐dependent glial proliferation or gene expression, in previous work, we had isolated hGPCs from epileptic and non‐epileptic white matter, and found similar relative proportions and multilineage competence in each (Nunes et al., 2003). Differences across studies in estimated hGPC densities might also have derived from differences in the histological methods used: Whereas Chang et al. used postmortem tissues, with their attendant delay in fixation, our samples were fresh surgical resections that were immediately immersion‐fixed, an important consideration since the NG2 antigen is highly susceptible to fixation delay (Staugaitis & Trapp, 2009). As such, NG2 immunostaining of autopsied tissue might be expected to underestimate the actual incidence of hGPCs.
The relatively higher percentage of hGPCs in the cortical grey matter should not be surprising; GPCs have functions beyond producing oligodendrocytes. They are involved in maintaining ionic and transmitter homeostasis, and hence can modulate synaptic firing thresholds, as well as serving as mobilizable pool of both oligodendroglial and astrocytic progenitors. Indeed, GPCs receive activity‐dependent synapses that affect their proliferation (Mangin et al., 2012) and their ablation affects glutaminergic systems so much so as to induce behavioral deficits in mouse models (Birey et al., 2015). Given their participation in the regulation of synaptic activity, the higher percentage of GPCs in the cortex may reflect their activity‐dependent response to the local cortical environment; this in turn may be both a cause and consequence of the apparent bias of these cells toward astrocytic fate in the GM.
Yet even using freshly fixed surgical resections, a number of difficulties impede the use of human brain tissue for reconstructing the fine structure of hGPCs in vivo, including the limited fixative and antibody penetration in immersion‐fixed autopsy samples, the low signal to noise ratio caused by NG2 antigen decay in suboptimally‐fixed specimens, and the disease history and inevitable pathology of human autopsied tissue. To circumvent these issues while still focusing on human cells in vivo, we also studied hGPCs resident within the mouse brain, using human glial chimeric mice (Goldman et al., 2012; Mariani et al., 2019). Perfusion fixation of these immunodeficient but otherwise normal brains allowed preservation of NG2 antigenicity, which enabled us to reconstruct the fiber architecture of GPCs within both GM and WM compartments.
In our study, both human and mouse GPCs proved larger and more complex in the CTX than subjacent WM, suggesting that GM and WM GPCs are fundamentally distinct, a possibility that was supported by our microarray data. While mouse GPCs derived from grey matter have been reported to be morphologically simpler than those of the WM (Lentferink et al., 2018), that study evaluated neonatal rodent GPCs in vitro, lending some caution to the predictive value of in vitro assessments of morphological complexity, in culture models that cannot replicate the complex signaling environment of the adult brain in vivo. Adding to this difficulty, neonatal and adult GPCs are fundamentally different phenotypes (Moyon et al., 2015; Windrem et al., 2004), so that the in vitro behavior of neonatal cells is not a strong predictor of the in vivo behavior of their adult derivatives.
We also noted that hGPCs occupy larger volumes and are structurally more complex than their mouse counterparts. Nonetheless, the differences between human and mouse GPCs were less pronounced than those between human and mouse astrocytes. Human astrocytes have >2.5‐fold larger diameter and approximately 16.5‐fold larger volume than corresponding mouse counterparts (Oberheim et al., 2009), compared to about 1.7‐fold larger volume in hGPCs compared to mGPCs. Together, these observations suggest that the major evolutionary leap in glial complexity occurred at the point of astrocytic differentiation. As our mapping results are restricted to cells in the lower layers of the frontoparietal CTX and underlying callosal WM, further studies would be required to extend these comparisons to other regions of the brain.
The expression patterns here described suggest that adult hGPCs within the GM and WM express distinct transcripts that govern astrocyte differentiation, oligodendrocyte specification and cytoskeleton remodeling. In accord with the increased complexity of GM GPCs, we noted the relative upregulation of genes involved in formation and maintenance of the actin cytoskeleton (ACTR2, ACTR3, ARPC3, ARPC1B). The branching and formation of processes by developing oligodendrocytes and astrocytes alike relies on cytoskeletal reorganization, and upon the organization of actin filaments and microtubules (Song et al., 2001; Wilson & Brophy, 1989), suggesting a similar role for this process in GPCs. Enrichment of genes involved in the RhoGTPase pathway, a highly conserved regulator of the actin cytoskeleton in neuronal morphogenesis (Hall & Lalli, 2010; Luo, 2000; Sebok et al., 1999), was also evidenced by the high expression of genes involved in RhoA and Rac1 signaling. In GPCs this pathway has been linked to cell polarization and cellular migration (Majumdar et al., 2003); NG2 has been found to regulate this pathway following phosphorylation of threonine 2256, or binding of the C‐terminal PDZ domain; this results in the activation of Rac and ROCK1/2, with a subsequent change in cell polarity, process outgrowth and migration (Biname et al., 2013). Interestingly, RhoA activity also regulates the contact inhibition of locomotion, and consequent tiling of colonizing cells (Sakry et al., 2014). Such tiling is a well‐described characteristic of GPCs (Hughes et al., 2013; Sakry et al., 2014), that has been attributed in part to the role of the non‐clustered protocadherin PCDH15 (Huang et al., 2020). Overall, this disparity in genes involved in cytoskeletal remodeling and maintenance, including those implicated in axonal and dendrite growth, may be driving the increased size and complexity of hGPCs in the GM compartment.
GM and WM hGPCs expressed transcriptional signatures suggestive of differential bias with respect to astrocytic fate. While GM hGPCs were enriched in genes involved in IL6 signaling, which promotes astrogenesis, their WM counterparts selectively expressed BMP antagonists, which are in turn inhibitory to acquisition of astrocyte fate. In line with these data, both BAMBI and CHRDL1 have been previously shown to be enriched in WM hGPCs (Sim et al., 2006; Sim et al., 2009). As adult GPCs are intrinsically bipotent and capable of generating both oligodendrocytes and astrocytes (Raff et al., 1983; Windrem et al., 2004), the environmental effects across different compartments possibly play a key role dictating their bias toward distinct phenotypes. However, whether those become cell‐intrinsic or if their ability to respond to their surroundings persists as they age remains an open question. While GPCs yet generate fibrous astrocytes in the WM, these data suggests that WM hGPCs may favor oligodendrocyte maturation over astrogenesis, possibly due to the increased demand to generate myelin producing cells within this compartment, which has previously been demonstrated in the mouse brain (Vigano et al., 2013). Concordantly, hGPCs in the WM were enriched in genes related to oligodendrocyte specification, including the T3 receptor THRA, the protein tyrosine phosphatase PTPRE and the TAR binding TDP43 (TARDBP; Billon, 2002; Peretz et al., 2000; Wang et al., 2018). In turn, GM hGPCs bias to astrogenesis may be adaptive to the increased synaptic activity within the grey matter, as astrocytes are required for synaptogenesis and maintenance of synaptic density within the cortex (Ullian et al., 2001). Their more complex morphometrics may also reflect their selective bias to generate protoplasmic astrocytes, which are more branched and complex than the WM fibrous astrocytes (Oberheim et al., 2009).
Subpopulations of GPCs can generate action potentials in response to glutamatergic and GABAergic inputs, which can elicit both excitatory and inhibitory postsynaptic currents (IPSCs; Bergles et al., 2000; Dimou & Gallo, 2015; Karadottir et al., 2008; Lin & Bergles, 2004). GPCs across different regions, including the GM and WM, differ in their K(+)‐ and Na(+)‐channel expression profiles and display distinct membrane properties and consequent physiological activity (Chittajallu et al., 2004). In fact, the oligodendroglial heterogeneity described at a transcriptome level (Marques et al., 2018) is paired with functional heterogeneity across regions, within regions, age and stage of maturation (Spitzer et al., 2019). As neuronal activity influences oligodendrocyte development and myelination (Gibson et al., 2014), the morphology of GPCs also seems to be regulated by activity‐dependent glutamatergic inputs through activation of their AMPA receptors (Fannon et al., 2015). As cells in each compartment have distinct inputs and post‐synaptic responses, those may influence the morphology and complexity of GPCs, such that GM GPCs may acquire a transcriptional signature and morphology that suggests their assumption of cortical neuronal and synaptic support, over and above those of axonal support and oligodendrocyte production in the WM, for which increased branching and surface area may be adaptive.
Lastly, WM hGPCs were enriched in key genes involved in the NOTCH signaling pathway which is key in GPC self‐renewal. Both the bHLH (basic helix–loop–helix) signal effectors HES1 and HES5, and the G protein‐coupled receptor GPR17, were significantly upregulated, suggesting their role in the maintenance of the white matter GPC pool, promoting their undifferentiated expansion while inhibiting premature oligodendrocyte differentiation. NOTCH1 receptors and ligands have been previously shown to be expressed by murine GPCs before the onset of developmental myelination (Wang et al., 1998), as well as in the context of demyelination, inhibiting precocious differentiation and promoting the expansion of the progenitor pool (Zhang et al., 2009). WM hGPCs also express both NOTCH1 receptor and its ligand Jagged1, suggesting the existence of a self‐inhibitory loop within the progenitor pool itself (Sim et al., 2006). In turn, GM hGPCs are less prone to differentiate as myelinating oligodendrocytes compared to their WM counterparts (Dimou et al., 2008; Vigano et al., 2013) and the enriched expression of the Wnt/CTNNB1 signaling downstream effectors LEF1 and ETS2 may comprise an underlying molecular mechanism preventing terminal oligodendroglial differentiation. Wnt signaling plays a key role in the regulation of oligodendroglial fate (Fancy et al., 2009), and pathologically high Wnt/β‐catenin signaling leads to maturation and myelination failure (Fancy et al., 2009, 2014). However, a basal level of Wnt signaling is required for the self‐renewal and maintenance of hGPCs (Goldman & Osorio, 2014), and may be also permissive for the transition from GPCs to immature oligodendrocytes (Guo et al., 2015).
Overall, these data suggest the existence of distinct phenotypes of hGPCs within the GM and WM, each unique in their morphometries and gene expression. Whether these are emergent properties of location‐specific signals that then become cell‐intrinsic, or whether they remain malleable by environmental signals, remains unclear. Regardless, the effective bias of human GM GPCs to astrocytic fate, and that of their WM counterparts to oligodendrocytic development, and our identification of their respective dominant transcriptionally defined signaling pathways, offers the potential for modulating both their mobilization and differentiation competence going forward.
AUTHOR CONTRIBUTIONS
Maria Joana Osorio designed the study, performed the histological processing, imaging, and quantitative analyses. John N. Mariani and Adam Cornwell performed the genomic analysis, Lisa Zou performed the RNA scope experiments, Steven J. Schanz performed the transplants to produce the glial chimeric mice, and Kate Heffernan assisted in imaging and quantitative analysis. Together with Maria Joana Osorio, Steven A. Goldman designed the study, analyzed data and wrote the manuscript.
CONFLICT OF INTEREST
Dr. Goldman is also a part‐time employee and stock‐holder of Sana Biotechnology, a cell therapy company, and his lab receives sponsored research support from Sana. Maria Joana Osorio is currently employed at Sana. However, none of the work in this report was supported by Sana. No other authors have any known conflicts of interest in regard to this work.
Supporting information
Table S1. Differential Expression of genes between compartments (Excel file with 3 tabs, submitted as three separate files: Table S1 ‐ Table 1. WM vs GM GPC, Table S1 ‐ Table 2. WM GPC vs Tissue, Table S1 ‐ Table 1. GM GPC vs Tissue)
Table S2. Curated IPA terms and Genes
ACKNOWLEDGMENTS
This work was supported by NINDS (R01NS110776) and NIA (R01AG072298), the Adelson Medical Research Foundation, and the Novo Nordisk Foundation. All genomic data have been deposited to GEO, accession number: GSE29796 (https://www.ncbi.nlm.nih.gov/geo/query/acc.cgi).
Osorio, M. J. , Mariani, J. N. , Zou, L. , Schanz, S. J. , Heffernan, K. , Cornwell, A. , & Goldman, S. A. (2023). Glial progenitor cells of the adult human white and grey matter are contextually distinct. Glia, 71(3), 524–540. 10.1002/glia.24291
Funding information Dr. Miriam and Sheldon G. Adelson Medical Research Foundation; National Institute of Neurological Disorders and Stroke, Grant/Award Number: R01NS110776; National Institute on Aging, Grant/Award Number: R01AG072298; Novo Nordisk Fonden
Contributor Information
Maria Joana Osorio, Email: joana_osorio@URMC.Rochester.edu.
Steven A. Goldman, Email: steven_goldman@urmc.rochester.edu.
DATA AVAILABILITY STATEMENT
All genomic data have been deposited to GEO, accession number GSE29796 (https://www.ncbi.nlm.nih.gov/geo/query/acc.cgi). R analysis script and processed data can be assessed at Github.com/CTNGoldmanLab/Adult_WM_vs_GM_hGPC_2021.
REFERENCES
- Auvergne, R. M. , Sim, F. J. , Wang, S. , Chandler‐Militello, D. , Burch, J. , Al Fanek, Y. , Davis, D., Benraiss, A., Walter, K., Achanta, P., Johnson, M., Quinones‐Hinojosa, A., Natesan, N., Ford, H. L., & Goldman, S. A. (2013). Transcriptional differences between normal and glioma‐derived glial progenitor cells identify a core set of dysregulated genes. CELREP, 3(6), 2127–2141. 10.1016/j.celrep.2013.04.035 [DOI] [PMC free article] [PubMed] [Google Scholar]
- Avilion, A. A., Nicolis, S. K., Pevny, L. H., Perez, L., Vivian, N., & Lovell‐Badge, R. (2003). Multipotent cell lineages in early mouse development depend on SOX2 function. Genes & Development, 17(1), 126–140. 10.1101/gad.224503 [DOI] [PMC free article] [PubMed] [Google Scholar]
- Belachew, S. , Chittajallu, R. , Aguirre, A. A. , Yuan, X. , Kirby, M. , Anderson, S. , & Gallo, V. (2003). Postnatal NG2 proteoglycan‐expressing progenitor cells are intrinsically multipotent and generate functional neurons. The Journal of Cell Biology, 161(1), 169–186. 10.1083/jcb.200210110 [DOI] [PMC free article] [PubMed] [Google Scholar]
- Benraiss, A. , Toner, M. J. , Xu, Q. , Bruel‐Jungerman, E. , Rogers, E. H. , Wang, F. , Economides, A. N., Davidson, B. L., Kageyama, R., Nedergaard, M., & Goldman, S. A. (2013). Sustained mobilization of endogenous neural progenitors delays disease progression in a transgenic model of Huntington's disease. Cell Stem Cell, 12(6), 787–799. 10.1016/j.stem.2013.04.014 [DOI] [PMC free article] [PubMed] [Google Scholar]
- Bergles, D. E. , Roberts, J. D. , Somogyi, P. , & Jahr, C. E. (2000). Glutamatergic synapses on oligodendrocyte precursor cells in the hippocampus. Nature, 405(6783), 187–191. 10.1038/35012083 [DOI] [PubMed] [Google Scholar]
- Billon, N., Jolicoeur, D., Tokumoto, Y., Vennström, B., & Raff, M. (2002). Normal timing of oligodendrocyte development depends on thyroid hormone receptor alpha 1 (TRalpha1). The EMBO Journal, 21(23), 6452–6460. 10.1093/emboj/cdf662 [DOI] [PMC free article] [PubMed] [Google Scholar]
- Biname, F. , Sakry, D. , Dimou, L. , Jolivel, V. , & Trotter, J. (2013). NG2 regulates directional migration of oligodendrocyte precursor cells via rho GTPases and polarity complex proteins. The Journal of Neuroscience, 33(26), 10858–10874. 10.1523/JNEUROSCI.5010-12.2013 [DOI] [PMC free article] [PubMed] [Google Scholar]
- Birey, F. , Kloc, M. , Chavali, M. , Hussein, I. , Wilson, M. , Christoffel, D. J. , Chen, T., Frohman, M. A., Robinson, J. K., Russo, S. J., Maffei, A., & Aguirre, A. (2015). Genetic and stress‐induced loss of NG2 glia triggers emergence of depressive‐like behaviors through reduced secretion of FGF2. Neuron, 88(5), 941–956. 10.1016/j.neuron.2015.10.046 [DOI] [PMC free article] [PubMed] [Google Scholar]
- Bonaguidi, M. A., McGuire, T., Hu, M., Kan, L., Samanta, J., & Kessler, J. A. (2005). LIF and BMP signaling generate separate and discrete types of GFAP‐expressing cells. Development (Cambridge, England), 132(24), 5503–5514. 10.1242/dev.02166 [DOI] [PubMed] [Google Scholar]
- Bonni, A. , Sun, Y. , Nadal‐Vicens, M. , Bhatt, A. , Frank, D. A. , Rozovsky, I. , Stahl, N., Yancopoulos, G. D., & Greenberg, M. E. (1997). Regulation of gliogenesis in the central nervous system by the JAK‐STAT signaling pathway. Science, 278(5337), 477–483. 10.1126/science.278.5337.477 [DOI] [PubMed] [Google Scholar]
- Cao, F. , Hata, R. , Zhu, P. , Nakashiro, K.‐i. , & Sakanaka, M. (2010). Conditional deletion of Stat3 promotes neurogenesis and inhibits astrogliogenesis in neural stem cells. Biochemical and Biophysical Research Communications, 394(3), 843–847. 10.1016/j.bbrc.2010.03.092 [DOI] [PubMed] [Google Scholar]
- Chang, A. , Nishiyama, A. , Peterson, J. , Prineas, J. , & Trapp, B. D. (2000). NG2‐positive oligodendrocyte progenitor cells in adult human brain and multiple sclerosis lesions. The Journal of Neuroscience, 20(17), 6404–6412. 10.1523/JNEUROSCI.20-17-06404.2000 [DOI] [PMC free article] [PubMed] [Google Scholar]
- Chen, Y. , Wu, H. , Wang, S. , Koito, H. , Li, J. , Ye, F. , Hoang, J., Escobar, S. S., Gow, A., Arnett, H. A., Trapp, B. D, Karandikar, N. J., Hsieh, J., & Lu, Q. R. (2009). The oligodendrocyte‐specific G protein–coupled receptor GPR17 is a cell‐intrinsic timer of myelination. Nature Neuroscience, 12(11), 1398–1406. 10.1038/nn.2410 [DOI] [PMC free article] [PubMed] [Google Scholar]
- Chittajallu, R. , Aguirre, A. , & Gallo, V. (2004). NG2‐positive cells in the mouse white and grey matter display distinct physiological properties. The Journal of Physiology, 561(Pt 1), 109–122. 10.1113/jphysiol.2004.074252 [DOI] [PMC free article] [PubMed] [Google Scholar]
- Crawford, A. H. , Tripathi, R. B. , Richardson, W. D. , & Franklin, R. J. M. (2016). Developmental origin of oligodendrocyte lineage cells determines response to demyelination and susceptibility to age‐associated functional decline. Cell Reports, 15(4), 761–773. 10.1016/j.celrep.2016.03.069 [DOI] [PMC free article] [PubMed] [Google Scholar]
- Cui, X.‐Y. , Hu, Q.‐D. , Tekaya, M. , Shimoda, Y. , Ang, B.‐T. , Nie, D.‐Y. , Sun, L., Hu, W.‐P., Karsak, M., Duka, T., Takeda, Y., Ou, L.‐Y., Dawe, G. S., Yu, F.‐G., Ahmed, S., Jin, L.‐H., Schachner, M., Watanabe, K., Arsenijevik, Y., & Xiao, Z.‐C. (2004). NB‐3/Notch1 pathway via Deltex1 promotes neural progenitor cell differentiation into oligodendrocytes. Journal of Biological Chemistry, 279(24), 25858–25865. 10.1074/jbc.M313505200 [DOI] [PubMed] [Google Scholar]
- Dawson, M. R. , Polito, A. , Levine, J. M. , & Reynolds, R. (2003). NG2‐expressing glial progenitor cells: An abundant and widespread population of cycling cells in the adult rat CNS. Molecular and Cellular Neurosciences, 24(2), 476–488. 10.1016/S1044-7431(03)00210-0 [DOI] [PubMed] [Google Scholar]
- Dimou, L. , & Gallo, V. (2015). NG2‐glia and their functions in the central nervous system. Glia, 63(8), 1429–1451. 10.1002/glia.22859 [DOI] [PMC free article] [PubMed] [Google Scholar]
- Dimou, L. , Simon, C. , Kirchhoff, F. , Takebayashi, H. , & Gotz, M. (2008). Progeny of Olig2‐expressing progenitors in the gray and white matter of the adult mouse cerebral cortex. The Journal of Neuroscience, 28(41), 10434–10442. 10.1523/JNEUROSCI.2831-08.2008 [DOI] [PMC free article] [PubMed] [Google Scholar]
- Falcao, A. M. , van Bruggen, D. , Marques, S. , Meijer, M. , Jakel, S. , Agirre, E. , Samudyata, Floriddia, E. M., Vanichkina, V. P., ffrench‐Constant, C., Williams, A., Guerreiro‐Cacais, A. O., & Castelo‐Branco, G. (2018). Disease‐specific oligodendrocyte lineage cells arise in multiple sclerosis. Nature Medicine, 24(12), 1837–1844. 10.1038/s41591-018-0236-y [DOI] [PMC free article] [PubMed] [Google Scholar]
- Fancy, S. P. J. , Baranzini, S. E. , Zhao, C. , Yuk, D.‐I. , Irvine, K.‐A. , Kaing, S. , Sanai, M., Franklin, R. J. M., & Rowitch, D. H. (2009). Dysregulation of the Wnt pathway inhibits timely myelination and remyelination in the mammalian CNS. Genes & Development, 23(13), 1571–1585. 10.1101/gad.1806309 [DOI] [PMC free article] [PubMed] [Google Scholar]
- Fancy, S. P. J. , Harrington, E. P. , Baranzini, S. E. , Silbereis, J. C. , Shiow, L. R. , Yuen, T. J. , Huang, E. J., Lomvardas, S. & Rowitch, D. H. (2014). Parallel states of pathological Wnt signaling in neonatal brain injury and colon cancer. Nature Publishing Group, 17(4), 506–512. 10.1038/nn.3676 [DOI] [PMC free article] [PubMed] [Google Scholar]
- Fannon, J. , Tarmier, W. , & Fulton, D. (2015). Neuronal activity and AMPA‐type glutamate receptor activation regulates the morphological development of oligodendrocyte precursor cells. Glia, 63(6), 1021–1035. 10.1002/glia.22799 [DOI] [PubMed] [Google Scholar]
- Floriddia, E. M. , Lourenco, T. , Zhang, S. , van Bruggen, D. , Hilscher, M. M. , Kukanja, P. , Gonçalves dos Santos, J. P., Alk, M, Altinkok, M., Yokota, C., Llorens‐Bobadilla, E., Mulinyawe, S. B. , Graos, M., Sun, L. O., Frisen, J., Nilsson, M., & Castelo‐Branco, G. (2020). Distinct oligodendrocyte populations have spatial preference and different responses to spinal cord injury. Nature Communications, 11(1), 5860. 10.1038/s41467-020-19453-x [DOI] [PMC free article] [PubMed] [Google Scholar]
- Fu, Y. , Yang, M. , Yu, H. , Wang, Y. , Wu, X. , Yong, J. , Mao, Y., Cui, Y., Fan, X., Wen, L, Qiao, J., & Tang, F. (2021). Heterogeneity of glial progenitor cells during the neurogenesis‐to‐gliogenesis switch in the developing human cerebral cortex. Cell Reports, 34(9), 108788. 10.1016/j.celrep.2021.108788 [DOI] [PubMed] [Google Scholar]
- Garcia‐Mata, R. , Boulter, E. , & Burridge, K. (2011). The ‘invisible hand’: Regulation of RHO GTPases by RHOGDIs. Nature Reviews. Molecular Cell Biology, 12(8), 493–504. 10.1038/nrm3153 [DOI] [PMC free article] [PubMed] [Google Scholar]
- Genoud, S. , Lappe‐Siefke, C. , Goebbels, S. , Radtke, F. , Aguet, M. , Scherer, S. S. , Suter, U., Nave, K.‐A., &. Mantei, N. (2002). Notch1 control of oligodendrocyte differentiation in the spinal cord. The Journal of Cell Biology, 158(4), 709–718. 10.1083/jcb.200202002 [DOI] [PMC free article] [PubMed] [Google Scholar]
- Gibson, E. M. , Purger, D. , Mount, C. W. , Goldstein, A. K. , Lin, G. L. , Wood, L. S. , Inema, I., Miller, S. E., Bieri, G., Zuchero, J. B., Barres, B. B., Woo, P. J., Vogel, H., & Monje, M. (2014). Neuronal activity promotes oligodendrogenesis and adaptive myelination in the mammalian brain. Science, 344(6183), 1252304. 10.1126/science.1252304 [DOI] [PMC free article] [PubMed] [Google Scholar]
- Goldman, S. A. , Nedergaard, M. , & Windrem, M. S. (2012). Glial progenitor cell‐based treatment and modeling of neurological disease. Science, 338(6106), 491–495. 10.1126/science.1218071 [DOI] [PMC free article] [PubMed] [Google Scholar]
- Goldman, S. A. , Nedergaard, M. , & Windrem, M. S. (2015). Modeling cognition and disease using human glial chimeric mice. Glia, 63(8), 1483–1493. 10.1002/glia.22862 [DOI] [PMC free article] [PubMed] [Google Scholar]
- Goldman, S. A. , & Osorio, J. (2014). So many progenitors, so little myelin. Nature Neuroscience, 17(4), 483–485. 10.1038/nn.3685 [DOI] [PMC free article] [PubMed] [Google Scholar]
- Gundersen, H. J. , Jensen, E. B. , Kieu, K. , & Nielsen, J. (1999). The efficiency of systematic sampling in stereology—reconsidered. Journal of Microscopy, 193(Pt 3), 199–211. 10.1046/j.1365-2818.1999.00457.x [DOI] [PubMed] [Google Scholar]
- Guo, F. , Lang, J. , Sohn, J. , Hammond, E. , Chang, M. , & Pleasure, D. (2015). Canonical Wnt signaling in the oligodendroglial lineage—puzzles remain. Glia, 63(10), 1671–1693. 10.1002/glia.22813 [DOI] [PubMed] [Google Scholar]
- Hall, A. , & Lalli, G. (2010). Rho and Ras GTPases in axon growth, guidance, and branching. Cold Spring Harbor Perspectives in Biology, 2(2), a001818. 10.1101/cshperspect.a001818 [DOI] [PMC free article] [PubMed] [Google Scholar]
- Han, X. , Chen, M. , Wang, F. , Windrem, M. , Wang, S. , Shanz, S. , Xu, Q., Oberheim, N. A., Bekar, L., Betstadt, S., Silva, A. J., Takano, T., Goldman, S. A., & Nedergaard, M. (2013). Forebrain engraftment by human glial progenitor cells enhances synaptic plasticity and learning in adult mice. Cell Stem Cell, 12(3), 342–353. 10.1016/j.stem.2012.12.015 [DOI] [PMC free article] [PubMed] [Google Scholar]
- Hill, R. A. , Patel, K. D. , Medved, J. , Reiss, A. M. , & Nishiyama, A. (2013). NG2 cells in white matter but not gray matter proliferate in response to PDGF. The Journal of Neuroscience, 33(36), 14558–14566. 10.1523/JNEUROSCI.2001-12.2013 [DOI] [PMC free article] [PubMed] [Google Scholar]
- Hu, Q.‐D. , Ang, B.‐T. , Karsak, M. , Hu, W.‐P. , Cui, X.‐Y. , Duka, T. , Takeda, Y., Chia, W., Sankar, N., Ng, Y.‐K., Ling, E.‐A., M Xiao, Z.‐C. (2003). F3/contactin acts as a functional ligand for Notch during oligodendrocyte maturation. Cell, 115(2), 163–175. 10.1016/S0092-8674(03)00810-9 [DOI] [PubMed] [Google Scholar]
- Huang, W. , Bhaduri, A. , Velmeshev, D. , Wang, S. , Wang, L. , Rottkamp, C. A. , Alvarez‐Buylla, A., Rowitch, D. H., & Kriegstein, A. R. (2020). Origins and proliferative states of human oligodendrocyte precursor cells. Cell, 182, 594–608.e11. 10.1016/j.cell.2020.06.027 [DOI] [PMC free article] [PubMed] [Google Scholar]
- Huang, W. , Zhao, N. , Bai, X. , Karram, K. , Trotter, J. , Goebbels, S. , Scheller, A., & Kirchhoff, F. (2014). Novel NG2‐CreERT2 knock‐in mice demonstrate heterogeneous differentiation potential of NG2 glia during development. Glia, 62(6), 896–913. 10.1002/glia.22648 [DOI] [PubMed] [Google Scholar]
- Hughes, E. G. , Kang, S. H. , Fukaya, M. , & Bergles, D. E. (2013). Oligodendrocyte progenitors balance growth with self‐repulsion to achieve homeostasis in the adult brain. Nature Neuroscience, 16(6), 668–676. 10.1038/nn.3390 [DOI] [PMC free article] [PubMed] [Google Scholar]
- Irizarry, R. A. , Hobbs, B. , Collin, F. , Beazer‐Barclay, Y. D. , Antonellis, K. J. , Scherf, U. , & Speed, T. P. (2003). Exploration, normalization, and summaries of high density oligonucleotide array probe level data. Biostatistics (Oxford, England), 4(2), 249–264. 10.1093/biostatistics/4.2.249 [DOI] [PubMed] [Google Scholar]
- Jakel, S. , Agirre, E. , Mendanha Falcao, A. , van Bruggen, D. , Lee, K. W. , Knuesel, I. , Malhotra, D., ffrench‐Constant, C., Williams, A., & Castelo‐Branco, G. (2019). Altered human oligodendrocyte heterogeneity in multiple sclerosis. Nature, 566(7745), 543–547. 10.1038/s41586-019-0903-2 [DOI] [PMC free article] [PubMed] [Google Scholar]
- Johnson, W. E. , Li, C. , & Rabinovic, A. (2007). Adjusting batch effects in microarray expression data using empirical Bayes methods. Biostatistics (Oxford, England), 8(1), 118–127. 10.1093/biostatistics/kxj037 [DOI] [PubMed] [Google Scholar]
- Karadottir, R. , Hamilton, N. B. , Bakiri, Y. , & Attwell, D. (2008). Spiking and nonspiking classes of oligodendrocyte precursor glia in CNS white matter. Nature Neuroscience, 11(4), 450–456. 10.1038/nn2060 [DOI] [PMC free article] [PubMed] [Google Scholar]
- Kondo, T. , & Raff, M. (2000). Basic helix‐loop‐helix proteins and the timing of oligodendrocyte differentiation. Development (Cambridge, England), 127(14), 2989–2998. 10.1242/dev.127.14.2989 [DOI] [PubMed] [Google Scholar]
- Leitman, E. M. , Tewari, A. , Horn, M. , Urbanski, M. , Damanakis, E. , Einheber, S. , Salzer, J. L., Lanerolle, P., & Melendez‐Vasquez, C. V. (2011). MLCK regulates Schwann cell cytoskeletal organization, differentiation and myelination. Journal of Cell Science, 124(Pt 22), 3784–3796. 10.1242/jcs.080200 [DOI] [PMC free article] [PubMed] [Google Scholar]
- Lentferink, D. H. , Jongsma, J. M. , Werkman, I. , & Baron, W. (2018). Grey matter OPCs are less mature and less sensitive to IFNgamma than white matter OPCs: Consequences for remyelination. Scientific Reports, 8(1), 2113. 10.1038/s41598-018-19934-6 [DOI] [PMC free article] [PubMed] [Google Scholar]
- Li, N. , Han, J. , Tang, J. , & Ying, Y. (2018). IGFBP‐7 inhibits the differentiation of oligodendrocyte precursor cells via regulation of Wnt/beta‐catenin signaling. Journal of Cellular Biochemistry, 119(6), 4742–4750. 10.1002/jcb.26654 [DOI] [PubMed] [Google Scholar]
- Liang, X. , Draghi, N. A. , & Resh, M. D. (2004). Signaling from integrins to Fyn to rho family GTPases regulates morphologic differentiation of oligodendrocytes. The Journal of Neuroscience, 24(32), 7140–7149. 10.1523/JNEUROSCI.5319-03.2004 [DOI] [PMC free article] [PubMed] [Google Scholar]
- Lin, S. C. , & Bergles, D. E. (2004). Synaptic signaling between neurons and glia. Glia, 47(3), 290–298. 10.1002/glia.20060 [DOI] [PubMed] [Google Scholar]
- Lu, C. , Dong, L. , Zhou, H. , Li, Q. , Huang, G. , Bai, S. J. , & Liao, L. (2018). G‐protein‐coupled receptor Gpr17 regulates oligodendrocyte differentiation in response to Lysolecithin‐induced demyelination. Scientific Reports, 8(1), 4502. 10.1038/s41598-018-22452-0 [DOI] [PMC free article] [PubMed] [Google Scholar]
- Luo, L. (2000). Rho GTPases in neuronal morphogenesis. Nature Reviews. Neuroscience, 1(3), 173–180. 10.1038/35044547 [DOI] [PubMed] [Google Scholar]
- Mabie, P. C. , Mehler, M. F. , Marmur, R. , Papavasiliou, A. , Song, Q. , & Kessler, J. A. (1997). Bone morphogenetic proteins induce astroglial differentiation of oligodendroglial‐astroglial progenitor cells. Journal of Neuroscience, 17(11), 4112–4120. 10.1523/JNEUROSCI.17-11-04112.1997 [DOI] [PMC free article] [PubMed] [Google Scholar]
- Majumdar, M. , Vuori, K. , & Stallcup, W. B. (2003). Engagement of the NG2 proteoglycan triggers cell spreading via rac and p130cas. Cellular Signalling, 15(1), 79–84 10.1016/S0898-6568(02)00045-1 [DOI] [PubMed] [Google Scholar]
- Mangin, J. M. , Li, P. , Scafidi, J. , & Gallo, V. (2012). Experience‐dependent regulation of NG2 progenitors in the developing barrel cortex. Nature Neuroscience, 15(9), 1192–1194. 10.1038/nn.3190 [DOI] [PMC free article] [PubMed] [Google Scholar]
- Mariani, J. N. , Zou, L. , & Goldman, S. A. (2019). Human glial chimeric mice to define the role of glial pathology in human disease. Methods in Molecular Biology, 1936, 311–331. 10.1007/978-1-4939-9072-6_18 [DOI] [PMC free article] [PubMed] [Google Scholar]
- Marisca, R. , Hoche, T. , Agirre, E. , Hoodless, L. J. , Barkey, W. , Auer, F. , Castelo‐Branco, G., & Czopka, T. (2020). Functionally distinct subgroups of oligodendrocyte precursor cells integrate neural activity and execute myelin formation. Nature Neuroscience, 23(3), 363–374. 10.1038/s41593-019-0581-2 [DOI] [PMC free article] [PubMed] [Google Scholar]
- Marques, S. , van Bruggen, D. , Vanichkina, D. P. , Floriddia, E. M. , Munguba, H. , Varemo, L. , Giacomello, S., Falcao A. M., Meijer, M., Bjorklund, A. K., Hjerling‐Leffler J., Taft, R. J., & Castelo‐Branco, G. (2018). Transcriptional convergence of oligodendrocyte lineage progenitors during development. Developmental Cell, 46(4), 504–517. 10.1016/j.devcel.2018.07.005 [DOI] [PMC free article] [PubMed] [Google Scholar]
- Marques, S. , Zeisel, A. , Codeluppi, S. , van Bruggen, D. , Mendanha Falcao, A. , Xiao, L. , Li, H., Haring, M., Hochgerner, H., Romanov, R. A., Gyllborg, D., Munoz‐Manchado , A. B., La Manno, G., Lonnerberg, P., Floriddia, E. M., Rezayee, F., Ernfors, P., Arenas, E., Hjerling‐Leffler, J., & Castelo‐Branco, G. (2016). Oligodendrocyte heterogeneity in the mouse juvenile and adult central nervous system. Science, 352(6291), 1326–1329. 10.1126/science.aaf6463 [DOI] [PMC free article] [PubMed] [Google Scholar]
- Melendez‐Vasquez, C. V. , Einheber, S. , & Salzer, J. L. (2004). Rho kinase regulates schwann cell myelination and formation of associated axonal domains. The Journal of Neuroscience, 24(16), 3953–3963. 10.1523/JNEUROSCI.4920-03.2004 [DOI] [PMC free article] [PubMed] [Google Scholar]
- Moyon, S. , Dubessy, A. L. , Aigrot, M. S. , Trotter, M. , Huang, J. K. , Dauphinot, L. , Potier, M. C., Kerninon, C., Parsadaniantz, S. M., Franklin, R. J. M., & Lubetzki, C. (2015). Demyelination causes adult CNS progenitors to revert to an immature state and express immune cues that support their migration. The Journal of Neuroscience, 35(1), 4–20. 10.1523/JNEUROSCI.0849-14.2015 [DOI] [PMC free article] [PubMed] [Google Scholar]
- Nakanishi, M. , Niidome, T. , Matsuda, S. , Akaike, A. , Kihara, T. , & Sugimoto, H. (2007). Microglia‐derived interleukin‐6 and leukaemia inhibitory factor promote astrocytic differentiation of neural stem/progenitor cells. The European Journal of Neuroscience, 25(3), 649–658. 10.1111/j.1460-9568.2007.05309.x [DOI] [PubMed] [Google Scholar]
- Nunes, M. C. , Roy, N. S. , Keyoung, H. M. , Goodman, R. R. , McKhann, G., 2nd , Jiang, L. , Kang, J., Nedergaard, M., & Goldman, S. A. (2003). Identification and isolation of multipotential neural progenitor cells from the subcortical white matter of the adult human brain. Nature Medicine, 9(4), 439–447. 10.1038/nm837 [DOI] [PubMed] [Google Scholar]
- Oberheim, N. A. , Takano, T. , Han, X. , He, W. , Lin, J. H. , Wang, F. , Xu, Q., Wyatt, J. D., Pilcher, W., Ojemann, J. G., Ranson, B. R., Goldman, S. A., & Nedergaard, M. (2009). Uniquely hominid features of adult human astrocytes. The Journal of Neuroscience, 29(10), 3276–3287. 10.1523/JNEUROSCI.4707-08.2009 [DOI] [PMC free article] [PubMed] [Google Scholar]
- Onichtchouk, D. , Chen, Y. G. , Dosch, R. , Gawantka, V. , Delius, H. , Massague, J. , & Niehrs, C. (1999). Silencing of TGF‐beta signalling by the pseudoreceptor BAMBI. Nature, 401(6752), 480–485. 10.1038/46794 [DOI] [PubMed] [Google Scholar]
- Ou, Z. , Sun, Y. , Lin, L. , You, N. , Liu, X. , Li, H. , Ma, Y., Cao, L. Han, Y., Liu, M., Deng, Y., Yao, L., Lu, R., & Chen, Y. (2016). Olig2‐targeted G‐protein‐coupled receptor Gpr17 regulates oligodendrocyte survival in response to Lysolecithin‐induced demyelination. The Journal of Neuroscience, 36(41), 10560–10573. 10.1523/JNEUROSCI.0898-16.2016 [DOI] [PMC free article] [PubMed] [Google Scholar]
- Pagès, H. C. M. , Falcon, S. , & Li, N. (2017). AnnotationDbi: Annotation Database Interface. https://bioconductor.org/packages/AnnotationDbi
- Peretz, A. , Gil‐Henn, H. , Sobko, A. , Shinder, V. , Attali, B. , & Elson, A. (2000). Hypomyelination and increased activity of voltage‐gated K +channels in mice lacking protein tyrosine phosphatase ϵ. The EMBO Journal, 19(15), 4036–4045. 10.1093/emboj/19.15.4036 [DOI] [PMC free article] [PubMed] [Google Scholar]
- Pevny, L. H. , Sockanathan, S. , Placzek, M. , & Lovell‐Badge, R. (1998). A role for SOX1 in neural determination. Development (Cambridge, England), 125(10), 1967–1978. 10.1242/dev.125.10.1967 [DOI] [PubMed] [Google Scholar]
- Psachoulia, K. , Jamen, F. , Young, K. M. , & Richardson, W. D. (2009). Cell cycle dynamics of NG2 cells in the postnatal and ageing brain. Neuron Glia Biology, 5(3–4), 57–67. 10.1017/S1740925X09990354 [DOI] [PMC free article] [PubMed] [Google Scholar]
- R Core Team . (2017). R: A language and environment for statistical computing. R Foundation for Statistical Computing; https://www.R-project.org [Google Scholar]
- Raff, M. C. , Miller, R. H. , & Noble, M. (1983). A glial progenitor cell that develops in vitro into an astrocyte or an oligodendrocyte depending on culture medium. Nature, 303(5916), 390–396. 10.1038/303390a0 [DOI] [PubMed] [Google Scholar]
- Ritchie, M. E. , Phipson, B. , Wu, D. , Hu, Y. , Law, C. W. , Shi, W. , & Smyth, G. K. (2015). Limma powers differential expression analyses for RNA‐sequencing and microarray studies. Nucleic Acids Research, 43(7), e47. 10.1093/nar/gkv007 [DOI] [PMC free article] [PubMed] [Google Scholar]
- Rivers, L. E. , Young, K. M. , Rizzi, M. , Jamen, F. , Psachoulia, K. , Wade, A. , Kessaris, N., & Richardson, W. D. (2008). PDGFRA/NG2 glia generate myelinating oligodendrocytes and piriform projection neurons in adult mice. Nature Neuroscience, 11(12), 1392–1401. 10.1038/nn.2220 [DOI] [PMC free article] [PubMed] [Google Scholar]
- Rodger, J. , Drummond, E. S. , Hellstrom, M. , Robertson, D. , & Harvey, A. R. (2012). Long‐term gene therapy causes transgene‐specific changes in the morphology of regenerating retinal ganglion cells. PLoS One, 7(2), e31061. 10.1371/journal.pone.0031061 [DOI] [PMC free article] [PubMed] [Google Scholar]
- Rodieck, R. W. (1973). The vertebrate retina: Principles of structure and function. Freeman. [Google Scholar]
- Roy, N. S. , Wang, S. , Harrison‐Restelli, C. , Benraiss, A. , Fraser, R. A. , Gravel, M. , Braunn, P. E., & Goldman, S. A. (1999). Identification, isolation, and promoter‐defined separation of mitotic oligodendrocyte progenitor cells from the adult human subcortical white matter. The Journal of Neuroscience, 19(22), 9986–9995. 10.1523/JNEUROSCI.19-22-09986.1999 [DOI] [PMC free article] [PubMed] [Google Scholar]
- Sakry, D. , Neitz, A. , Singh, J. , Frischknecht, R. , Marongiu, D. , Biname, F. , Perera, S. S., Andres, K., & Mittmann, T. (2014). Oligodendrocyte precursor cells modulate the neuronal network by activity‐dependent ectodomain cleavage of glial NG2. PLoS Biology, 12(11), e1001993. 10.1371/journal.pbio.1001993 [DOI] [PMC free article] [PubMed] [Google Scholar]
- Sakuta, H. , Suzuki, R. , Takahashi, H. , Kato, A. , Shintani, T. , Iemura, S. , Yamamoto, T. S., Ueno, N., & Noda, M. (2001). Ventroptin: A BMP‐4 antagonist expressed in a double‐gradient pattern in the retina. Science, 293(5527), 111–115. 10.1126/science.1058379 [DOI] [PubMed] [Google Scholar]
- Scolding, N. , Franklin, R. , Stevens, S. , Heldin, C. H. , Compston, A. , & Newcombe, J. (1998). Oligodendrocyte progenitors are present in the normal adult human CNS and in the lesions of multiple sclerosis. Brain, 121(Pt 12), 2221–2228. 10.1093/brain/121.12.2221 [DOI] [PubMed] [Google Scholar]
- Sebok, A. , Nusser, N. , Debreceni, B. , Guo, Z. , Santos, M. F. , Szeberenyi, J. , & Tigyi, G. (1999). Different roles for RhoA during neurite initiation, elongation, and regeneration in PC12 cells. Journal of Neurochemistry, 73(3), 949–960. 10.1046/j.1471-4159.1999.0730949.x [DOI] [PubMed] [Google Scholar]
- Seixas, A. I. , Azevedo, M. M. , Paes de Faria, J. , Fernandes, D. , Mendes Pinto, I. , & Relvas, J. B. (2019). Evolvability of the actin cytoskeleton in oligodendrocytes during central nervous system development and aging. Cellular and Molecular Life Sciences, 76(1), 1–11. 10.1007/s00018-018-2915-8 [DOI] [PMC free article] [PubMed] [Google Scholar]
- Shannon, P., Markiel, A., Ozier, O., Baliga, N. S., Wang, J. T., Ramage, D., Amin, N., Schwikowski, B., & Ideker, T. (2003). Cytoscape: A software environment for integrated models of biomolecular interaction networks. Genome Research, 13(11), 2498–2504. 10.1101/gr.1239303 [DOI] [PMC free article] [PubMed] [Google Scholar]
- Shin, E. Y. , Shin, K. S. , Lee, C. S. , Woo, K. N. , Quan, S. H. , Soung, N. K. , Kim, Y. G., Cha, C. I., Kim, S.‐R., Park, D., & Bokoch, G. M. & Kim, E. G. (2002). Phosphorylation of p85 beta PIX, a Rac/Cdc42‐specific guanine nucleotide exchange factor, via the Ras/ERK/PAK2 pathway is required for basic fibroblast growth factor‐induced neurite outgrowth. The Journal of Biological Chemistry, 277(46), 44417–44430. 10.1074/jbc.M203754200 [DOI] [PubMed] [Google Scholar]
- Sholl, D. A. (1953). Dendritic organization in the neurons of the visual and motor cortices of the cat. Journal of Anatomy, 87(4), 387–406 https://www.ncbi.nlm.nih.gov/pubmed/13117757 [PMC free article] [PubMed] [Google Scholar]
- Sim, F. J. , Lang, J. K. , Waldau, B. , Roy, N. S. , Schwartz, T. E. , Pilcher, W. H. , Chandross, K. J., Natesan, S., Merrill, J. E., & Goldman, S. A. (2006). Complementary patterns of gene expression by human oligodendrocyte progenitors and their environment predict determinants of progenitor maintenance and differentiation. Annals of Neurology, 59(5), 763–779. 10.1002/ana.20812 [DOI] [PubMed] [Google Scholar]
- Sim, F. J. , McClain, C. R. , Schanz, S. J. , Protack, T. L. , Windrem, M. S. , & Goldman, S. A. (2011). CD140a identifies a population of highly myelinogenic, migration‐competent and efficiently engrafting human oligodendrocyte progenitor cells. Nature Biotechnology, 29(10), 934–941. 10.1038/nbt.1972 [DOI] [PMC free article] [PubMed] [Google Scholar]
- Sim, F. J. , Windrem, M. S. , & Goldman, S. A. (2009). Fate determination of adult human glial progenitor cells. Neuron Glia Biology, 5(3–4), 45–55. 10.1017/S1740925X09990317 [DOI] [PubMed] [Google Scholar]
- Song, J. , Goetz, B. D. , Baas, P. W. , & Duncan, I. D. (2001). Cytoskeletal reorganization during the formation of oligodendrocyte processes and branches. Molecular and Cellular Neurosciences, 17(4), 624–636. 10.1006/mcne.2001.0974 [DOI] [PubMed] [Google Scholar]
- Spitzer, S. O. , Sitnikov, S. , Kamen, Y. , Evans, K. A. , Kronenberg‐Versteeg, D. , Dietmann, S. , de Faria, O. Jr., Agathou, S., & Karadottir, R. T. (2019). Oligodendrocyte progenitor cells become regionally diverse and heterogeneous with age. Neuron, 101(3), 459–471 e455. 10.1016/j.neuron.2018.12.020 [DOI] [PMC free article] [PubMed] [Google Scholar]
- Staugaitis, S. M. , & Trapp, B. D. (2009). NG2‐positive glia in the human central nervous system. Neuron Glia Biology, 5(3–4), 35–44. 10.1017/S1740925X09990342 [DOI] [PubMed] [Google Scholar]
- Suzuki, R. , & Nishiyama, A. (2009). Polydendrocytes—their roles in development and glial tumor formation. Brain and Nerve, 61(7), 733–739 http://www.ncbi.nlm.nih.gov/pubmed/19618850 [PubMed] [Google Scholar]
- Thomas, M. G. , Santa Coloma, T. A. , Correale, J. , & Boccacci, G. L. (2002). Myosin light chain kinase inhibitors induce retraction of mature oligodendrocyte processes. Neurochemical Research, 27(11), 1305–1312. 10.1023/a:1021615530960 [DOI] [PubMed] [Google Scholar]
- Ullian, E. M. , Sapperstein, S. K. , Christopherson, K. S. , & Barres, B. A. (2001). Control of synapse number by glia. Science, 291(5504), 657–661. 10.1126/science.291.5504.657 [DOI] [PubMed] [Google Scholar]
- Vigano, F. , Mobius, W. , Gotz, M. , & Dimou, L. (2013). Transplantation reveals regional differences in oligodendrocyte differentiation in the adult brain. Nature Neuroscience, 16(10), 1370–1372. 10.1038/nn.3503 [DOI] [PubMed] [Google Scholar]
- Wang, H. , Rusielewicz, T. , Tewari, A. , Leitman, E. M. , Einheber, S. , & Melendez‐Vasquez, C. V. (2012). Myosin II is a negative regulator of oligodendrocyte morphological differentiation. Journal of Neuroscience Research, 90(8), 1547–1556. 10.1002/jnr.23036 [DOI] [PMC free article] [PubMed] [Google Scholar]
- Wang, J. , Ho, W. Y. , Lim, K. , Feng, J. , Tucker‐Kellogg, G. , Nave, K. A. , & Ling, S. C. (2018). Cell‐autonomous requirement of TDP‐43, an ALS/FTD signature protein, for oligodendrocyte survival and myelination. Proceedings of the National Academy of Sciences of the United States of America, 115(46), E10941–E10950. 10.1073/pnas.1809821115 [DOI] [PMC free article] [PubMed] [Google Scholar]
- Wang, S. , Sdrulla, A. D. , diSibio, G. , Bush, G. , Nofziger, D. , Hicks, C. , & Barres, B. A. (1998). Notch receptor activation inhibits oligodendrocyte differentiation. Neuron, 21(1), 63–75. 10.1016/s0896-6273(00)80515-2 [DOI] [PubMed] [Google Scholar]
- Warren, P. (2017). panp: Presence‐absence calls from negative STrand matching probesets.
- Weng, Q. , Wang, J. , Wang, J. , He, D. , Cheng, Z. , Zhang, F. , Verma, R., Xu, L., Dong, X., Liao, Y., He, X., Potter, A., Zhang, L., Zhao, C., Xin, M., Zhou, Q., Aronow, B. J., Blackshear, P. J., Rich, J. N., & Lu, Q. R. (2019). Single‐cell transcriptomics uncovers glial progenitor diversity and cell fate determinants during development and gliomagenesis. Cell Stem Cell, 24(5), 707–723. 10.1016/j.stem.2019.03.006 [DOI] [PMC free article] [PubMed] [Google Scholar]
- Wilson, R. , & Brophy, P. J. (1989). Role for the oligodendrocyte cytoskeleton in myelination. Journal of Neuroscience Research, 22(4), 439–448. 10.1002/jnr.490220409 [DOI] [PubMed] [Google Scholar]
- Windrem, M. S. , Nunes, M. C. , Rashbaum, W. K. , Schwartz, T. H. , Goodman, R. A. , McKhann, G., 2nd , & Goldman, S. A. (2004). Fetal and adult human oligodendrocyte progenitor cell isolates myelinate the congenitally dysmyelinated brain. Nature Medicine, 10(1), 93–97. 10.1038/nm974 [DOI] [PubMed] [Google Scholar]
- Windrem, M. S. , Osipovitch, M. , Liu, Z. , Bates, J. , Chandler‐Militello, D. , Zou, L. , Munir, J., Schanz, S., McCoy, K., Miller, R. H., Wang, S., Nedergaard, M., Findling, R. L., Tesar, P. J., & Goldman, S. A. (2017). Human iPSC glial mouse chimeras reveal glial contributions to schizophrenia. Cell Stem Cell, 21(2), 195–208. 10.1016/j.stem.2017.06.012 [DOI] [PMC free article] [PubMed] [Google Scholar]
- Windrem, M. S. , Schanz, S. J. , Guo, M. , Tian, G.‐F. , Washco, V. , Stanwood, N. , Rasband, M., Roy, N. S., Nedergaard, M., Havton, L. A., Wang, S., & Goldman, S. A. (2008). Neonatal chimerization with human glial progenitor cells can both remyelinate and rescue the otherwise lethally hypomyelinated shiverer mouse. Cell Stem Cell, 2(6), 553–565. 10.1016/j.stem.2008.03.020 [DOI] [PMC free article] [PubMed] [Google Scholar]
- Windrem, M. S. , Schanz, S. J. , Morrow, C. , Munir, J. , Chandler‐Militello, D. , Wang, S. , & Goldman, S. A. (2014). A competitive advantage by neonatally engrafted human glial progenitors yields mice whose brains are chimeric for human glia. The Journal of Neuroscience, 34(48), 16153–16161. 10.1523/JNEUROSCI.1510-14.2014 [DOI] [PMC free article] [PubMed] [Google Scholar]
- Young, K. M. , Psachoulia, K. , Tripathi, R. B. , Dunn, S. J. , Cossell, L. , Attwell, D. , Tohyama, K., & Richardson, W. D. (2013). Oligodendrocyte dynamics in the healthy adult CNS: Evidence for myelin remodeling. Neuron, 77(5), 873–885. 10.1016/j.neuron.2013.01.006 [DOI] [PMC free article] [PubMed] [Google Scholar]
- Zhang, L. , He, X. , Liu, L. , Jiang, M. , Zhao, C. , Wang, H. , He, D., Zheng, T., Zhou, X., Hassan, A., Ma, Z., Xin, M., Sun, Z., Lazar, M. A., Goldman, S. A., Olson, E. N., & Lu, Q. R. (2016). Hdac3 interaction with p300 histone acetyltransferase regulates the oligodendrocyte and astrocyte lineage fate switch. Developmental Cell, 36(3), 316–330. 10.1016/j.devcel.2016.01.002 [DOI] [PMC free article] [PubMed] [Google Scholar]
- Zhang, Y. , Argaw, A. T. , Gurfein, B. T. , Zameer, A. , Snyder, B. J. , Ge, C. , Lu, Q. R., Rowitch, D. H., Raine, C. S., Brosnan, C. F., & John, G. R. (2009). Notch1 signaling plays a role in regulating precursor differentiation during CNS remyelination. Proceedings of the National Academy of Sciences, 106(45), 19162–19167. 10.1073/pnas.0902834106 [DOI] [PMC free article] [PubMed] [Google Scholar]
- Zhu, X. , Bergles, D. E. , & Nishiyama, A. (2008). NG2 cells generate both oligodendrocytes and gray matter astrocytes. Development, 135(1), 145–157. 10.1242/dev.004895 [DOI] [PubMed] [Google Scholar]
- Zuchero, J. B. , Fu, M.‐m. , Sloan, S. A. , Ibrahim, A. , Olson, A. , Zaremba, A. , Dugas, J. C., Wienbar, S., Caprariello, A. V., Kantor, C., Leonoudakis, D., Lariosa‐Willingham, K. , Kronenberg, G. , Gertz, K., Soderling, S. H., Miller, R. H., & Barres, B. A. (2015). CNS myelin wrapping is driven by actin disassembly. Developmental Cell, 34(2), 152–167. 10.1016/j.devcel.2015.06.011 [DOI] [PMC free article] [PubMed] [Google Scholar]
Associated Data
This section collects any data citations, data availability statements, or supplementary materials included in this article.
Supplementary Materials
Table S1. Differential Expression of genes between compartments (Excel file with 3 tabs, submitted as three separate files: Table S1 ‐ Table 1. WM vs GM GPC, Table S1 ‐ Table 2. WM GPC vs Tissue, Table S1 ‐ Table 1. GM GPC vs Tissue)
Table S2. Curated IPA terms and Genes
Data Availability Statement
All genomic data have been deposited to GEO, accession number GSE29796 (https://www.ncbi.nlm.nih.gov/geo/query/acc.cgi). R analysis script and processed data can be assessed at Github.com/CTNGoldmanLab/Adult_WM_vs_GM_hGPC_2021.