

Abstract
Background:
“Quantile-dependent expressivity” occurs when the effect size of a genetic variant depends upon whether the phenotype (e.g. growth factor concentration) is high or low relative to its distribution.
Methods
Quantile-regression analysis was applied to family sets from the Framingham Heart Study to determine whether the heritability (h2) of vascular endothelial growth factor (VEGF), hepatocyte growth factor (HGF), angiopoietin-2, and angiopoietin-2 (sTie-2) and VEGFR1 (sFlt-1) receptor concentrations were quantile-specific.
Results
Quantile-specific h2 (±SE) increased with increasing percentiles of the age- and sex-adjusted VEGF (Ptrend<10−16), HGF (Ptrend=0.0004), angiopoietin-2 (Ptrend=0.0002), sTie-2 (Ptrend=1.2×10⁻⁵), and sFlt-1 distributions (Ptrend=0.04).
Conclusion:
Heritabilities of VEGF, HGF, angiopoitein-2, sTie-2 and sFlt-1 concentrations are quantile-dependent. This may explain reported interactions of genetic loci (rs10738760, rs9472159, rs833061, rs3025039, rs2280789, rs1570360, rs2010963) with metabolic syndrome, diet, recurrent miscarriage, hepatocellular carcinoma, erysipelas, diabetic retinopathy and bevacizumab treatment in their effect on VEGF concentrations.
Keywords: gene-environment interaction, precision medicine, vascular endothelial growth factor, hepatocyte growth factor, angiopoietin-2, heritability, angiopoietin-2 (Tie-2) receptor, VEGFR1 (Flt-1) receptor
Graphical Abstract

Introduction
Angiogenesis is the generation of new blood vessels from existing vasculature during embryonic development, bone development, reproduction, wound healing, and cyclical ovarian function (Liekens et al. 2001). Vascular growth factors stimulate angiogenesis and play a critical role in blood vessel repair. Included among these growth factors are VEGF (vascular endothelial growth factor, aka VEGF-A), HGF (hepatocyte growth factor), and angiopoietin-2 (Lieb et al. 2009, 2010, 2015). VEGF has been implicated in pathological angiogenesis in cancer, diabetic retinopathy, polycystic ovary syndrome, endometriosis, atherosclerosis and rheumatoid arthritis (Liekens et al 2001; Webb and Vande Woude 2000). Anti-VEGF treatments have emerged as important cancer (Kieran et al. 2012), macular degeneration (Dixon et al. 2009) and rheumatoid arthritis therapies (Schoettler and Brahn 2009).
VEGF stimulates endothelial cell nitric oxide and prostacyclin production (Hood et al. 1998; Neagoe et al. 2005), increases microvascular permeability (Bates et al. 2002), and prevents endothelial cell apoptosis (Lieb et al. 2009). It is inhibited by the circulating soluble form of the VEGFR1 receptor (sFlt-1) by direct sequestration (Shibuya 2006). Angiopoietin-2 promotes VEGF-induced neovascularization (Lieb et al. 2010). Both angiopoietin-2 and the soluble form of the sTie-2 (growth substances tyrosine kinase) receptor (Reusch et al. 2001) inhibit endothelial Ang-1/Tie-2 signaling (Reusch et al. 2001; Peters 1998), thereby attenuating the signal’s ability to prolong endothelial cell survival, maintain the endothelium in a quiescent state, and facilitate new vessel maturation (Asahara et al. 1998). VEGF and HGF relate to improved endothelial function whereas sFlt-1 relates to endothelial dysfunction (Lieb et al. 2009).
Serum VEGF concentrations are reported to be strongly heritable [h2=61% (Berrahmoune et al. 2007), 77% (Lieb et al. 2009), 80% (Pantsulaia et al. 2004), 94% (Schüler et al. 2018)]. Serum sTie-2 [h2=0.56 (Lieb et al. 2010)] and HGF concentrations [h2=0.37 (Lieb et al. 2009), 0.48 (Vistoropsky et al. 2008)] are reported to be moderately heritable, and serum angiopoietin-2 [h2=0.27 (Lieb et al. 2010)] and sFlt-1 concentrations more weakly heritable [h2=0.12 (Lieb et al. 2009)]. These point estimates are traditionally assumed to apply throughout the phenotype distribution. Alternatively, “quantile-dependent expressivity” hypothesizes that the effects of genetic variants on phenotypes may depend on the whether the phenotype (e.g., growth factor concentration) is high or low relative to its distribution (Williams 2012). The heritability of body fat (Williams 2012, 2020a); circulating concentrations of leptin (Williams 2020b), triglyceride (Williams 2012, 2020c), cholesterol (Williams 2012, 2020d–e), adiponection (Williams 2020f)), C-reactive protein (Williams 2021a), plasminogen activator inhibitor type-1 (Williams 2021b), and uric acid concentrations (Williams 2021c); intakes of alcohol (Williams 2020g) and coffee (Williams 2020h); and pulmonary function (Williams 2020i) are quantile dependent; whereas height and the intakes of other macronutrients are not (Williams 2012, 2020g). The increase in genetic effect size for triglyceride-related single nucleotide polymorphisms (SNP) during postprandial lipemia (Williams 2020j) and decreased genetic effect size for triglyceride and cholesterol following drug treatment (Williams 2020c–e) provide particularly compelling evidence for quantile-dependent expressivity because the genetic effect sizes change in response to changing mean lipid and lipoprotein concentrations within individuals.
It is not known whether gene effects on growth factors and their receptor are quantile-specific, or whether quantile-dependence may contribute to reported gene-environment interaction due to the selection of subjects by characteristics that distinguish high vs. low-valued phenotypes (Williams 2020k). Therefore, quantile regression (Koenker and Hallock 2001; Gould 1992) was applied to VEGF, HGF, angiopoietin-2, sTie-2 and sFlt-1 concentrations in sibships and offspring-parent pairs from the Framingham Heart Study (Kannel et al. 2006; Splansky et al. 2007) to estimate heritability in the narrow sense [h2 (Falconer and Mackay 1996)] at different quantile of the their sample distribution.
Materials and Methods
The Framingham Study data were obtained from the National Institutes of Health FRAMCOHORT, GEN3, FRAMOFFSPRING Research Materials obtained from the National Heart, Lung, and Blood (NHLBI) Biologic Specimen and Data Repository Information Coordinating Center. The hypothesis tested is not considered as part of the initial Framingham Study design and is exploratory. Our analyses of these data were approved by Lawrence Berkeley National Laboratory Human Subjects Committee (HSC) for protocol “Gene-environment interaction vs. quantile-dependent penetrance of established SNPs (107H021)”. LBNL holds the Office of Human Research Protections Federal wide Assurance number FWA 00006253. Approval number: 107H021–13MR20. All data collection was conducted under the direction of the Framingham Heart Study human use committee guidelines, with signed informed consent from all participants or parent and/or legal guardian if <18 years of age.
The design, protocols, and descriptive characteristics of the Framingham Heart Study are described in detail elsewhere (Kannel et al. 2006; Splansky et al. 2007). Serum VEGF concentrations were determined for examination 7 of the Offspring Cohort, and serum VEGF, HGF, angiopoietin-2, sTie-2 and sFlt-1 concentrations for examination 1 of the Third Generation Cohort. Early morning 12-hour fasting blood samples were immediately centrifuged and stored at −80 C. Serum concentrations of biomarkers were obtained using commercial assays (R&D Systems Inc., Minneapolis, MN) as previously described (Lieb et al. 2010). Interassay coefficients of variation were 2.1% for VEGF, 6.4% for sFlt-1, 1.6% for HGF, 5.7% for angiopoietin-2, and 3.2% for sTie-2 (Lieb et al. 2010).
Statistics
The statistical methods employed have been described in detail (Williams 2020a–k). Age and sex adjustment was performed separately in the Offspring and Third Generation Cohorts using standard least-squares regression with the following independent variables: female (0,1), age, age2, female × age, and female × age2. Individual subject values were taken as the average of the age- and sex-adjusted concentrations over all available exams. Offspring-parent (βOP) and offspring-midparental regression slopes (βOM) for VEGF concentrations were computed using parents of the Offspring Cohort and their offspring who participated in the Third Generation Cohort. Parent-offspring regression slopes were computed by assigning a weight of one-half to the father-child pair and one-half to the mother-child pair (if both parents were available), and assigning a weight of one to the parent–child pair if only one parent was available. Sibships were identified from the Offspring (VEGF) and Third Generation Cohorts (all variables). The number of degrees of freedom for the standard error was Σki−2 for parent–offspring regression slopes and correlations, and Σ(ki−1) for sibship correlations and regression slopes, where ki is the number of offspring in family or sibship i, and the summation is taken over all i, i = 1,..., N nuclear families.
Simultaneous quantile regression is a well-developed statistical procedure (Koenker and Hallock 2001; Gould 1992) that estimates the regression coefficients for multiple quantiles using linear programming to minimize the sum of asymmetrically weighted absolute residuals, and bootstrap resampling to estimate their corresponding variances and covariances (Gould 1992). Quantile regression of offspring-parent and sib-pairs was performed using the sqreg command of Stata (version. 11, StataCorp, College Station, TX). The variances and covariance for the 91 quantile regression coefficients between the 5th and 95th percentiles were estimated from 1000 bootstrap samples. Trends in the regression slopes were tested using Stata post-estimation procedures (test and lincom) of the slopes after estimation and significant linear, quadratic and cubic trends in the coefficients determined from orthogonal polynomials (Winer and Michels 1991). Heritability in the narrow sense (h2) was estimated by h2= 2βOP/(1+rspouse) where rspouse is the spouse correlation, by h2=βOM, and by h2={(1+8βFSrspouse)0.5-1}/2rspouse under specific restrictive assumptions (Falconer and Mackay 1996). Simulations of a simple model of polygenic inheritance are presented as supplementary material showing no significant trends in heritability with increasing quantiles of the offspring trait unless specifically incorporated into the model. Supplementary Figure 1 shows general agreement between quantile-regression analysis and the estimation of least-squares regression slopes comparing the offspring quantiles (dependent variable) and the parents mean values (independent variable) when the data are divided into bins by the sorted parental values. “Quantile-specific heritability” refers to the heritability statistic, whereas “quantile-dependent expressivity” is the biological phenomenon of the trait expression being quantile-dependent. Results are presented as mean±SE.
The results from several published studies were re-interpreted from the perspective of quantile-dependent expressivity using genotype-specific mean biomarker concentrations presented in the original articles (Suenaga et al. 2018; Suenaga et al. 2019; Ghazizadeh et al. 2017; Ghazizadeh et al. 2018; Oana et al. 2014; Baitello et al. 2016; Almawi et al. 2013; Emene et al. 2017; Choudhuri et al. 2015) or by extracting them from published graphs (Schüler et al. 2018) using the Microsoft Powerpoint formatting palette (version 12.3.6 for Macintosh computers, Microsoft corporation, Redmond WA) as previously described (Williams 2020j). Our interpretations are not necessarily those of the original articles.
Results
Table 1 presents the sample characteristics. As previously reported (Lieb et al. 2009, 2010), women had higher VEGF and higher angiopoietin-2 concentrations, and lower sFlt-1 and sTie-2 concentrations than men.
Table 1.
Sample characteristics
| Third Generation Cohort | Offspring Cohort | |||
|---|---|---|---|---|
| Male | Female | Male | Female | |
| Sample size (N) | 1734 | 1961 | 1125 | 1347 |
| Age | 40.38 (8.56) | 39.95 (8.74) | 61.2 (9.6) | 61.1 (9.3) |
| BMI | 27.98 (4.62) | 26.00 (6.10) | 28.6 (4.5) | 27.4 (5.8) |
| Angiopoietin-2 (ng/ml) | 1.91 (0.94) | 2.25 (1.26) | ||
| sTie-2 ng/ml | 15.93 (4.77) | 15.11 (4.62) | ||
| Hepatocyte growth factor (ng/mL) | 859.1 (254.3) | 854.2 (244.6) | ||
| Vascular endothelial growth factor (pg/ml) | 333.7 (245.0) | 347.0 (260.3) | 328.6 (234.1) | 340.3 (240.8) |
| sFlt-1 (ng/ml) | 167.4 (109.3) | 157.4 (127.0) | ||
Mean (standard deviation)
BMI: body mass index; sTie-2: Soluble angiopoietin receptor; sFlt-1: Soluble Fms Related Receptor Tyrosine Kinase 1
Traditional point estimates of familial concordance and heritability
Spouse VEGF concentrations were moderately correlated (rspouse=0.1021). The offspring-parent regression slope (βOP±SE), calculated from 1770 offspring with one parent and 1385 offspring with two parents, was 0.3566±0.0167, which corresponds to a heritability (h2) of 0.6471±0.0303. Estimated h2 was similar in male and female offspring (0.6297±0.0441 vs. 0.6607±0.0417). Full sib regression slope (βFS±SE: 0.3627±0.0171) was calculated from 4655 full-sibs in 1698 sibships, which from Falconer’s formula corresponds to a heritability of h2=0.6784±0.0341, with marginally greater heritability in female than male offspring (0.7626±0.0598 vs. 0.5949±0.0604). VEGF heritability calculated as βOM was 0.8098±0.0354. Full sib regression slopes were 0.1646±0.0210 for HGF (P<10−15), 0.1263±0.0216 for angiopoietin-2 (P=4.8×10⁻⁹), 0.2656±0.0209 for sTie-2 (P<10−15), and 0.0539±0.0217 for sFlt-1 (P=0.01).
Quantile-dependent expressivity.
The offspring-parent regression slopes at the 10th, 25th, 50th, 75th, and 90th percentiles of the offspring’s VEGF distribution are presented in Figure 1A, along with their corresponding heritability estimates. The slopes get progressively greater with increasing percentiles of the VEGF distribution. The heritability at the 90th percentile was 3.9-fold greater than the heritability at the 10th percentile (h2: 1.24 vs. 0.32, Pdifference<10−15). Figure 1B, which presents these slopes with those of the other percentiles between the 5th and 95th percentiles, shows heritability increased linearly (i.e., slope±SE: 0.0100±0.0011, Plinear<10−15) with increasing percentiles of the offspring’s distribution. There was statistically significant evidence of nonlinearity (i.e., Pquadratic=0.27; Pcubic=0.007). Quantile-specific heritability was individually significant (P≤10−15) for all percentiles between the 7th and 95th percentiles of the offspring’s distribution. If the heritabilities over all quantiles were constant as traditionally assumed, then the line segments in Figure 1A would be parallel, and Figure 1B would display a flat line with zero slope. When calculated from βOM, h2 increased 0.0119±0.0010 with each one-percent increase in the offspring’s VEGF distribution (not displayed Plinear<10−15).
Figure 1.
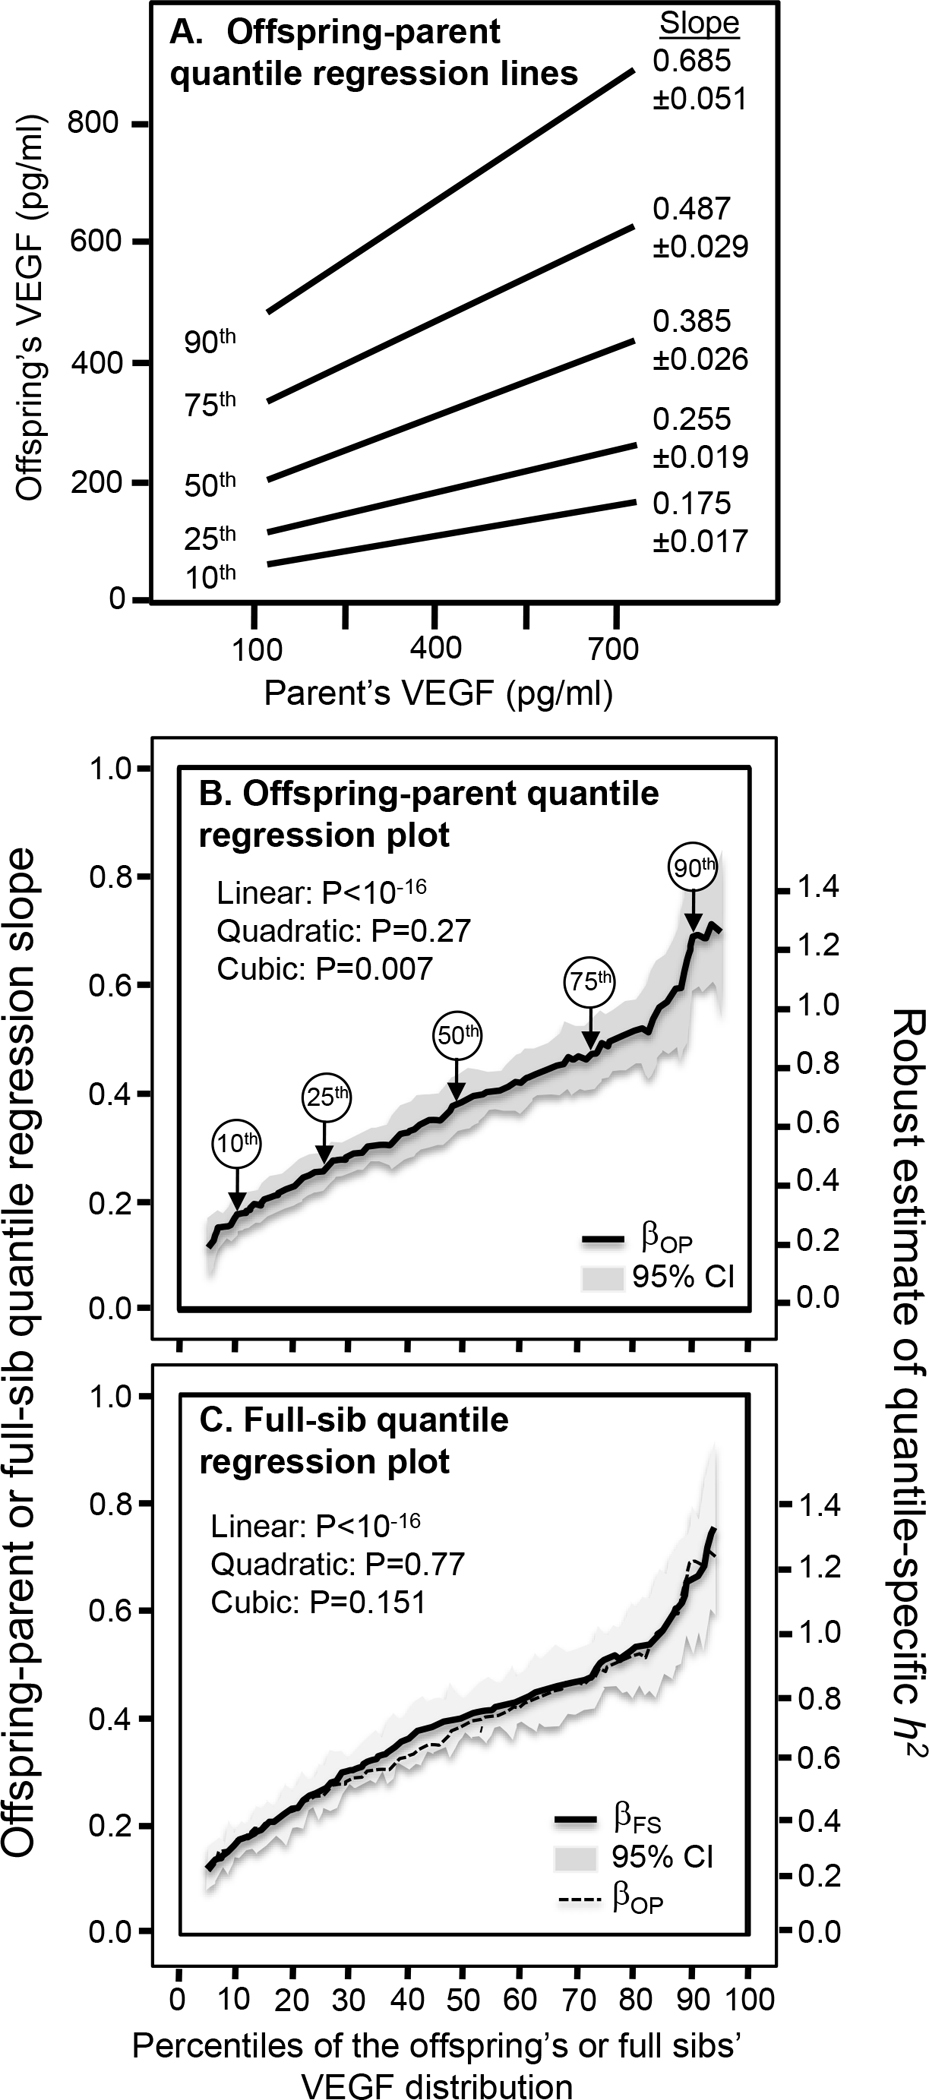
A) Offspring-parent regression slopes (βOP) for selected quantiles of the offspring’s serum vascular endothelial growth factor (VEGF) concentrations, with corresponding estimates of heritability (h2=2βOP/(1+rspouse)). The slopes became progressively greater (i.e., steeper) with increasing quantiles of the VEGF distribution. B) “Quantile-specific heritability function” formed by combining the selected quantile-specific regression slopes from above with those of other quantiles. Significance of the linear, quadratic and cubic trends and the 95% confidence intervals (shaded region) were determined by 1000 bootstrap samples. C) Full-sib regression slopes (βFS) for serum VEGF concentrations, with corresponding estimates of heritability (h2=((1+8rspouseβFS)0.5-1)/2rspouse). Heritability calculated from βOP from panel B included to demonstrate its consistency with βFS.
Figure 1C displays the full-sib regression slopes (βFS) from quantile regression analysis. Each one-percent increase in the VEGF distribution was associated with a 0.0054±0.0006 increase in the full-sib regression slope and approximately a 0.0108±0.0012 increase in estimated heritability (Plinear<10−15). VEGF heritabilities were nearly identical when estimated from βOP and βFS. βFS at the 90th percentile of the VEGF distribution was also 3.9-fold greater than when estimated at the 10th percentile (Pdifference<10−15). Quantile-specific βFS estimates were significant for each percentile between the 7th and 95th percentiles (P<10−9).
Figure 2 shows that βFS increased significantly with increasing quantiles of the HGF (0.0021±0.0006 increase per percentile of the distribution, Plinear=0.0004), angiopoietin-2 (0.0028±0.0007, Plinear=0.0002), sTie-2 (0.0027±0.0006, Plinear=1.2×10⁻⁵), and sFlt-1 distribution (0.0015±0.0007, Plinear=P=0.04).
Figure 2.
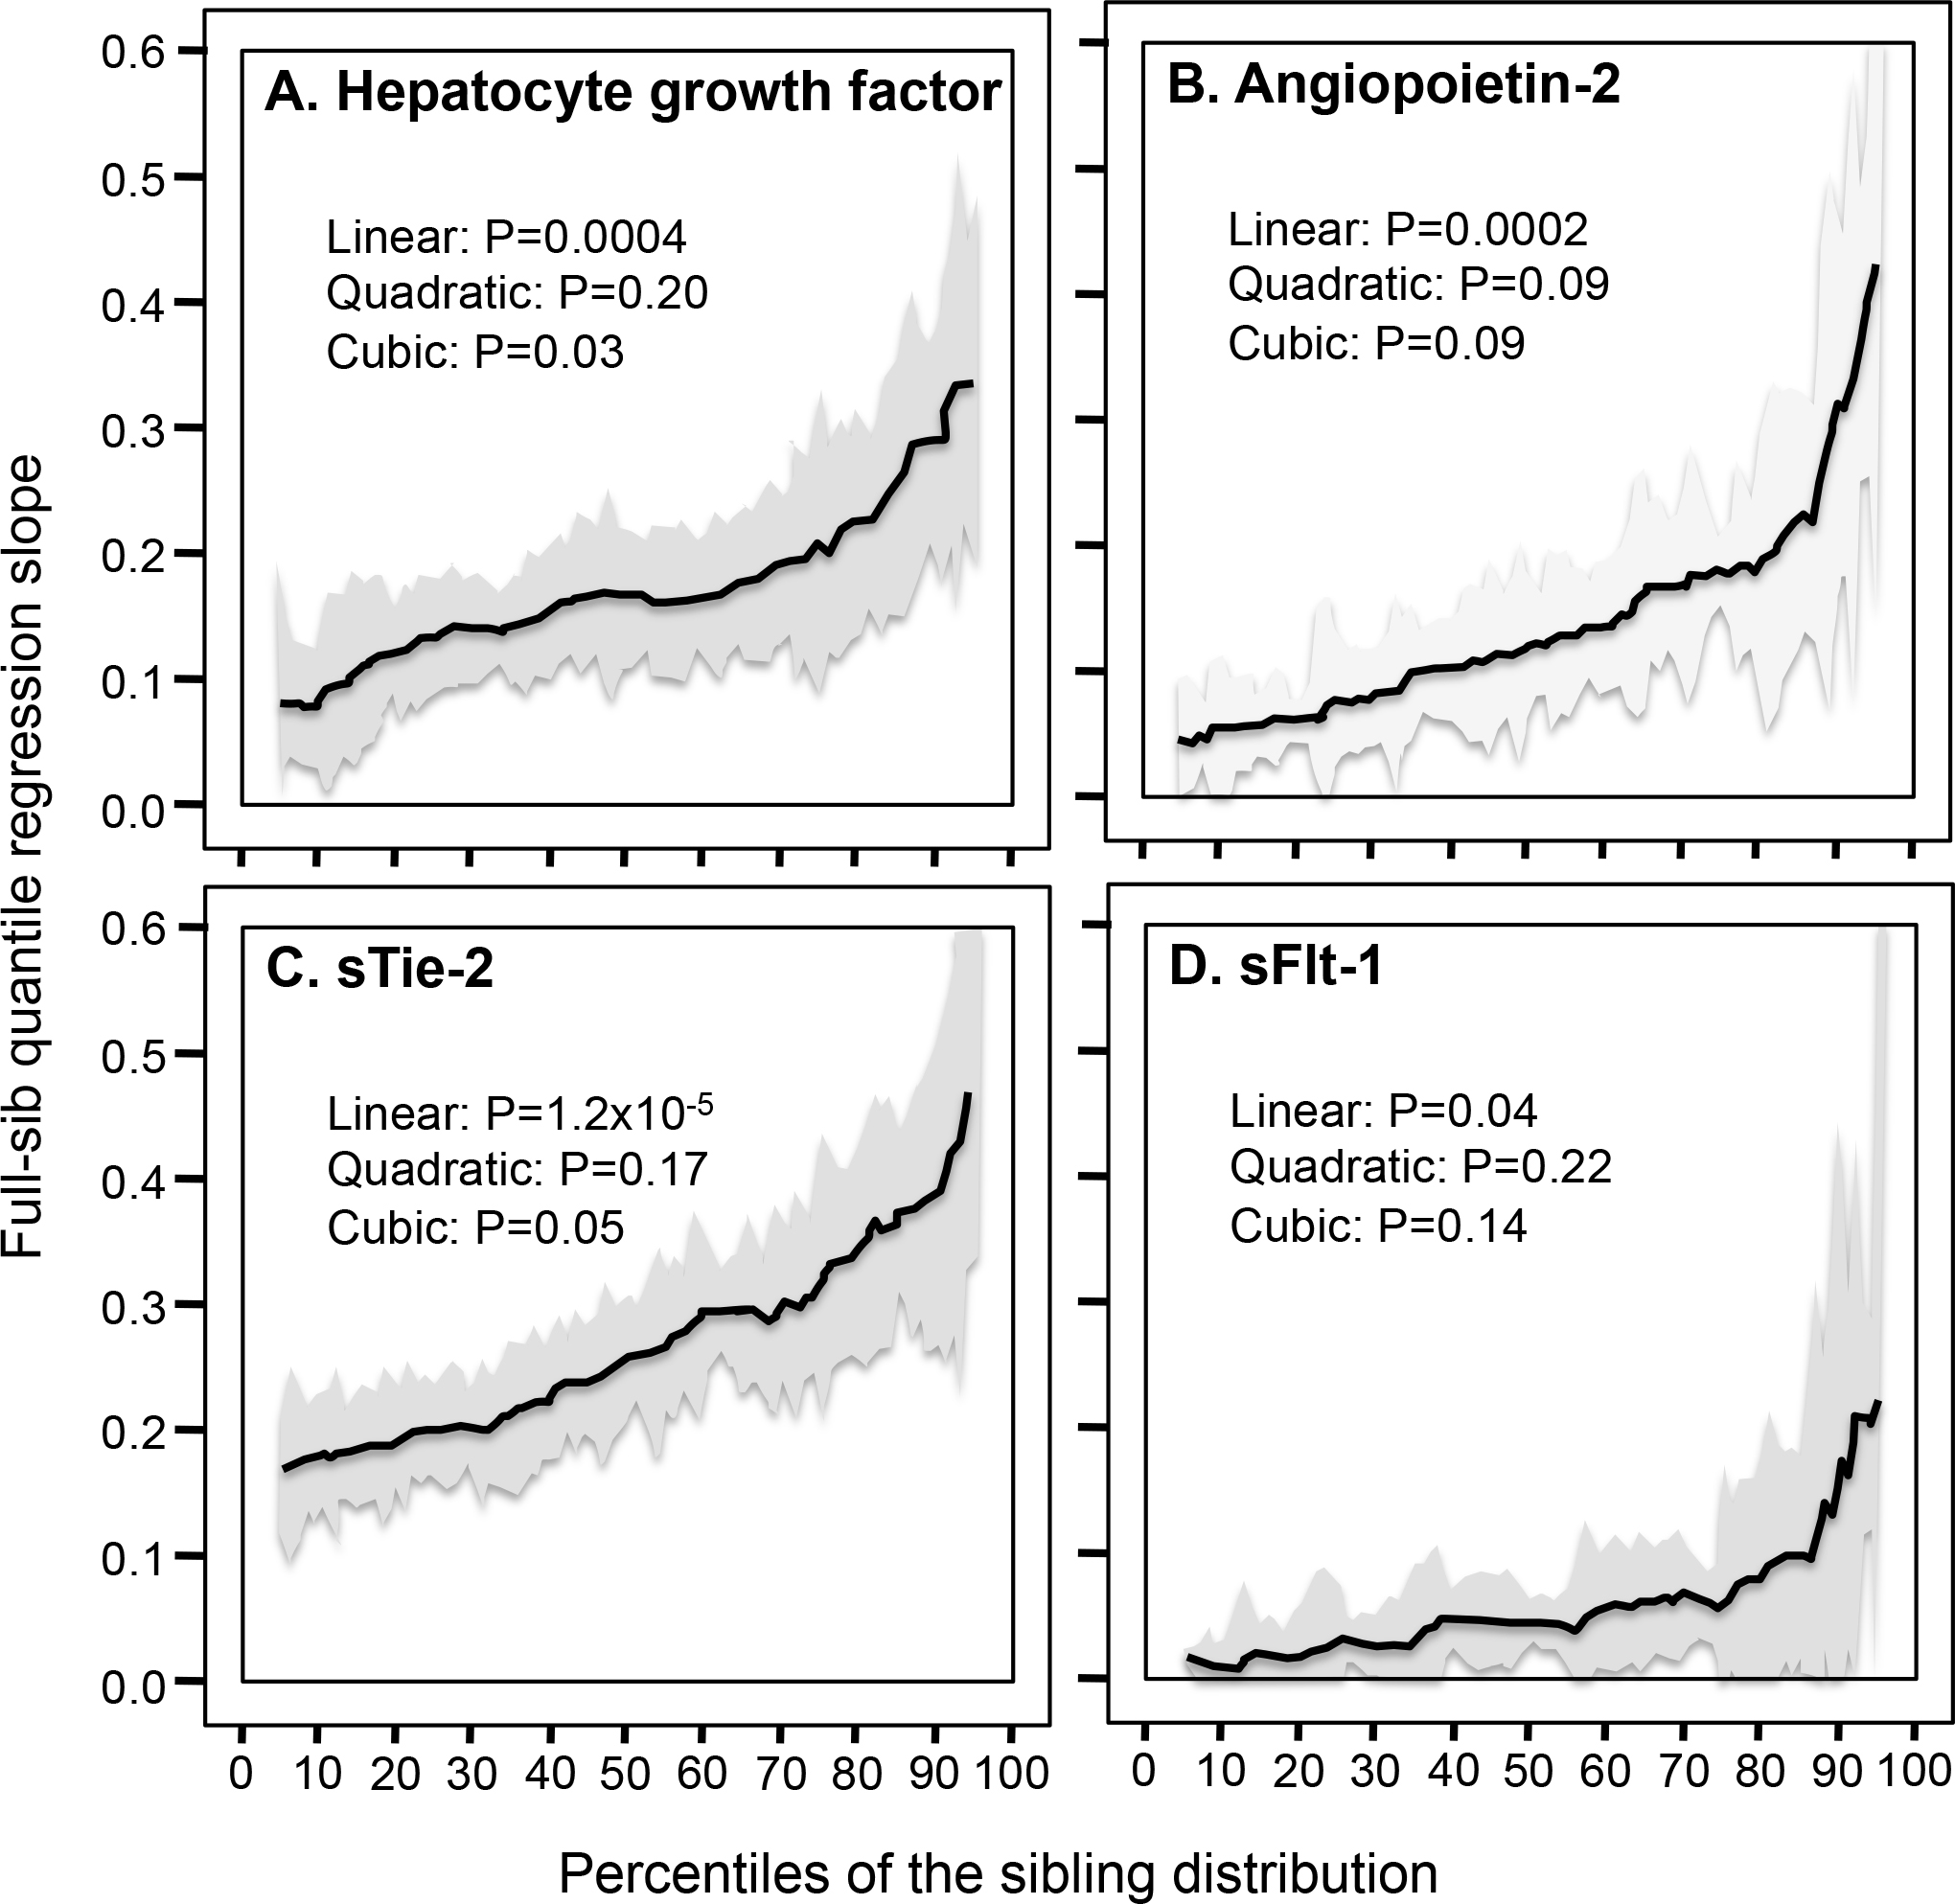
Full-sib regression slopes (βFS) by quantiles of the serum hepatocyte growth factor (HGF), angiopoietin-2, soluble angiopoietin receptor (sTie-2), and soluble VEGFR1 receptor (sFlt-1) distributions.
Replication:
Significant quantile-specific increases in βFS were detected separately for fasting VEGF concentrations measured in 1402 siblings in 565 sibships in the Framingham Offspring Cohort (linear: P<1.7×10⁻⁵; quadratic: P=0.93; cubic: P=0.04), and in 3253 siblings in 1133 sibships in the Framingham Third Generation Cohort (linear: P<10−15; quadratic: P=0.68; cubic: P=0.02).
Logarithmically transformed serum concentrations.
The spouse correlation for log VEGF was rspouse=0.0786. There was a somewhat larger overall heritability estimate for transformed than untransformed VEGF when estimated from βOP (0.76±0.04 vs. 0.65±0.03) or βFS (0.78±0.03 vs. 0.6784±0.0341). Quantile-specific heritability decreased with increasing percentiles of the log VEGF distribution as estimated from βOP (Plinear =2.2×10⁻⁵, Supplementary Figure 2A) and βFS (Plinear =1.5×10⁻⁸, Supplementary Figure 2B). Logarithmically transforming the data eliminated the significant increase in βFS with increasing percentiles of HGF (P=0.59), angiopoietin-2 (P=0.28), sTie-2 (P=0.28), and sFlt-1 (P=0.61).
Discussion
Our analyses of the Framingham Heart Study family sets suggest that genes affecting growth factor concentrations are accentuated at higher serum concentrations of the VEGF (P<10−15), HGF (P=0.0004), angiopoietin-2 (P=0.0002), sTie-2 (P=1.2×10⁻⁵) and sFlt-1 distributions (P=0.04). The quantile-dependent increase in h2 for VEGF concentrations was replicated separately in males and females, and the Offspring and Third Generation Cohorts. Untransformed concentrations were analyzed because quantile regression does not require normally, allowing the data to be analyzed as originally measured. Heritability was examined because less than one half of the genetic variance of VEGF concentrations (Lieb et al. 2015; Debette et al. 2011; Choi et al. 2016) and only a small proportion of the variance of the sTie-2 (11.2%), angiopoietin-2 (1.7%) and sFlt-1 concentrations have thus far been attributed to specific genetic loci (Lieb et al. 2015). Only 2.1% of the variation in serum HGF levels has been explained by rs5745687, the top SNP in the HGF gene (Lieb et al. 2015).
Precision medicine
Angiogenesis is crucial for tumor growth and metastasis. Targeting the vascular endothelial growth factor pathway with anti-VEGF drugs such as ranibizumab, bevacizumab and aflibercept has shown variable success in treating metastatic renal cell carcinoma and for nonsquamous non-small-cell lung cancer, melanoma, glioblastoma, pancreatic cancer, and metastatic colorectal cancer (Hsu and Wakelee, 2009; Saif 2013). Precision medicine seeks to individualize pharmacological treatment through the use of genetic markers that identify patients most likely to benefit from drug prescriptions. However, our demonstration that VEGF heritability is quantile dependent suggests that that the genetic markers could simply trace the heritability decrease with decreasing plasma VEGF concentrations
Bevacizumab is a recombinant, humanized monoclonal antibody that suppresses angiogenesis by binding to VEGF-A thereby preventing its interactions with the VEGF receptor (Mukherji 2010). Early serum VEGF reduction is a potential predictive marker of anti-VEGF therapy responsiveness (Schneider et al. 2008). Suenaga et al. (2019) reported that reductions in VEGF-A concentrations following bevacizumab treatment were significantly greater in G-allele carriers of the rs2280789 CCL5 (C-C motif chemokine ligand 5) polymorphism than AA homozygotes following 56 days of treatment, as shown in the histogram of Figure 3A (P=0.03). However, the treatment significantly lowered average VEGF concentrations from 383.7 to 177.1 pg/ml. As shown in the line graph, the results could also be attributed in part to a smaller difference between genotypes at the lower post-treatment average VEGF concentrations vis-à-vis its pre-treatment average (i.e., AG/GG minus AA: 5.7 pg/ml post-treated vs. 193.3 pg/ml pre-treated).
Figure 3.
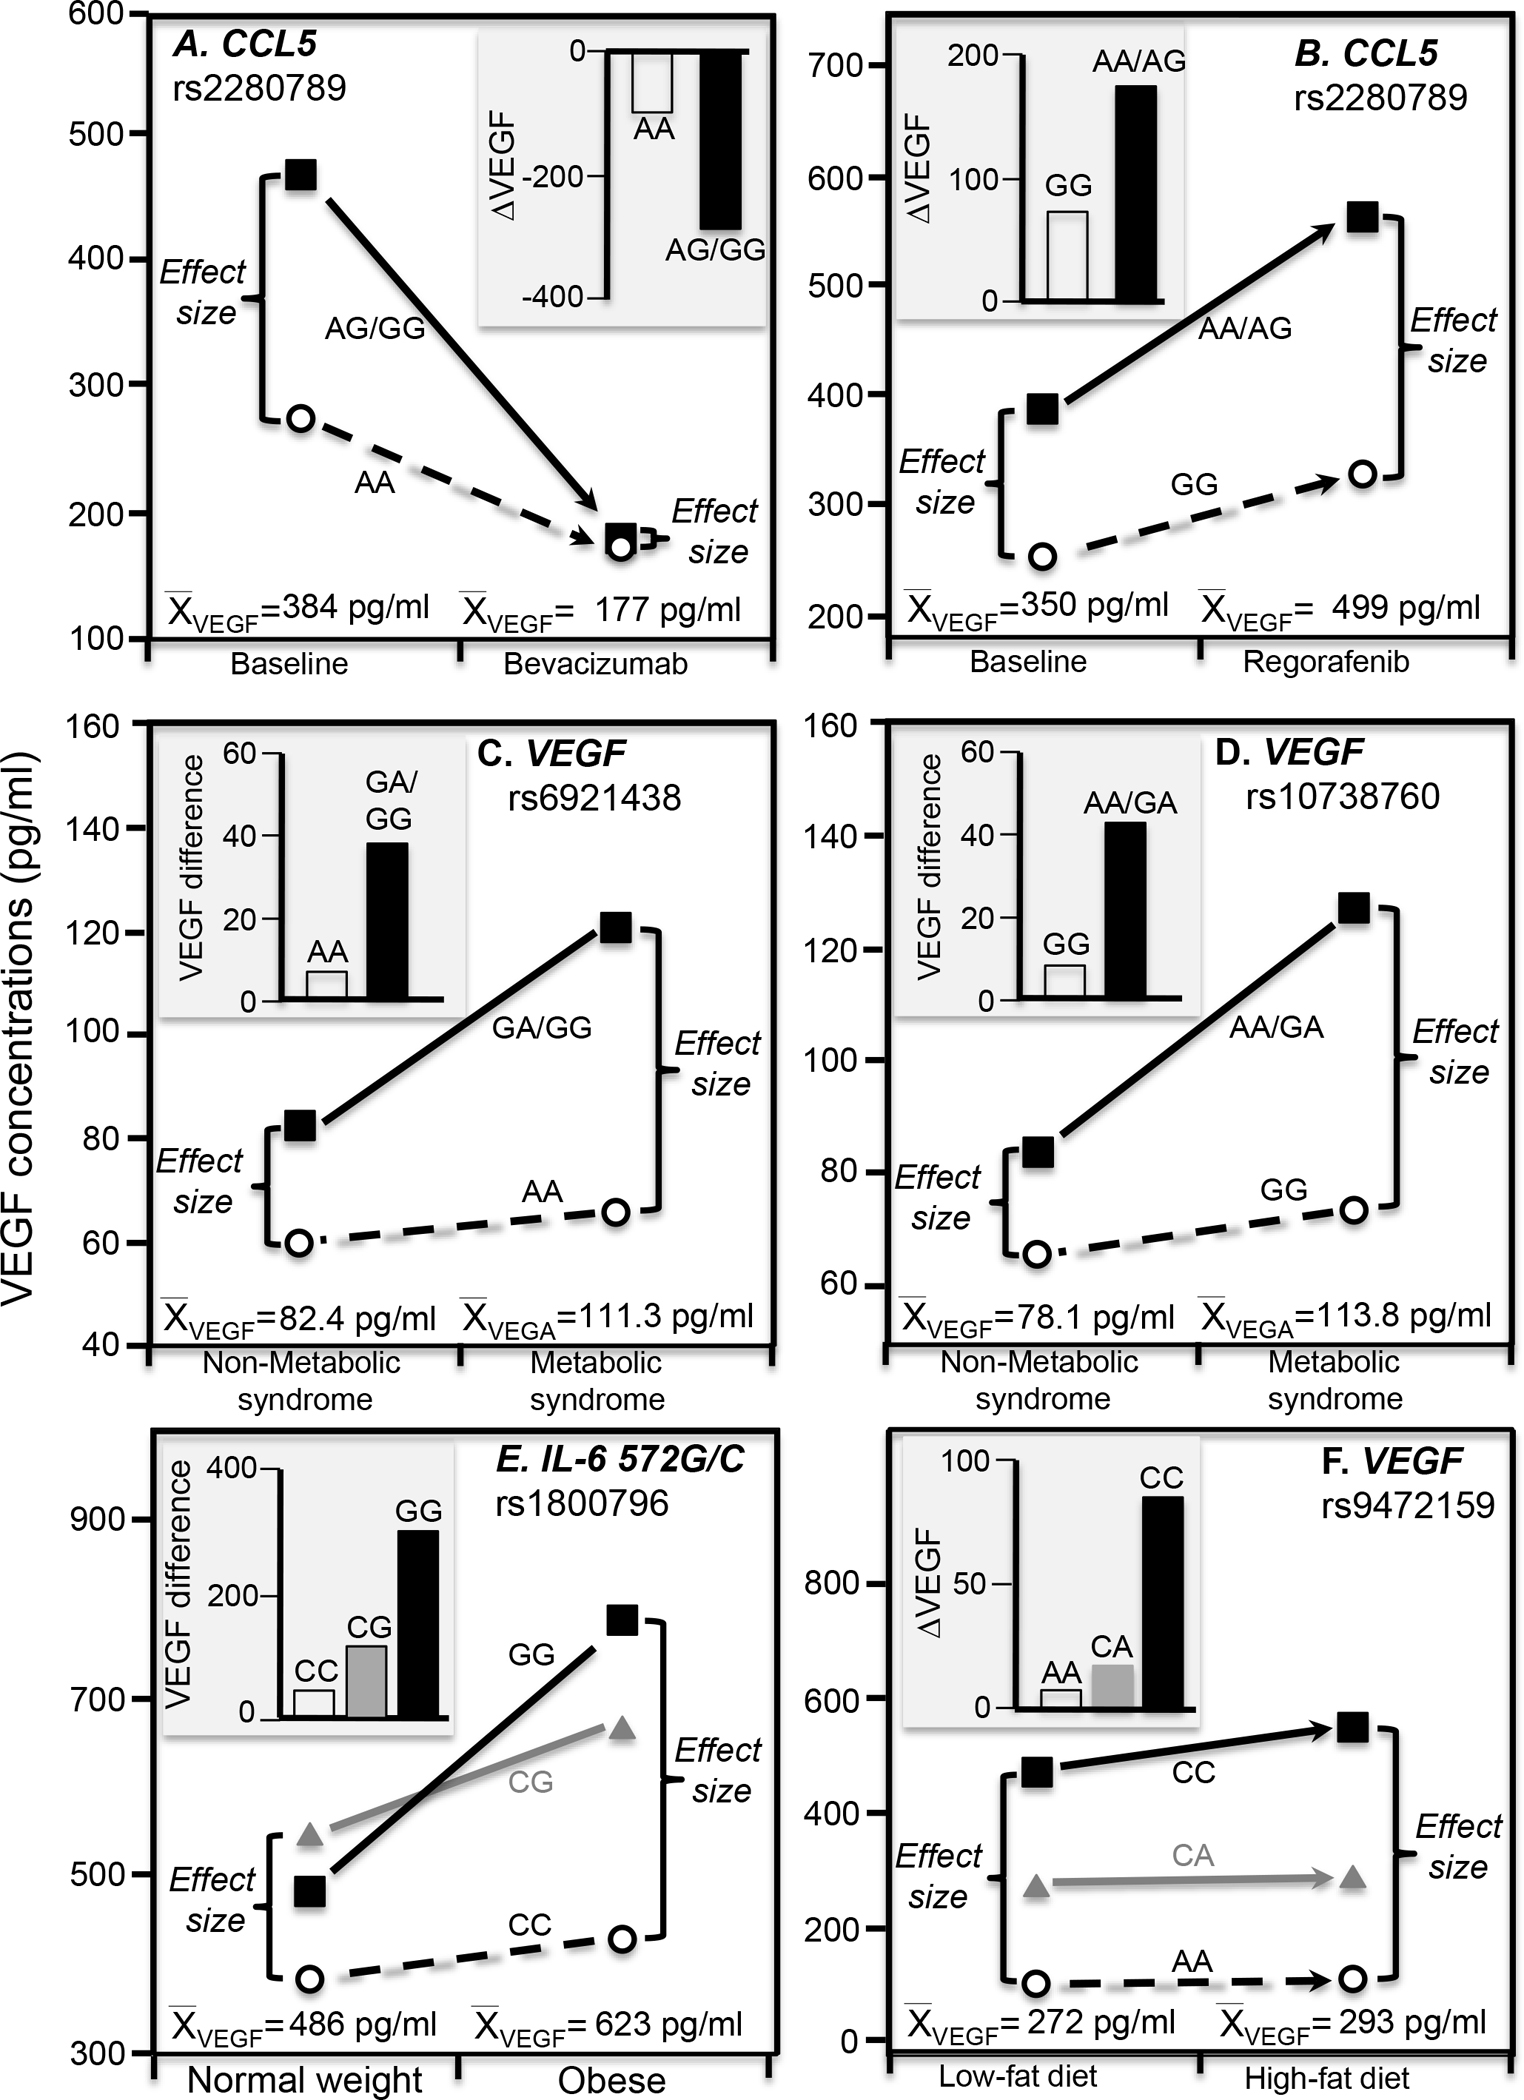
Precision medicine perspective of genotype-specific effects on serum VEGF concentrations (histogram inserts) vs. quantile-dependent expressivity perspective of larger genetic effect size when average VEGF concentrations were high (line graphs) for: A) Suenaga et al.’s 2019 report on bevacizumab-induced reductions in serum VEGF concentrations by CCL5 (C-C motif chemokine ligand 5) rs2280789 genotypes; B) Suenaga et al.’s 2018 report on regorafenib-induced increases in VEGF concentrations by CCL5 rs2280789 genotypes; C) Ghazizadeh et al.’s 2017 report of the VEGF difference between patients with and without metabolic syndrome by rs6921438 genotypes; D) Ghazizadeh et al.’s 2018 report of the VEGF difference between patients with and without metabolic syndrome by rs10738760 genotypes; E) Oana et al.’s 2014 report on the VEGF differences between obese and normal-weight children by IL-6 (interleukin 6) rs1800796 genotypes; F) Schüler et al. 2018 report on the increase in VEGF concentrations when switching from a 6-wk low fat to 6-wk high fat isocaloric diet by rs9472159 genotypes.
Survival in patients with refractory metastatic colorectal cancer is prolonged by the oral multikinase inhibitor regorafenib (Li et al. 2015). Regorafenib increases VEGF-A concentrations during 21 days of treatment which then return to baseline levels following 7-days of treatment rest. The C-C motif chemokine ligand 5/receptor 5 (CCL5/CCR5) pathway affects VEGF-A production via endothelial progenitor cell migration. Suenaga et al. (2018) reported significant differences in VEGF-A concentrations between CCL5 rs2280789 (P=0.02, Figure 3B) and CCL5 rs3817655 genotypes (P=0.01, not displayed) after 21 days of therapy but not before treatment, in accordance with the higher mean VEGF concentrations after treatment than before (499 pg/ml vs. 350 pg/ml). The SNPs are in linkage disequilibrium (D’=0.9791, R2=0.6479, https://ldlink.nci.nih.gov/).
Gene-environment interactions
An important consequence of quantile-dependent expressivity is that the selection of subjects by characteristics that distinguish high vs. low phenotype values is expected to produce different genetic effects (Williams 2020k). Traditionally, these have been interpreted as gene-environment interactions where the environmental conditions modify genetic influences, or where the genotypes modify the susceptibility of the phenotype to the environment (Falconer and Mackay 1996). However, many reported gene-drug, gene-diet, and gene-environment interactions have been shown to be potentially attributable wholly or in part to quantile-dependent expressivity for adiposity [56 examples of interactions (Williams 2020a)], postprandial lipemia [64 examples (Williams 2020j)], and triglyceride [76 examples (Williams 2020c)], total cholesterol [21 examples (Williams 2020e)], high-density lipoprotein cholesterol [88 examples (Williams 2020d, 2020k)], adiponectin [15 examples (Williams 2020f)], C-reactive protein [50 examples (Williams 2021a)], plasminogen activator inhibitor type-1 [22 examples (Williams 2021b)], and leptin concentrations [16 examples (Williams 2020b)]. The examples to follow suggest that several purported interactions involving VEGF and HGF might be more simply explained by quantile-dependent expressivity.
Metabolic syndrome
The rs6921438 polymorphism is located 171 kb downstream from the VEGF locus on chromosome 6p21.1. It is reported to explain 41.2 percent of the variance in serum VEGF concentrations (Debette et al. 2011). Ghazizadeh et al. (2018) reported that metabolic syndrome produced a greater effect in carriers of the G-allele than AA homozygotes of the rs6921438 polymorphism (P=0.04), as shown in Figure 3C. Specifically the histogram, which displays their results from a precision medicine perspective, shows the difference in mean VEGF concentrations between patients with and without the condition was 38.2 pg/ml in G-allele carriers vs. 6.8 pg/ml in AA homozygotes. However, mean VEGF concentrations were higher in those with metabolic syndrome than controls (111.3 vs. 82.4 pg/ml). From the perspective of quantile-dependent expressivity, the line graph shows there was a greater difference between genotypes at the higher mean VEGF concentrations of the metabolic syndrome patients than at the lower concentrations of controls (GG/GA minus AA genotype difference: 54.78 vs. 23.39 pg/ml).
The rs10738760 polymorphism is located on chromosome 9p24.2 between the KCNV2 and VLDLR genes (Debette et al. 2011). Rs10738760 and rs6921438 together explain nearly one-half of the VEGF variance (Debette et al. 2011). A second paper by Ghazizadeh et al. (2017) reported that the odds for metabolic syndrome were significantly greater in rs10738760 AA/GA genotypes than GG homozygotes (P=0.04). The histogram of Figure 3D shows a 42.7 pg/ml effect of metabolic syndrome in carriers of the A-allele vs. an 8.1 pg/ml effect in GG homozygotes. Again, from the perspective of quantile-dependent expressivity, this could also be attributed to a larger difference between genotypes at the higher average VEGF concentrations in the metabolic syndrome patients than controls (AA/AG minus GG difference: 53.2 vs. 18.6 pg/ml).
Serum VEGF concentrations are reported to be greater in obese than healthy weight subjects (Wiewioraet et al. 2020), and to decrease significantly following weight loss surgery (Wiewioraet et al. 2020) or caloric deficit (Duggan et al. 2017). Data presented by Oana et al. (2014) suggested VEGF differences between obese and normal-weight children showed an increase per G-allele of the interleukin-6 572G/C (rs1800796) polymorphism (Figure 3E histogram), corresponding to a larger difference between genotypes at the higher VEGF concentrations of the obese vis-à-vis healthy weight children (line graph).
Diet
Schuler et al. (2018) reported that the effects of increasing dietary fat on serum VEGF concentrations were significantly affected by rs9472159 (in linkage disequilibrium with rs6921438 (Stathopoulou et al. 2013) and postulated to regulate VEGF expression (Schüler et al. 2018)). Specifically, they reported that serum VEGF concentrations increased significantly more when switching from 30% to a 45% fat diet in rs9472159 CC homozygotes than in CA heterozygotes (P=0.01) or AA homozygotes (P=0.02, Figure 3F histogram). However, VEGF concentrations were significantly higher at the end of high-fat than low-fat diet (292.8±20.1 vs. 271.5±18.0 pg/ml, P=0.002), and we estimate from their figure 5A that the difference between homozygotes was greater at the higher mean concentration of the high fat diet than at the lower mean concentration of the low-fat diet (CC minus AA: 443 vs. 365 pg/ml).
Hepatocellular carcinoma
Hepatocellular carcinoma is commonest primary hepatic neoplasia, developing mostly from chronic liver disease but also hepatitis B and C virus, alcohol, smoking, and aflatoxins exposure (Lafaro et al. 2015). VEGF is an important angiogenic factor in hepatocellular carcinoma development (Kaseb et al. 2009). Data presented by Baitello et al. (2016) showed that VEGF concentrations were significantly greater in hepatocellular carcinoma patients than cirrhosis patients or healthy controls for T-allele carriers of VEGF 936 C/T (rs3025039, P=0.004) and A-allele carriers of VEGF −1154 G/A (rs1570360, P=0.007) but not in CC and GG homozygotes, respectively (Figure 4A and 4B histograms). Consistent with quantile-dependent expressivity, the associated line graphs show that the differences between genotypes were greater at the higher VEGF concentrations of the hepatocellular carcinoma patients.
Figure 4.
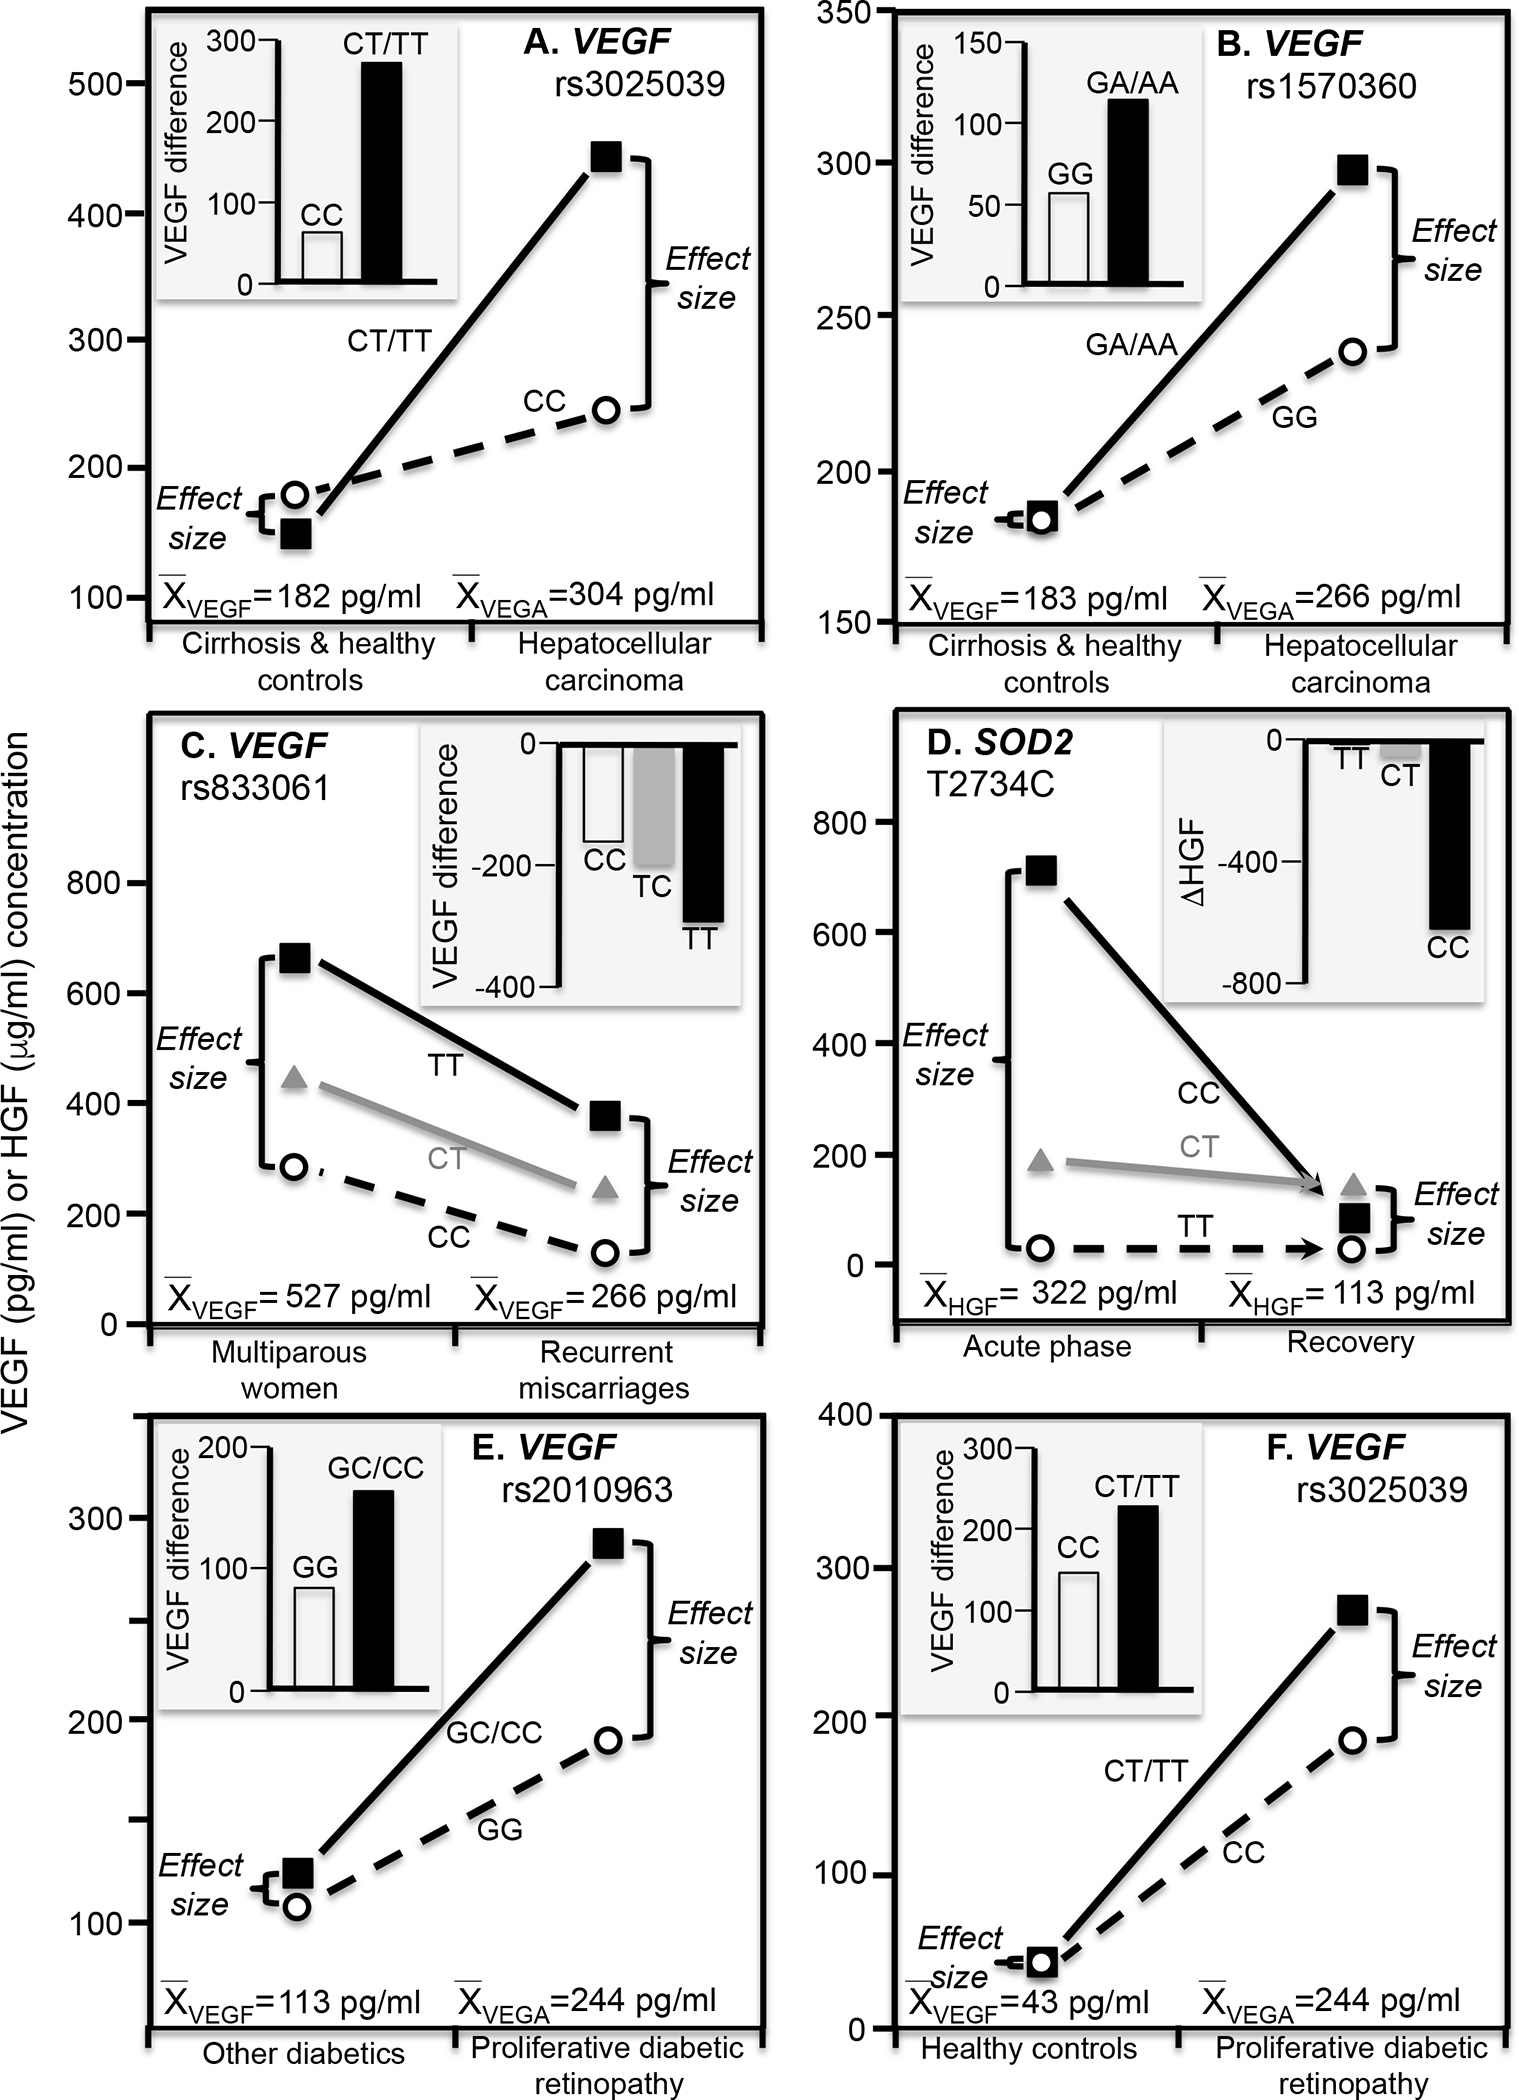
Precision medicine perspective of genotype-specific effects on serum growth factor concentrations (histogram inserts) vs. quantile-dependent expressivity perspective of larger genetic effect size when average VEGF or HGF concentrations were high (line graphs) for: A) Baitello et al.’s 2016 report of the VEGF difference between hepatocellular carcinoma and cirrhosis or healthy controls by VEGF rs3025039 genotypes; B) Baitello et al.’s 2016 report of the VEGF difference between hepatocellular carcinoma and cirrhosis or healthy controls by VEGF rs1570360 genotypes; C) Almawi et al’s 2013 report on the VEGF difference between women with recurrent spontaneous miscarriage vs. multiparous women by VEGF −460T/C (rs833061) genotypes; D) Emene et al.’s 2017 report on the reduction in HGF concentrations from the initial acute phase of an erysipelas infection to its recovery phase by superoxide dismutase 2 (SOD2) rs11575993 genotypes; E) Choudhuri et al.’s 2015 report on the VEGF difference between T2DM patients with and without proliferative diabetic retinopathy by rs2010963 genotypes; F) Choudhuri et al.’s 2015 report on the VEGF difference between patients with proliferative diabetic retinopathy and healthy controls by rs3025039 genotypes.
Recurrent spontaneous miscarriage
VEGF regulates endothelial cell integrity and activity during embryogenesis. It is essential for optimal trophoblast proliferation, and adequate maternal and fetal circulation during early pregnancy (Almawi et al. 2013). Recurrent spontaneous miscarriages (≥3 unexplained first trimester pregnancy losses) are associated with reduced VEGF expression and serum concentrations (Almawi et al. 2013). The histogram in Figure 4C from the data presented by Almawi et al. (2013) shows that differences in serum VEGA concentrations between women who repeatedly miscarried and multiparous women was greatest in TT homozygotes of VEGF −460T/C (rs833061) polymorphisms (−290±37.9 pg/ml), intermediate in TC heterozygotes (−198±30.0 pg/ml), and least in CC homozygotes (−162±25.5 pg/ml, PTT-CC= 0.006). Correspondingly, the difference between TT and CC homozygotes was greater in the multiparous women (379±34.7 pg/ml) in accordance with their higher average VEGA concentrations (527±15.7 pg/m) than in those who repeatedly miscarried (251±29.7 pg/ml), in accordance with their lower VEGA concentrations (265.6±13.1 pg/ml).
Erysipelas
Erysipelas is an acute β-hemolytic streptococcus bacterial infection of the upper dermis and superficial lymphatic vessels of primarily the legs and face (Henningham et al. 2015). Superoxide dismutase 2 (SOD2) is a mitochondrial antioxidant that prevents harmful effects of free radicals. Emene et al. (2017) reported that relative to recovery, CC homozygotes of the SOD2 rs11575993 (T2734C) polymorphism had significantly elevated HGF concentrations during the acute phase of erysipelas infections that were substantially reduced by treatment (Figure 4D). From the perspective of quantile expressivity, the substantially elevated HGF concentrations during the acute phase vis-à-vis recovery (322 vs. 113 pg/ml) accentuated the HGF differences between SOD2 genotypes.
Diabetic retinopathy
Diabetic retinopathy is an incapacitating microvascular complication where diabetes-induced damage to small blood vessels leak blood and other fluid causing retinal tissue to swell. A more advanced condition is proliferative diabetic retinopathy, where widespread vessel growth in the retina and vitreous occurs due to the retina being deprived of oxygen. VEGF is up-regulated in subjects with the minor (C) allele of VEGF rs2010963 or minor (T) allele of rs3025039 polymorphism in diabetic retinopathy and its microvascular complications. Choudhuri et al. (2015) reported that rs2010963 serum VEGF genotype differences were greatest in patients with proliferative diabetic retinopathy (P<0.0001) and highest average VEGF concentrations, intermediate in T2DM without proliferative diabetic retinopathy and intermediate VEGF concentrations, and least in healthy controls that had the lowest average VEGF concentrations (Figure 4E). Results were similar for rs3025039 genotypes (Figure 4F).
Logarithmic transformation.
Right-skewed or semi-skewed data are routinely logarithmically transformed to satisfy the normality assumption required for parametric hypothesis testing. The majority of candidate gene and GWA (Lieb et al. 2015; Debette et al. 2011; Choi et al. 2016), heritability (Lieb et al. 2009, 2010; Berrahmoune et al. 2007; Pantsulaia et al. 2004; Schüler et al. 2018) and association studies (Lieb et al. 2009) of these growth factors and receptors involve logarithmically transformed phenotypes. Quantile-regression does not require normality distributed data and thus provides additional insights into the genetic inheritance of growth factors as originally measured. The logarithmic transformation accentuates genetic effects at the lower concentrations whilst diminishing those at higher concentrations changed. As illustrated in Supplementary Figures 2A and 2B, logarithmically transforming serum VEGF concentrations actually reversed the quantile-dependence of h2 from increasing to decreasing h2 with increasing percentiles of the VEGF distribution. Thus logarithmically transform VEGF, HCF, and receptor concentrations obfuscate the differences in heritability between high and low concentration of these phenotypes. We are aware of no biological rationale for logarithmically transforming protein serum concentrations of right-skewed phenotypes but not symmetric phenotypes. Presumably, selection pressures would affect deleterious genetic variants differently depending upon whether the biologically relevant phenotype was the untransformed (accentuating high-valued genotype differences) or log-transformed concentration (suppressing high-valued genotype differences).
Limitations
The estimates of VEGF heritability from Falconer’s formula probably inadequately represent the complexity VEGF genetics as suggested by heritability greater than 1 at the VEGF 90th percentile. Moreover, full-sibling regression slopes from HGF, angiopoietin-2, sTie-2, and sFlt-1 probably include shared environmental effects in addition to genetic concordance (e.g. 20.1% of VEGF variance has been attributed to unknown common familial factors (Pantsulaia et a. 2004)). We also note that only a limited number of published gene-environment interactions are available for assessing their consistency with quantile-dependent expressivity, and those that are seldom include the data required to test its applicability, namely unadjusted growth factor concentrations by condition and genotype. For example, Yi et al. (2016) reported significant effects of the VEGF rs833070 (P<0.01) and VEGF rs3025030 (P<0.01) polymorphisms in rheumatoid arthritis patients whose VEGF concentrations were significantly higher than matched controls (P<0.0001) without presenting the effects of these polymorphisms in controls. Similarly, Almawi et al. (2016) reported significant effects of the VEGF rs2010963 (P=0.05) and VEGF rs3025030 (P=0.007) polymorphisms in polycystic ovary syndrome patients whose VEGF concentrations were significantly higher than matched controls (P=0.007) without presenting the effects of these polymorphisms in the controls.
Conclusions
The current report suggest that genetic influences on serum VEGF, HGF, angiopoietin-2, sTie-2 and sFlt-1 concentrations are quantile-dependent, and that quantile-dependent expressivity may explain reported genetic interactions involving metabolic syndrome, high-fat diet, recurrent spontaneous miscarriage, hepatocellular carcinoma, erysipelas, diabetic retinopathy and bevacizumab and regorafenib treatments with serum VEGF concentrations.
Supplementary Material
Funding:
This research was supported by NIH grant R21ES020700 from the National Institute of Environmental Health Sciences, and an unrestricted gift from HOKA ONE ONE.
Abbreviation key
- ABCG2
ATP binding cassette subfamily G member 2
- βFS
Full-sib regression slope
- βOM
Offspring-midparental regression slope
- βOP
Offspring-parent regression slope
- BMI
Body mass index
- CCL5
C-C motif chemokine ligand 5
- CCR5
C-C motif chemokine receptor 5
- GLUT9
Glucose transporter 9
- GWAS
Genome-wide association studies
- h2
Heritability in the narrow sense
- HGF
Hepatocyte growth factor
- IL-6
Interleukin 6
- KCNV2
Potassium Voltage-Gated Channel Modifier Subfamily V Member 2
- LRP2
Low-density lipoprotein receptor-related protein 2
- NHLBI
National Heart Lung and Blood Institute
- SD
Standard deviation
- SE
Standard error
- sFlt-1
Soluble Fms Related Receptor Tyrosine Kinase 1
- SOD2
Superoxide dismutase 2
- sTie-2
Soluble angiopoietin receptor
- SNP
Single nucleotide polymorphism
- VEGF
vascular endothelial growth factor
- VEGF-A
vascular endothelial growth factor-A
- VEGFR1
Soluble VEGFR1 variant 1
- VLDLR
Very low-density lipoprotein receptor
Footnotes
Conflicts of interest/Competing interests: None to report
Ethics approval Our analyses of these data were approved by Lawrence Berkeley National Laboratory Human Subjects Committee (HSC) for protocol “Gene-environment interaction vs. quantile-dependent penetrance of established SNPs (107H021)” LBNL holds Office of Human Research Protections Federal wide Assurance number FWA 00006253. Approval number: 107H021–13MR20.
Consent to participate. All surveys were conducted under the direction of the Framingham Heart Study human use committee guidelines, with signed informed consent from all participants or parent and/or legal guardian if <18 years of age.
Consent for publication N/A
Availability of data and material:
The data are not being published in accordance with the data use agreement between the NIH National Heart Lung, and Blood Institute and Lawrence Berkeley National Laboratory. However, the data that support the findings of this study are available from NIH National Heart Lung, and Blood Institute Biologic Specimen and Data Repository Information Coordinating Center directly through the website https://biolincc.nhlbi.nih.gov/my/submitted/request. Restrictions apply to the availability of these data, which were used under license for this study. Those wishing a copy of the data set should contact the Blood Institute Biologic Specimen and Data Repository Information Coordinating Center at the above website, where they can find information on human use approval and data use agreement requiring signature by an official with signing authority for their institute.
References
- Almawi Wassim Y, Saldanha Fabiola Lisa, Mahmood Naeema A, Intissar Al-Zaman, Sater Mai S, and Mustafa Fekria E. 2013. “Relationship between VEGFA polymorphisms and serum VEGF protein levels and recurrent spontaneous miscarriage.“ Human reproduction (Oxford, England) 28 (10):2628–35. doi: 10.1093/humrep/det308. [DOI] [PubMed] [Google Scholar]
- Almawi Wassim Y, Emily Gammoh, Malalla Zainab H, and Al-Madhi Safa A. 2016. “Analysis of VEGFA Variants and Changes in VEGF Levels Underscores the Contribution of VEGF to Polycystic Ovary Syndrome.“ PloS one. 11 (11):e0165636. doi: 10.1371/journal.pone.0165636. [DOI] [PMC free article] [PubMed] [Google Scholar]
- Asahara T, Chen D, Takahashi T, Fujikawa K, Kearney M, Magner M, Yancopoulos GD, and Isner JM. 1998. “Tie2 receptor ligands, angiopoietin-1 and angiopoietin-2, modulate VEGF-induced postnatal neovascularization.“ Circulation research. 83 (3):233–240. [DOI] [PubMed] [Google Scholar]
- Baitello Maria Eduarda Lopes, Tenani Graciele Domitila, Rafael Fernandes Ferreira, Nogueira Victor, de Souza Pinhel Marcela Augusta, Rita de Cássia Martins Alves da Silva, et al. 2016. “VEGF Polymorphisms Related to Higher Serum Levels of Protein Identify Patients with Hepatocellular Carcinoma.“ Canadian journal of gastroenterology & hepatology. 2016 :9607054. doi: 10.1155/2016/9607054. [DOI] [PMC free article] [PubMed] [Google Scholar]
- Bates DO, Hillman NJ, Williams B, Neal CR, and Pocock TM. 2002. “Regulation of microvascular permeability by vascular endothelial growth factors.“ Journal of anatomy 200 (6):581–597. [DOI] [PMC free article] [PubMed] [Google Scholar]
- Berrahmoune Hind, Herbeth Bernard, Lamont John V, Christine Masson, Fitzgerald Peter S, and Sophie Visvikis-Siest. 2007. Heritability for plasma VEGF concentration in the Stanislas family study.“ Annals of human genetics. 71 (Pt 1):54–63. doi: 10.1111/j.1469-1809.2006.00298.x. [DOI] [PubMed] [Google Scholar]
- Choi Seung Hoan, Ruggiero Daniela, Sorice Rossella, Song Ci, Nutile Teresa, Smith Albert Vernon, Concas Maria Pina, et al. 2016. “Six Novel Loci Associated with Circulating VEGF Levels Identified by a Meta-analysis of Genome-Wide Association Studies.“ PLoS genetics. 12 (2):e1005874. doi: 10.1371/journal.pgen.1005874. [DOI] [PMC free article] [PubMed] [Google Scholar]
- Choudhuri Subhadip, Chowdhury Imran H, Shibali Das, Dutta Deep, Saha Avijit, Sarkar Rajarshi, Mandal Lakshmi K, Satinath Mukherjee, and Bhattacharya Basudev. 2015. “Role of NF-κB activation and VEGF gene polymorphisms in VEGF up regulation in non-proliferative and proliferative diabetic retinopathy.“ Molecular and cellular biochemistry. 405 (1–2) :265–79. doi: 10.1007/s11010-015-2417-z. [DOI] [PubMed] [Google Scholar]
- Debette Stephanie, Visvikis-Siest Sophie, Chen Ming-Huen, Ndiaye Ndeye-Coumba, Song Ci, Destefano Anita, Safa Radwan, et al. 2011. “Identification of cis- and trans-acting genetic variants explaining up to half the variation in circulating vascular endothelial growth factor levels.“ Circulation research. 109 (5):554–63. doi: 10.1161/CIRCRESAHA.111.243790. [DOI] [PMC free article] [PubMed] [Google Scholar]
- Dixon James A, Oliver Scott C N, Olson Jeffrey L, and Naresh Mandava. 2009. “VEGF Trap-Eye for the treatment of neovascular age-related macular degeneration.“ Expert opinion on investigational drugs. 18 (10):1573–1580. [DOI] [PubMed] [Google Scholar]
- Catherine Duggan, de Dieu Tapsoba Jean, Wang Ching-Yun, Schubert Karen E Foster, and McTiernan Anne. 2017. “Long-Term Effects of Weight Loss and Exercise on Biomarkers Associated with Angiogenesis.“ Cancer epidemiology, biomarkers & prevention : a publication of the American Association for Cancer Research, cosponsored by the American Society of Preventive Oncology. 26 (12):1788–1794. doi: 10.1158/1055-9965.EPI-17-0356. [DOI] [PMC free article] [PubMed] [Google Scholar]
- Emene Charles C, Kravchenko Irina E, Aibatova Gulnaz I, and Rizvanov Albert A. 2017. “Analysis of Serum Cytokines and Single-Nucleotide Polymorphisms of SOD1, SOD2, and CAT in Erysipelas Patients.“ Journal of immunology research. 2017:2157247. doi: 10.1155/2017/2157247. [DOI] [PMC free article] [PubMed] [Google Scholar]
- Falconer DS, and Mackay TFC. 1996. “Introduction to Quantitative Genetics (fourth ed.).“ Longmans Green, Harlow, Essex, UK [Google Scholar]
- Ghazizadeh Hamideh, Fazilati Mohammad, Pasdar Alireza, Avan Amir, Tayefi Maryam, Ghasemi Faeze, Mehramiz Mehraneh, et al. 2017. “Association of a Vascular Endothelial Growth Factor genetic variant with Serum VEGF level in subjects with Metabolic Syndrome.“ Gene. 598:27–31. doi: 10.1016/j.gene.2016.10.034. [DOI] [PubMed] [Google Scholar]
- Ghazizadeh Hamideh, Avan Amir, Fazilati Mohammad, Azimi-Nezhad Mohsen, Maryam Tayefi, Ghasemi Faezeh, Mehramiz Mehrane, et al. 2018. “Association of rs6921438 A < G with serum vascular endothelial growth factor concentrations in patients with metabolic syndrome.“ Gene 667:70–75 [DOI] [PubMed] [Google Scholar]
- Gould WW. 1992. “Quantile regression with bootstrapped standard errors.“ Stata Technical Bulletin. 9:19–21. [Google Scholar]
- Henningham Anna, Döhrmann Simon, Victor Nizet, and Cole Jason N. 2015. “Mechanisms of group A Streptococcus resistance to reactive oxygen species.“ FEMS microbiology reviews 39 (4):488–508. doi: 10.1093/femsre/fuu009. [DOI] [PMC free article] [PubMed] [Google Scholar]
- Hood JD, Meininger CJ, Ziche M, and Granger HJ. 1998. “VEGF upregulates ecNOS message, protein, and NO production in human endothelial cells.“ The American journal of physiology 274 (3): H1054–H1058. [DOI] [PubMed] [Google Scholar]
- Hsu Jerry Y, and Wakelee Heather A. 2009. “Monoclonal antibodies targeting vascular endothelial growth factor: current status and future challenges in cancer therapy.“ BioDrugs: clinical immunotherapeutics, biopharmaceuticals and gene therapy 23 (5):289–304. [DOI] [PubMed] [Google Scholar]
- Kannel WB, Feinleib M, McNamara PM, Garrison RJ, and Castelli WP. 2006. “An investigation of coronary heart disease in families. The Framingham offspring study.“ American journal of epidemiology. 110 (3):281–90. [DOI] [PubMed] [Google Scholar]
- Kaseb Ahmed O, Amr Hanbali, Matthew Cotant, Hassan Manal M, Ira Wollner, and Philip Philip A. 2009. “Vascular endothelial growth factor in the management of hepatocellular carcinoma: a review of literature.“ Cancer. 115 (21):4895–906. doi: 10.1002/cncr.24537. [DOI] [PubMed] [Google Scholar]
- Kieran Mark W, Raghu Kalluri, and Cho Yoon-Jae. 2012. The VEGF pathway in cancer and disease: responses, resistance, and the path forward.“ Cold Spring Harbor perspectives in medicine 2 (12):a006593. doi: 10.1101/cshperspect.a006593. [DOI] [PMC free article] [PubMed] [Google Scholar]
- Koenker R, and Hallock KF 2001. “Quantile regression.“ J Economic Perspectives. 15:143–56. [Google Scholar]
- Lafaro Kelly J, Demirjian Aram N, and Pawlik Timothy M. 2015. “Epidemiology of hepatocellular carcinoma.“ Surgical oncology clinics of North America 24 (1):1–17. doi: 10.1016/j.soc.2014.09.001. [DOI] [PubMed] [Google Scholar]
- Li Jin, Qin Shukui, Xu Ruihua, Yau Thomas C C, Brigette Ma, Hongming Pan, Jianming Xu, et al. 2015. “Regorafenib plus best supportive care versus placebo plus best supportive care in Asian patients with previously treated metastatic colorectal cancer (CONCUR): a randomised, double-blind, placebo-controlled, phase 3 trial.“ The Lancet. Oncology. 16 (6):619–29. doi: 10.1016/S1470-2045(15)70156-7. [DOI] [PubMed] [Google Scholar]
- Lieb Wolfgang, Safa Radwan, Benjamin Emelia J, Vanessa Xanthakis, Yin Xiaoyan, Sullivan Lisa M, Larson Martin G, et al. 2009. “Vascular endothelial growth factor, its soluble receptor, and hepatocyte growth factor: clinical and genetic correlates and association with vascular function.“ European Heart Journal 30 (9):1121–7. doi: 10.1093/eurheartj/ehp007. [DOI] [PMC free article] [PubMed] [Google Scholar]
- Lieb Wolfgang, Zachariah Justin P, Vanessa Xanthakis, Safa Radwan, Chen Ming-Huei, Sullivan Lisa M, Larson Martin G, et al. 2010. “Clinical and genetic correlates of circulating angiopoietin-2 and soluble Tie-2 in the community.“ Circulation. Cardiovascular genetics 3 (3):300–6. doi: 10.1161/CIRCGENETICS.109.914556. [DOI] [PMC free article] [PubMed] [Google Scholar]
- Lieb Wolfgang, Chen Ming-Huei, Larson Martin G, Radwan Safa, Teumer Alexander, Baumeister Sebastian E, Honghuang Lin, et al. 2015. “Genome-wide association study for endothelial growth factors.“ Circulation. Cardiovascular genetics. 8 (2):389–97. doi: 10.1161/CIRCGENETICS.114.000597. [DOI] [PMC free article] [PubMed] [Google Scholar]
- Liekens S, De Clercq E, and Neyts J. 2001. “Angiogenesis: regulators and clinical applications.“ Biochemical pharmacology 61 (3) :253e70. [DOI] [PubMed] [Google Scholar]
- Mukherji SK. 2010. “Bevacizumab (Avastin). American journal of neuroradiology. 31 (2):235–6. doi: 10.3174/ajnr.A1987. [DOI] [PMC free article] [PubMed] [Google Scholar]
- Neagoe Paul-Eduard, Lemieux Caroline, and Sirois Martin G. 2005. “Vascular endothelial growth factor (VEGF)-A165-induced prostacyclin synthesis requires the activation of VEGF receptor-1 and −2 heterodimer.“ The Journal of biological chemistry 280 (11):9904–9912. [DOI] [PubMed] [Google Scholar]
- Oana Mărginean Cristina, Claudia Bănescu, Carmen Duicu, Pitea Ana Maria Voidăzan Septimiu, and Claudiu Mărginean. 2014. “The role of IL-6 572 C/G, 190 C/T, and 174 G/C gene polymorphisms in children’s obesity.“ European journal of pediatrics. 173 (10):1285–96. doi: 10.1007/s00431-014-2315-5. [DOI] [PubMed] [Google Scholar]
- Pantsulaia I, Trofimov S, Kobyliansky E, and Livshits G. 2004. “Heritability of circulating growth factors involved in the angiogenesis in healthy human population.“ Cytokine. 27 (6):152–8. doi: 10.1016/j.cyto.2004.04.005. [DOI] [PubMed] [Google Scholar]
- Peters KG. 1998. “Vascular endothelial growth factor and the angiopoietins: working together to build a better blood vessel.“ Circulation research. 83 (3): 342–343. [DOI] [PubMed] [Google Scholar]
- Reusch P, Barleon B, Weindel K, Martiny-Baron G, Gödde A, Siemeister G, and Marmé D. 2001. “Identification of a soluble form of the angiopoietin receptor TIE-2 released from endothelial cells and present in human blood.“ Angiogenesis. 4 (2):123–131. [DOI] [PubMed] [Google Scholar]
- Saif Muhammad Wasif. 2013. “ Anti-VEGF agents in metastatic colorectal cancer (mCRC): are they all alike?“ Cancer management and research. 5:103–115 [DOI] [PMC free article] [PubMed] [Google Scholar]
- Schneider Bryan P, Molin Wang, Milan Radovich, Sledge George W, Sunil Badve, Ann Thor, Flockhart David A, et al. 2008. “Association of vascular endothelial growth factor and vascular endothelial growth factor receptor-2 genetic polymorphisms with outcome in a trial of paclitaxel compared with paclitaxel plus bevacizumab in advanced breast cancer: ECOG 2100.“ Journal of clinical oncology : official journal of the American Society of Clinical Oncology. 26 (28):4672–8. doi: 10.1200/JCO.2008.16.1612. [DOI] [PMC free article] [PubMed] [Google Scholar]
- Schoettler Nathan, and Brahn Ernest. 2009. “Angiogenesis inhibitors for the treatment of chronic autoimmune inflammatory arthritis.“ Current opinion in investigational drugs. 10 (5):425–433. [PubMed] [Google Scholar]
- Schüler Rita, Nicole Seebeck, Osterhoff Martin A, Veronica Witte, Agnes Flöel, Andreas Busjahn, Alexander Jais, et al. 2018. “VEGF and GLUT1 are highly heritable, inversely correlated and affected by dietary fat intake: Consequences for cognitive function in humans.“ Molecular metabolism. 11:129–136. doi: 10.1016/j.molmet.2018.02.004. [DOI] [PMC free article] [PubMed] [Google Scholar]
- Shibuya Masaubmi. 2006. “Vascular endothelial growth factor receptor-1 (VEGFR-1/Flt-1): a dual regulator for angiogenesis.“ Angiogenesis 9 (4):225–230. [DOI] [PubMed] [Google Scholar]
- Splansky Greta Lee, Corey Diane, Yang Qiong, Atwood Larry D, Cupples L Adrienne, Benjamin Emelia J, et al. 2007. “The Third Generation Cohort of the National Heart, Lung, and Blood Institute’s Framingham Heart Study: design, recruitment, and initial examination.“ American journal of epidemiology. 165 (11):1328–35. doi: 10.1093/aje/kwm021. [DOI] [PubMed] [Google Scholar]
- Stathopoulou Maria G, Amélie Bonnefond, Ndeye Coumba Ndiaye, Mohsen Azimi-Nezhad, Shamieh Said El, Abdelsalam Saleh, Marc Rancier, et al. 2013. “A common variant highly associated with plasma VEGFA levels also contributes to the variation of both LDL-C and HDL-C.“ Journal of lipid research. 54 (2):535–41. doi: 10.1194/jlr.P030551. [DOI] [PMC free article] [PubMed] [Google Scholar]
- Mitsukuni Suenaga, Schirripa Marta, Cao Shu, Zhang Wu, Yang Dongyun, Ning Yan, Cremolini Chiara, et al. 2018. “Gene Polymorphisms in the CCL5/CCR5 Pathway as a Genetic Biomarker for Outcome and Hand-Foot Skin Reaction in Metastatic Colorectal Cancer Patients Treated with Regorafenib.“ Clinical colorectal cancer. 17 (2):e395–E414. doi: 10.1016/j.clcc.2018.02.010. [DOI] [PMC free article] [PubMed] [Google Scholar]
- Suenaga Mitsukuni, Cao Shu, Zhang Wu, Yang Dongyun, Ning Yan, Okazaki Satoshi, Berger Martin D, et al. 2019. “Genetic variants in CCL5 and CCR5 genes and serum VEGF-A levels predict efficacy of bevacizumab in metastatic colorectal cancer patients.“ International journal of cancer 144 (10):2567–2577. doi: 10.1002/ijc.31968. [DOI] [PMC free article] [PubMed] [Google Scholar]
- Yulia Vistoropsky, Trofimov Svetlana, Malkin Ida, Kobyliansky Eugene, and Livshits Gregory 2008. “Genetic and environmental determinants of hepatocyte growth factor levels and their association with obesity and blood pressure.“ Annals of human biology. 35 (1):93–103. doi: 10.1080/03014460701822003. [DOI] [PubMed] [Google Scholar]
- Webb CP, and Vande Woude GF 2000. “Genes that regulate metastasis and angiogenesis.“ Journal of neuro-oncology 50 (1–2):71e87. [DOI] [PubMed] [Google Scholar]
- Wiewiora Maciej, Mertas Anna, Gluck Marek, Nowowiejska-Wiewiora Alicja, Czuba Zenon, and Piecuch Jerzy. 2020. “Effect of Weight Loss Surgery on Biomarkers of Angiogenesis in Obese Patients.“ Obesity surgery. 30 (9):3417–3425. doi: 10.1007/s11695-020-04580-7. [DOI] [PMC free article] [PubMed] [Google Scholar]
- Williams Paul T. 2012. “Quantile-specific penetrance of genes affecting lipoproteins, adiposity and height.“ PloS one. 7 (1):e28764. doi: 10.1371/journal.pone.0028764 [DOI] [PMC free article] [PubMed] [Google Scholar]
- Williams Paul T. 2020a. “Quantile-dependent heritability of computed tomography, dual-energy x-ray absorptiometry, anthropometric, and bioelectrical measures of adiposity.“ International journal of obesity 44 (10):2101–2112. doi: 10.1038/s41366-020-0636-1. [DOI] [PMC free article] [PubMed] [Google Scholar]
- Williams Paul T. 2020b. “Quantile-specific heritability of sibling leptin concentrations and its implications for gene-environment interactions.“ Scientific reports. 10 (1):22152 doi: 10.1038/s41598-020-79116-1 [DOI] [PMC free article] [PubMed] [Google Scholar]
- Williams Paul T. 2020c. “Gene-environment interactions due to quantile-specific heritability of triglyceride and VLDL concentrations.“ Scientific reports 10 (1):4486. doi: 10.1038/s41598-020-60965-9 [DOI] [PMC free article] [PubMed] [Google Scholar]
- Williams Paul T. 2020d. “Quantile-specific heritability of high-density lipoproteins with implications for precision medicine.“ Journal of clinical lipidology 14 (4):448–458.e0. doi: 10.1016/j.jacl.2020.05.099 [DOI] [PMC free article] [PubMed] [Google Scholar]
- Williams Paul T. 2020e. “Quantile-specific heritability of total cholesterol and its pharmacogenetic and nutrigenetic implications.“ International journal of cardiology 327:185–192 doi: 10.1016/j.ijcard.2020.11.070 [DOI] [PMC free article] [PubMed] [Google Scholar]
- Williams Paul T. 2020f. “Quantile-dependent expressivity of plasma adiponectin concentrations may explain its sex-specific heritability, gene-environment interactions, and genotype-specific response to postprandial lipemia.“ PeerJ. 8:e10099. doi: 10.7717/peerj.10099. [DOI] [PMC free article] [PubMed] [Google Scholar]
- Williams Paul T. 2020g. “Quantile-specific heritability of intakes of alcohol but not other macronutrients.“ Behavior genetics. 50 (5):332–345. doi: 10.1007/s10519-020-10005-z. [DOI] [PMC free article] [PubMed] [Google Scholar]
- Williams Paul T. 2020h. “Quantile-specific heritability may account for gene-environment interactions involving coffee consumption.“ Behavior genetics. 50 (2):119–26. [DOI] [PMC free article] [PubMed] [Google Scholar]
- Williams Paul T. 2020i. “Spirometric traits show quantile-dependent heritability, which may contribute to their gene-environment interactions with smoking and pollution.“ PeerJ. 8:e9145. doi: 10.7717/peerj.9145. [DOI] [PMC free article] [PubMed] [Google Scholar]
- Williams Paul T. 2020j. “Quantile-dependent expressivity of postprandial lipemia.“ PloS one. 15 (2):e0229495. doi: 10.1371/journal.pone.0229495 [DOI] [PMC free article] [PubMed] [Google Scholar]
- Williams Paul T. 2020k. “Quantile-dependent expressivity and gene-lifestyle interactions involving high-density lipoprotein cholesterol.“ Lifestyle genomics 14 (1) 1–19 doi: 10.1159/000511421 [DOI] [PMC free article] [PubMed] [Google Scholar]
- Williams Paul T. 2021a. “Quantile-dependent expressivity of serum C-reactive protein concentrations in family sets.“ PeerJ. 9:e10914. doi: 10.7717/peerj.10914. [DOI] [PMC free article] [PubMed] [Google Scholar]
- Williams Paul T. 2021b. “Quantile-specific heritability of plasminogen activator inhibitor type-1 (PAI-1, aka SERPINE1) and other hemostatic factors.“ Journal of thrombosis and haemostasis. (in press). 10.1111/jth.15468 [DOI] [PubMed] [Google Scholar]
- Williams Paul T. 2021c. “Quantile-dependent expressivity of serum uric acid concentrations.“ International Journal of Genomics (in press) [DOI] [PMC free article] [PubMed] [Google Scholar]
- Winer BJ, Brown DR, and Michels KM 1991. “Statistical principles in experimental design.“ Third edition. McGraw-Hill New York. [Google Scholar]
- Yi Jin-Ping, Wu Yu-Zhang, Yu Nan, Yu Zhi-Wu, Xie Fu-Yuan, and Yuan Quan. 2016. “VEGF Gene Polymorphisms Affect Serum Protein Levels and Alter Disease Activity and Synovial Lesions in Rheumatoid Arthritis.“ Medical science monitor: international medical journal of experimental and clinical research. 22:316–24. doi: 10.12659/msm.894912. [DOI] [PMC free article] [PubMed] [Google Scholar]
Associated Data
This section collects any data citations, data availability statements, or supplementary materials included in this article.
Supplementary Materials
Data Availability Statement
The data are not being published in accordance with the data use agreement between the NIH National Heart Lung, and Blood Institute and Lawrence Berkeley National Laboratory. However, the data that support the findings of this study are available from NIH National Heart Lung, and Blood Institute Biologic Specimen and Data Repository Information Coordinating Center directly through the website https://biolincc.nhlbi.nih.gov/my/submitted/request. Restrictions apply to the availability of these data, which were used under license for this study. Those wishing a copy of the data set should contact the Blood Institute Biologic Specimen and Data Repository Information Coordinating Center at the above website, where they can find information on human use approval and data use agreement requiring signature by an official with signing authority for their institute.