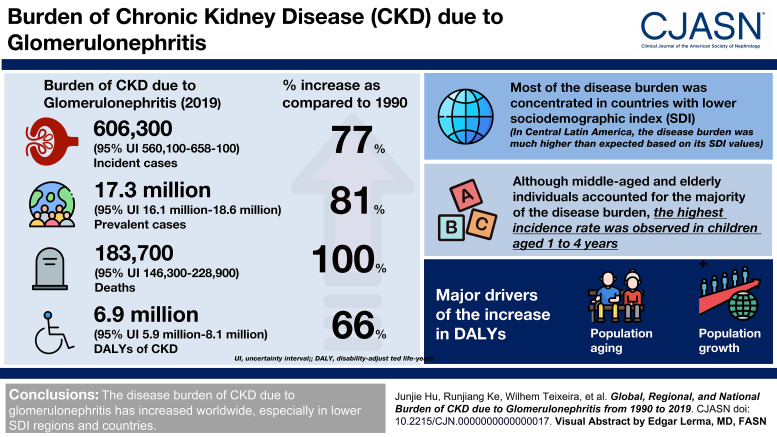
Visual Abstract
Abstract
Background
CKD is becoming a major human health concern. Limited quantitative assessments of the burden of CKD due to glomerulonephritis have been performed. We performed a comprehensive analysis of the disease burden to update the epidemiology of this disease.
Methods
Incidence, prevalence, deaths, and disability-adjusted life-years (DALYs) data and percent changes in these indicators were extracted from Global Burden of Disease Study 2019 to analyze the burden of CKD due to glomerulonephritis.
Results
Globally, there were 606,300 (95% uncertainty interval [UI], 560,100 to 658,100) incident patients, 17,300,000 (95% UI, 16,100,000 to 18,600,000) prevalent patients, 183,700 (95% UI, 146,300 to 228,900) deaths, and 6,900,000 (95% UI, 5,900,000 to 8,100,000) DALYs of CKD due to glomerulonephritis in 2019. Compared with those in 1990, the numbers of incident patients, prevalent patients, deaths, and DALYs increased by 77%, 81%, 100%, and 66%, respectively. Most of the disease burden was concentrated in countries with lower sociodemographic index. In Central Latin America, the disease burden was much higher than expected on the basis of its sociodemographic index. Decomposition analysis showed that population aging and growth were the two major drivers of the increase in DALYs. Frontier analysis revealed considerable opportunities to reduce the age-standardized DALYs in the middle of the sociodemographic-index spectrum. Although middle-aged and elderly individuals accounted for the majority of the disease burden, the highest incidence rate was observed in children aged 1–4 years.
Conclusions
The disease burden of CKD due to glomerulonephritis has increased worldwide, especially in regions and countries with lower sociodemographic indexes.
Introduction
CKD is a significant global public health problem because it increases the risks of kidney failure and a variety of complications.1 CKD is the 18th leading cause of global disability-adjusted life-years (DALYs) lost to disease and accounts for approximately 2% of the global DALYs in 2019. The number of DALYs of CKD increased from 21,500,000 to 41,500,000, a 93% increase, from 1990 to 2019.2 It is expected to become the 13th leading cause of death by 20303 and the fifth most common cause of death by 2040 globally.4 In the Global Burden of Disease Study (GBD) 2019, CKD was classified into five subtypes according to the following causes: diabetes mellitus type 1, diabetes mellitus type 2, hypertension, glomerulonephritis, and other unspecified causes.
The epidemiology of CKD due to glomerulonephritis varies with geographic and demographic factors. Although diabetes and hypertension are the leading causes of CKD in developed countries, glomerulonephritis is still the most common cause of CKD in many low-income countries, mainly in Asia and sub-Saharan Africa.5 However, epidemiologic studies on CKD due to glomerulonephritis are limited, and most of them were performed many years ago and focused on specific locations or subtypes. A more recent comprehensive analysis is required to update the epidemiology of this disease.
In our study, we analyzed recent trends of the incidence, prevalence, deaths, and DALYs of this disease from 1990 to 2019 at the global, regional, and national levels using data from the GBD 2019. Sex, age, and sociodemographic development disparities in the burden of this disease were revealed, providing some enlightening guidance for medical agencies, policy makers, and the general public.
Methods
Data Sources and Significant Definitions
Data in this study were obtained from the GBD 2019 (http://ghdx.healthdata.org/gbd-results-tool), which is the largest and most recent comparative assessment of the burdens of 369 diseases and injuries and 87 risk factors at the global, regional, and national levels. The International Classification of Diseases, Revision 10 (ICD-10), is the current diagnostic standard and contains the most exhaustive cause list; therefore, GBD 2019 used ICD-10 codes (N2–N6.9) as reference to differentiate CKD due to glomerulonephritis and CKD due to other causes. Detailed information is provided in Supplemental Table 1. In our study, we extracted the number of incident patients, prevalent patients, deaths, and DALYs as well as the incidence, prevalence, deaths, and DALYs rates of CKD due to glomerulonephritis in 2019. The definitions of these measurements along with the metrics are specified in Supplemental Table 2. Age-standardized rates were used to evaluate and compare the incidence, prevalence, deaths, and DALYs rates among nations or regions with distinct age structures and demographic characteristics. The sociodemographic index, ranging from 0 to 1, is a socioeconomic indicator closely associated with the health status of each country or territory that reflects the overall fertility rate of women younger than 25 years, average educational attainment, and lag-distributed income per capita in each country or territory. In the GBD 2019, final values were multiplied by 100 for a scale of 0 (worst) to 100 (best).2,6 On the basis of sociodemographic indexes in 2019, 204 countries and territories worldwide were stratified into five groups: high, high-middle, middle, low-middle, and low sociodemographic index.
Data Adjustment and Statistical Analysis
The general methodology of GBD 2019 is described in detail elsewhere.2,7,8 CKD due to glomerulonephritis death data was estimated using the Cause of Death Ensemble model.2,9 The DisMod-MR 2.1 model, a Bayesian meta-regression method, was used to generate estimates of the incidence and prevalence.2,10 DALYs, an optimal measurement of disease burden, were calculated as the sum of years of life lost and years lived with disability. The years of life lost represent premature mortality because of glomerulonephritis-related CKD, and years lived with disability reflect the lifetime living with this disease.10,11
To further investigate the effect of underlying factors on the epidemiology of CKD due to glomerulonephritis from 1990 to 2019, we utilized decomposition analysis to decompose the DALYs change in CKD due to glomerulonephritis by three population-level drivers: population aging, population growth, and age- and population-standardized rates (which we refer to herein as epidemiologic changes) to allow the quantification of the effect of each factor on the total change.11,12
To better understand the variation in the burden of CKD due to glomerulonephritis in countries with the same level of socioeconomic development, we performed frontier analysis to evaluate the potentially achievable age-standardized DALYs on the basis of a given sociodemographic index and identify countries for which performance is lagging or leading relative to other countries with the same level of development.11,12 The detailed methodologies of data adjustment along with decomposition analysis and frontier analysis are displayed in the Supplemental Methods.
Smoothing spline models were fitted to determine the shapes of the correlations between age-standardized rates and the sociodemographic index. These models produced estimates of the average age-standardized rates expected for every level of sociodemographic index.6,13
All metrics (counts, rates) are presented with 95% uncertainty intervals (UIs), which were based on the 25th and 975th ordered values of 1000 draws of the posterior distribution. All rates in this study are reported per 100,000 population. All data processing, analysis, and graphics were performed and created in the R version 4.0.5 platform; the R packages used in our study are provided in Supplemental Table 3.
Results
Burden of CKD due to Glomerulonephritis
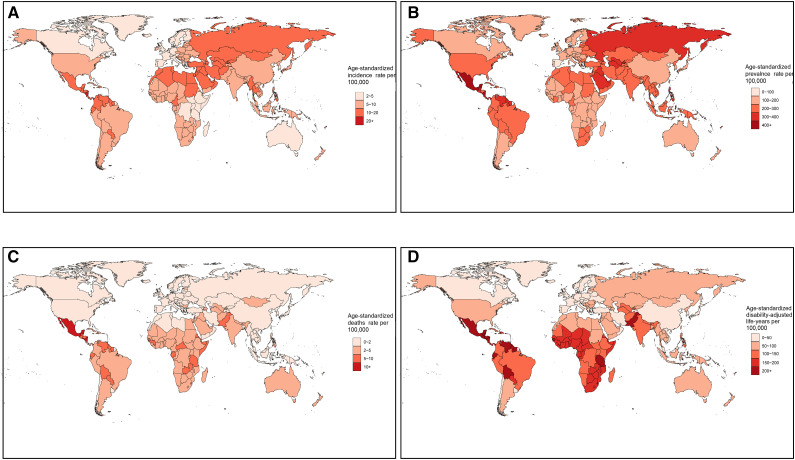
In 2019, the global number of incident patients with CKD due to glomerulonephritis increased by 77% to 606,300 (95% UI, 560,100 to 658,100), accounting for 3% of all CKD patients. The age-standardized incidence rate per 100,000 population increased by 23% to 7.9 (95% UI, 7.3 to 8.5; Table 1). Central Latin America had the highest age-standardized incidence rate (16.6 [95% UI, 15.1 to 18.3]), whereas Western Europe had the lowest (4.3 [95% UI, 3.8 to 4.8]; Supplemental Figure 1A, Supplemental Table 4). The national age-standardized incidence rate varied from 2.9 to 23.5 per 100,000 population, with the highest in Nicaragua and the lowest in Sweden (Figure 1A, Supplemental Table 5). Almost all regions and countries showed upward trends in the age-standardized incidence rates, but nine countries, including Spain, the Republic of Korea, Italy, China, Greece, Poland, the United States, Sweden, and Singapore, showed downward trends (Supplemental Figure 2A, Supplemental Tables 4 and 5).
Table 1.
The global incidence, prevalence, deaths, and disability-adjusted life-years of CKD due to glomerulonephritis in 2019 and percentage change by sex from 1990 to 2019
| Variables | Number in 1990 (×1000) (95% UI) | Number in 2019 (×1000) (95% UI) | Percent Change in Number (95% UI) | Age-Standardized Rate per 100,000 in 1990 (95% UI) | Age-Standardized Rate per 100,000 in 2019 (95% UI) | Percent Change in Rate (95% UI) |
|---|---|---|---|---|---|---|
| Incidence | ||||||
| Global | 342.8 (315.1 to 372.8) | 606.3 (560.1 to 658.1) | 77% (72% to 82%) | 6.4 (5.9 to 7) | 7.9 (7.3 to 8.5) | 23% (21% to 25%) |
| Male | 227.1 (208.4 to 246.2) | 410 (378.4 to 444.2) | 81% (76% to 86%) | 8.5 (7.9 to 9.2) | 10.6 (9.8 to 11.5) | 25% (23% to 26%) |
| Female | 115.7 (105.9 to 127.1) | 196.3 (181.3 to 213.3) | 70% (65% to 75%) | 4.3 (4 to 4.7) | 5.2 (4.8 to 5.6) | 19% (17% to 21%) |
| Prevalence | ||||||
| Global | 9557.4 (8813.6 to 10321.1) | 17,308.1 (16,056.9 to 18,628.9) | 81% (78% to 85%) | 187 (173 to 201.1) | 217.1 (201.3 to 233.5) | 16% (15% to 18%) |
| Male | 5610.9 (5166.9 to 6068.6) | 10,214.3 (9456.6 to 10,978.9) | 82% (79% to 86%) | 219 (202.8 to 235.7) | 257.3 (238.2 to 276.3) | 17% (16% to 19%) |
| Female | 3946.5 (3637 to 4267.8) | 7093.8 (6559.5 to 7678.3) | 80% (76% to 84%) | 155.5 (143.8 to 167.9) | 177.1 (163.9 to 191.2) | 14% (12% to 16%) |
| Deaths | ||||||
| Global | 91.7 (75.5 to 111.2) | 183.7 (146.3 to 228.9) | 100% (82% to 120%) | 2.2 (1.8 to 2.7) | 2.3 (1.9 to 2.9) | 5% (−3% to 12%) |
| Male | 50.9 (42 to 62.1) | 103.1 (82.6 to 128.3) | 102% (83% to 123%) | 2.7 (2.2 to 3.4) | 2.8 (2.3 to 3.6) | 4% (−5% to 12%) |
| Female | 40.7 (33.5 to 49.3) | 80.6 (63.4 to 101.6) | 98% (76% to 122%) | 1.8 (1.5 to 2.2) | 1.9 (1.5 to 2.4) | 4% (−6% to 14%) |
| Disability-adjusted life-years | ||||||
| Global | 4153 (3463.9 to 4844) | 6900.8 (5777.2 to 8125.7) | 66% (52% to 82%) | 84.8 (71.1 to 99.2) | 86.2 (72.3 to 101.2) | 2% (−5% to 9%) |
| Male | 2278.7 (1898.9 to 2669.8) | 3899.7 (3258.9 to 4586.4) | 71% (54% to 88%) | 96.4 (81 to 113.2) | 99.6 (84.1 to 116.8) | 3% (−5% to 12%) |
| Female | 1874.2 (1550 to 2226.1) | 3001.1 (2486 to 3560.2) | 60% (43% to 78%) | 74.9 (62.3 to 88.7) | 73.7 (61.3 to 87) | −2% (−10% to 7%) |
UI, uncertainty interval.
Figure 1.
Worldwide burden of CKD due to glomerulonephritis. Age-standardized incidence (A), prevalence (B), deaths (C), and DALYs (D) rates per 100,000 population in 2019 of CKD due to glomerulonephritis in 204 countries and territories. DALYs, disability-adjusted life-years.
The number of global prevalent patients of CKD due to glomerulonephritis increased by 81% to 17,300,000 (95% UI, 16,100,000 to 18,600,000), accounting for 3% of all CKD patients. The age-standardized prevalence rate per 100,000 population increased by 16% to 217.1 (95% UI, 201.3 to 233.5; Table 1). Similar to incidence, Central Latin America had the highest age-standardized prevalence rate (379.3 [95% UI, 347.1 to 412.5]), whereas Western Europe had the lowest (119.8 [95% UI, 108.8 to 132.9]; Supplemental Figure 1B, Supplemental Table 4). The national age-standardized prevalence rate ranged from 97.7 to 467.2 per 100,000 population, with the highest in Nicaragua and the lowest in Spain (Figure 1B, Supplemental Table 4). Upward trends were observed in all regions and countries except six countries, consisting of the Republic of Korea, Spain, Italy, Poland, Singapore, and Japan (Supplemental Figure 2B, Supplemental Tables 4 and 5).
Accounting for 13% of all deaths because of CKD, global deaths of CKD due to glomerulonephritis increased to 183,700 (95% UI, 146,300 to 228,900) in 2019, representing a 100% increase over the past 30 years. The age-standardized deaths rate per 100,000 population increased by 5% to 2.3 (95% UI, 1.9 to 2.9; Table 1). The highest age-standardized deaths rate was in Central Latin America (9.4 [95% UI, 7.2 to 12.2]), whereas the lowest was in high-income Asia Pacific (0.5 [95% UI, 0.4 to 0.7]; Supplemental Figure 1C, Supplemental Table 4). Considerable global variation of more than 30-fold was observed in the age-standardized deaths rates among countries. Nicaragua, El Salvador, and Mexico had relatively high age-standardized deaths rates, at more than 10 per 100,000 population, whereas Korea had the lowest rate, at 0.4 per 100,000 population (Figure 1C, Supplemental Table 4). The trends of age-standardized deaths rate varied considerably among countries, with the most pronounced increase in Estonia and the sharpest decrease in the Republic of Korea (Supplemental Figure 2C, Supplemental Tables 4 and 5).
Accounting for 17% of total DALYs because of CKD, global DALYs of CKD due to glomerulonephritis increased to 6,900,000 (95% UI, 5,900,000 to 8,100,000), representing a 66% increase from 1990 to 2019. The age-standardized DALYs per 100,000 population increased by 2% to 86.2 (95% UI, 72.3 to 101.2; Table 1). Similar to the deaths rate, the highest age-standardized DALYs was in Central Latin America (303.9 [95% UI, 243.9 to 372.1]), whereas the lowest was in high-income Asia Pacific (21.6 [95% UI, 17.7 to 26]; Supplemental Figure 1D, Supplemental Table 4). Considerable global variation of more than 30-fold was also observed in age-standardized DALYs among countries. Nicaragua, El Salvador, and Mexico were the leading countries with more than 400 DALYs per 100,000 population, whereas the Republic of Korea had the lowest age-standardized DALYs at 15.2 per 100,000 population (Figure 1D, Supplemental Table 5). The trends of age-standardized DALYs varied considerably among countries, with the largest increase in El Salvador and the largest decrease in the Republic of Korea (Supplemental Figure 2D, Supplemental Tables 4 and 5).
Age and Sex Patterns
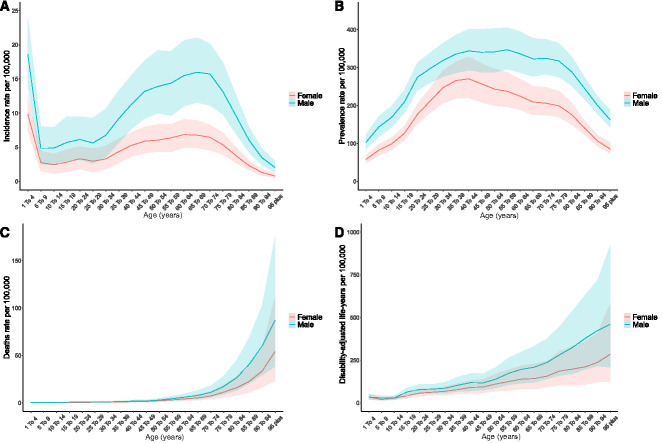
As shown in Figure 2, the highest incidence rate was observed in children aged 1–4 years, followed by a plummeting at the 5–9 age group and increased with age up to 65–69 years and then decreased with older age (Figure 2A). Unlike incidence, a unimodal pattern was observed for age-specific prevalence rate, peaking at the 40–44 age group (Figure 2B). The deaths and DALYs rates increased with age, and a steep increase in the mortality rate was observed in people aged 70 years and older (Figure 2, C and D).
Figure 2.
Age and sex patterns of the global burden of CKD due to glomerulonephritis. Global incidence (A), prevalence (B), deaths (C), and DALYs (D) rates per 100,000 people and their corresponding 95% uncertainty interval in 2019 of CKD due to glomerulonephritis by sex and age.
Supplemental Figure 3 shows the age distribution regarding the number of incident patients, prevalent patients, deaths, and DALYs of CKD due to glomerulonephritis.
Disease Burden by Sociodemographic Index
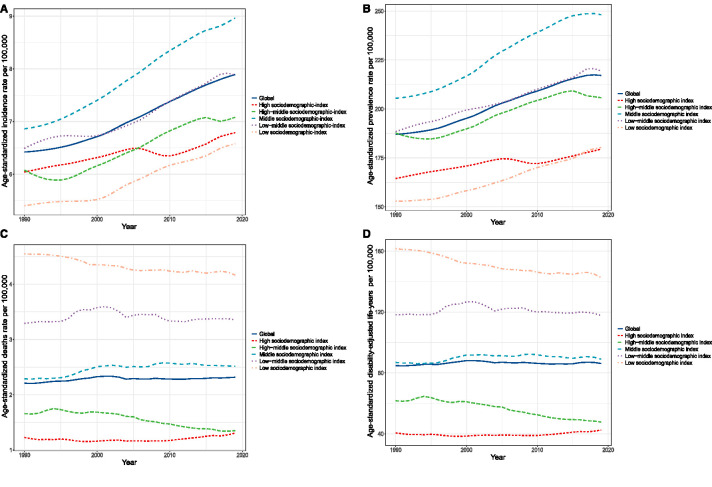
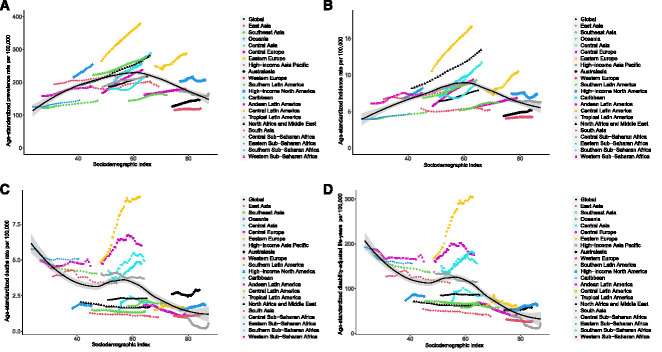
As shown in Figure 3 and Supplemental Table 6, age-standardized incidence and prevalence rates increased gradually with some fluctuations, whereas age-standardized deaths and DALYs rates remained stable with slight changes in different sociodemographic-index quintiles over the past 30 years. Figure 4 shows the observed estimated rates versus the expected rates on the basis of sociodemographic indexes at the regional level. Both age-standardized incidence and prevalence rates exhibited upward trends when the sociodemographic index was below approximately 60; thereafter, the rates decreased with increasing sociodemographic index. Specifically, the age-standardized incidence and prevalence rates were highest in the middle of the sociodemographic-index spectrum (Figure 4, A and B). Regarding age-standardized deaths and DALYs rates, the estimated correlations with sociodemographic index were negative, with gradual decreases as sociodemographic index increased (Figure 4, C and D). The observed burden was lower than expected on the basis of sociodemographic index over the past 30 years at the global level, and the observed patterns varied widely in the middle-sociodemographic-index regions compared with those in other sociodemographic-index quintiles. Central Latin America had higher age-standardized incidence, prevalence, deaths, and DALYs rates than expected on the basis of its sociodemographic index (Figure 4).
Figure 3.
Burden of CKD due to glomerulonephritis in five sociodemographic-index quintiles. The temporal trends of global age-standardized incidence (A), prevalence (B), deaths (C), and DALYs (D) rates per 100,000 people from 1990 to 2019 of CKD due to glomerulonephritis in different sociodemographic-index quintiles.
Figure 4.
Correlations between burden of CKD due to glomerulonephritis and the sociodemographic index. Age-standardized incidence (A), prevalence (B), deaths (C), and DALYs (D) rates per 100,000 population of CKD due to glomerulonephritis in 21 regions, by sociodemographic-index, 1990–2019. Black line and gray ribbon represent expected values of each disease rate and its corresponding 95% confidence interval on the basis of the sociodemographic index in all locations.
Decomposition Analysis of Change in DALYs
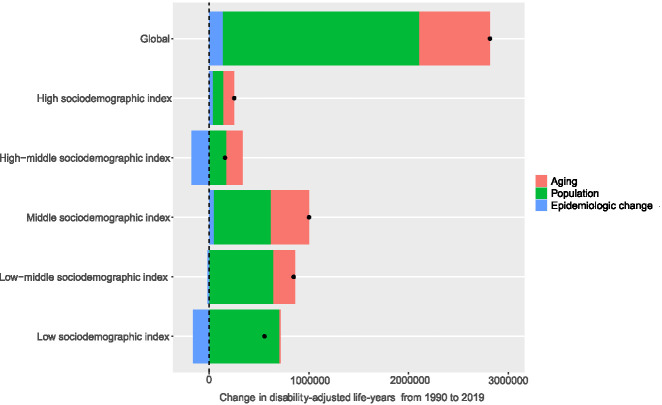
Figure 5 and Table 2 show the decomposition analysis results of changes in DALYs attributable to three population-level determinants, namely, population aging, population growth, and epidemiologic changes, at the global level and in the five sociodemographic-index quintiles. Globally, 70% of the DALYs increase was attributed to population growth, followed by population aging (25%) and epidemiologic changes (5%). The contribution of population growth to the overall DALYs change was most pronounced in the low-sociodemographic-index quintile (126%), followed by the high-middle- (108%), low-middle- (76%), middle- (57%), and high- (42%) sociodemographic-index quintiles. Population aging played a significant role in the total DALYs change in the high-middle-sociodemographic-index quintile (105%), whereas it played a relatively weak role in the high- (44%), middle- (38%), and low-middle- (26%) sociodemographic-index quintiles and nearly vanished in the low-sociodemographic-index quintile (2%). Capturing the trend of age-standardized DALYs, the contribution of epidemiologic changes to overall DALYs changes was positive in the high- (13%) and middle- (4%) sociodemographic-index quintiles, whereas it was negative in the other three quintiles and most evident in the high-middle-sociodemographic-index quintiles (−113%).
Figure 5.
Change in DALYs of CKD due to glomerulonephritis decomposed by three population-level determinants: population aging, population growth, and epidemiological change from 1990 to 2019 at the global level and five sociodemographic-index quintiles. The black dots indicate the total value of change attributable to all three components.
Table 2.
Change in the disability-adjusted life-years of CKD due to glomerulonephritis decomposed by three population-level determinants: population aging, population growth, and epidemiological change from 1990 to 2019 at the global level and five sociodemographic-index quintiles
| Location | Overall Difference | Change due to Population-Level Determinants (% Contribution to the Total Change) | ||
|---|---|---|---|---|
| Population Aging | Population Growth | Epidemiological Change | ||
| Global | 2,816,029.3 | 709,982.2 (25) | 1,973,162.0 (70) | 132,885.1 (5) |
| High sociodemographic index | 251,616.3 | 111,918.2 (44) | 105,736.8 (42) | 33,961.3 (13) |
| High-middle sociodemographic index | 157,969 | 165,234.6 (105) | 170,572.7 (108) | −177,838.3 (−113) |
| Middle sociodemographic index | 1,002,134.9 | 385,455.7 (38) | 573,327.6 (57) | 43,351.6 (4) |
| Low-middle sociodemographic index | 847,111.4 | 220,695.7 (26) | 642,533.9 (76) | −16,118.2 (−2) |
| Low sociodemographic index | 554,734 | 13,802.8 (2) | 700,752.1 (126) | −159,820.9 (−29) |
Decomposition analysis at the regional and national levels revealed a substantial disparity in the contributions of the three determinants to the change in DALYs (Supplemental Table 7). Concerning Central Latin America, represented by Nicaragua, El Salvador, and Mexico, which had the heaviest burden of CKD due to glomerulonephritis worldwide, epidemiologic changes were a prominent contributor to the increase in DALYs.
Frontier Analysis on the Basis of Age-Standardized DALYs
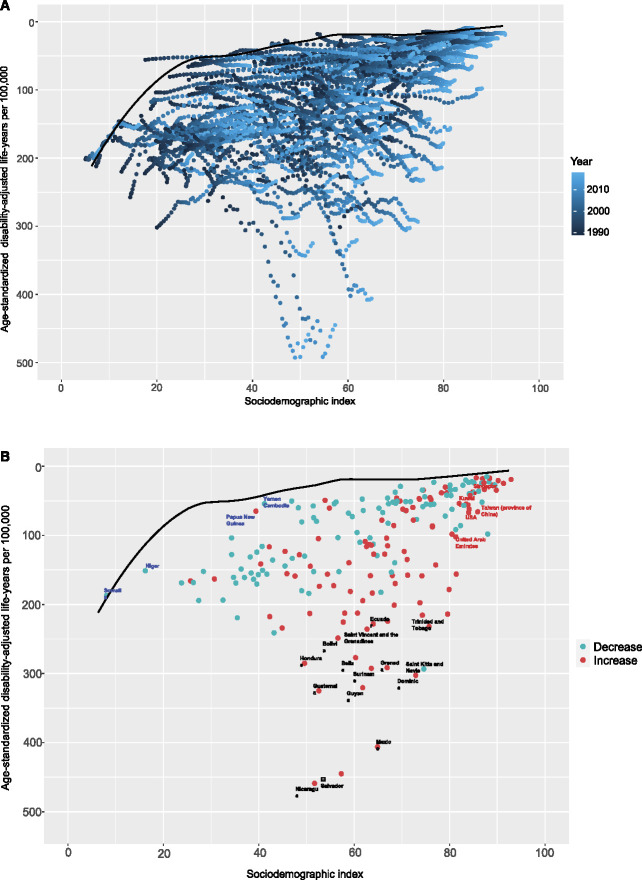
To assess the performance of the DALYs given the development status of a country or territory, we performed frontier analysis on the basis of the age-standardized DALYs and sociodemographic index using data from 1990 to 2019 (Figure 6A). The frontier line delineates the potentially achievable age-standardized DALYs on the basis of the sociodemographic index. The effective difference, namely, the distance from the frontier, represents the gap between the observed and potentially achievable age-standardized DALYs given a country or territory's sociodemographic index. Overall, the lowest effective differences were observed for countries with higher sociodemographic indexes; however, the highest effective differences were in the middle of the sociodemographic-index spectrum. Nicaragua, El Salvador, and Mexico were the top three countries with the greatest opportunity to narrow the gap. Of note, the leading performances were not restricted to developed countries—two countries with low sociodemographic indexes (<20), Somalia and Niger, had minimal effective differences, whereas several countries with high sociodemographic indexes (>85), including the United Arab Emirates, the United States, Taiwan (province of China), Kuwait, and Singapore, delivered disappointing performances on the basis of their sociodemographic indexes (Figure 6B, Supplemental Table 8).
Figure 6.
Frontier analysis on the basis of sociodemographic-index and age-standardized DALYs per 100,000 of CKD due to glomerulonephritis from 1990 to 2019. The frontier line is delineated in black, indicating the potentially achievable age-standardized DALYs on the basis of sociodemographic-index; dots represent the actual age-standardized DALYs in every country and territory. Color scale represents the years from 1990 depicted in dark blue to 2019 in light blue. (A) Frontier analysis on the basis of sociodemographic-index and age-standardized DALYs per 100,000 of CKD due to glomerulonephritis in 2019. The increase in age-standardized DALYs from 1990 to 2019 is shown in red dots, whereas the decrease in green dots. The frontier line, representing the potentially achievable age-standardized DALYs on the basis of sociodemographic-index, is portrayed in black. The top 15 countries with the highest effective difference are labeled in black; the top five countries with the lowest effective difference in low sociodemographic index (<50) are labeled in blue, whereas the highest effective difference in high sociodemographic index (>85) are labeled in red (B).
Discussion
In this study, we revealed that the incidence, prevalence, deaths, and DALYs of CKD due to glomerulonephritis in 2019 increased substantially from 1990 to 2019. Although glomerulonephritis is only the third leading cause of CKD after diabetes14 and hypertension,15 CKD due to glomerulonephritis still accounts for a significant proportion of the burden of CKD, owing to substantial proportions of total CKD-related mortality and DALYs. Population aging and growth were the two major drivers of changes in DALYs. Despite the negative contribution to overall changes in DALYs in many high-income countries, the epidemiological change did not offset the substantial influences of population aging and growth worldwide.
A previous GBD study by Xie et al. reported the burden of CKD due to glomerulonephritis from 1990 to 2016; in the study, the estimates of the age-standardized incidence (58.8 per 100,000) and prevalence (735.7 per 100,000) rates were higher than those in our study, while the age-standardized deaths (2.2 per 100,000) and DALYs (82.2 per 100,000) rates were comparable to our findings. Their study also showed a modest increase in the age-standardized incidence (5%) rate and a decrease in the age-standardized prevalence (−5%), deaths (−7%), and DALYs (−15%) rates from 1990 to 2016.11 The discrepancies between the two findings may be ascribed to many factors. For example, the inclusion criteria for study participants in GBD 2019 are different from those in GBD 2016 because GBD 2019 includes CKD with stage 1 and 2 CKD in its definition. In addition, improvements in data modeling and calibration, along with more primary data in GBD 2019, make our estimates more accurate and reliable, increasing the value of assessing the burden of CKD due to glomerulonephritis.2,16
Developing status is a significant factor contributing to the burden of CKD due to glomerulonephritis. When we analyzed the correlations of age-standardized rates with sociodemographic index, age-standardized deaths and DALYs rates were negatively associated with sociodemographic index, indicating inequities in public health care across all levels of development. Approximately 80% of patients who receive KRT are in Europe, Japan, and North America, whereas patients with kidney failure in regions with limited medical resources have no access to KRT.17,18 Nonetheless, we also found that countries in the middle-sociodemographic-index quintile had higher age-standardized incidence and prevalence rates than countries in the other quintiles, especially countries in the lower quintiles; this could be a result of earlier and more universal detection and lower glomerular filtration rate (GFR) boundary value to indicate KRT in middle-sociodemographic-index countries. In addition, considerable population growth in lower sociodemographic-index regions in recent years might also account for the lower incidence and prevalence rates in low-sociodemographic-index countries.19,20 Despite a significant increase in sociodemographic index, several less developed countries in Central Latin America, such as Mexico, El Salvador, and Nicaragua, had the highest age-standardized incidence, prevalence, deaths, and DALYs rates over the past few decades, probably resulting from genetic, environmental, ethnic, and other risk factors; this needs further exploration in the future.21
Frontier analysis revealed considerable heterogeneity in the effective differences across the sociodemographic-index spectrum. Most notably, countries with low sociodemographic index (e.g., Somalia and Niger) had exceeding performances despite limited resources, reflecting the GBD theme “development is not destiny.”12 Given the limited medical resources in less developed countries, we encouraged government and medical agencies in these countries to reduce the burden of this disease by strengthening early screening, popularizing health knowledge, improving sanitary conditions, and so on.22 Nonetheless, the shortage of nephrologists and a nephrology health workforce remained a crucial problem, especially in low-income countries, which requires public sector intervention and international solidarity mechanisms to close the existing global nephrology workforce gap.23
Considering the global demographic structure, middle-aged and elderly individuals accounted for the majority of the disease burden. Nonetheless, children aged 1–4 years had the highest incidence rate, with relatively lower prevalence, deaths, and DALYs rates, implying the age-specific epidemiological trait of this disease. Children, especially in those aged 2–12 years, are susceptible to glomerulonephritis and are more likely to develop CKD owing to their immature immune function.24 Minimal change glomerulosclerosis is the main cause of glomerular disease in children, who tend to have a better prognosis, and most patients recover relatively rapidly and completely.25 However, this conclusion should be interpreted with caution and evaluated in additional high-quality epidemiological studies because scarce epidemiological evidence supports high incidence in this age group. Because the highest mortality and DALYs rates were observed in older people, the overall burden of this disease is expected to increase because of population aging.
Although significant improvements in data collection and modeling were made in the GBD 2019, the inherent limitations of GBD 2019 cannot be ignored in our study. First and foremost, some countries with the highest burden (e.g., Mexico, El Salvador, and Nicaragua) were defined as nonstandard countries with sparse high-quality data. The results in those locations were obtained by mathematical modeling using the available coefficients of their parent locations; therefore, the national estimates should be interpreted with caution. Furthermore, even when data were available, inconsistencies in diagnostic thresholds and measurement methods could result in data deviations. Second, ascertainment of the etiology of CKD is difficult. Although kidney biopsy is regarded as the gold-standard method for determining the underlying causes of CKD, it is recommended only when ascertainment of the etiology is essential for identifying a treatment schedule and the safety of the operation can be guaranteed. In most patients, the confirmation of the cause of CKD relies on a history of a primary kidney disease, which is especially common in a number of low-income countries and leads to potential misdiagnoses and missed diagnoses.26 Third, available data were mainly obtained from in-hospital patients; therefore, the data of a substantial number of out-of-hospital patients with mild symptoms or with earlier stages of CKD who did not seek medical service might be missing. In consequence, only a proportion of the disease burden might be elucidated in the GBD. Finally, the diagnostic criteria of CKD are incomplete. As presented in the Kidney Disease Improving Global Outcomes 2012 Clinical Practice Guidelines, CKD can be diagnosed only when structural or functional abnormalities are present for more than 3 months, including pathological, laboratory, imaging findings, or a GFR < 60 ml/min per 1.73 m2.27 Nonetheless, the CKD data in the GBD were dependent on only the measurement of the estimated glomerular filtration rate and urinary albumin to creatinine ratio and the observation duration could not be ensured, possibly resulting in exaggerated epidemiological data in our study.
In conclusion, the incidence, prevalence, deaths, and DALYs of CKD due to glomerulonephritis have increased worldwide, especially in less developed regions and countries, such as Mexico, El Salvador, and Nicaragua in Central Latin America. Frontier analysis suggested that there were considerable opportunities to narrow the gap between the observed and achievable age-standardized DALYs rates in the middle sociodemographic-index countries and regions. Some less developed countries with leading performance such as Somalia and Niger might serve as examples for other countries, especially those with low sociodemographic indexes, to optimize health outcomes considering their level of development. Despite a significant proportion of the disease burden in middle age and the elders, the highest incidence rate was observed in children aged 1–4 years. More reasonable medical resource distribution, preventive measures, and supportive policies are urgently needed to alleviate the burden of this disease.
Supplementary Material
Acknowledgments
We thank all doctors, epidemiologists, statisticians, or other related persons who devoted their time and energy to the establishment and accomplishment of the GBD study rounds. Thanks to Xiao Ming (Xiaoming_room@hotmail.com) for his work on the GBD database. His excellent sharing of GBD database analysis procedure makes it easier for us to explore the GBD database.
Footnotes
J. Hu, R. Ke, W. Teixeira, Y. Dong, and R. Ding contributed equally to this work as co-first authors.
See related editorial, “Trends in the Global Burden of Glomerulonephritis,” on pages 14–16.
Disclosures
All authors have nothing to disclose.
Funding
This study was supported by the Military Special Research Task of Family Planning to Xing Ai.
Author Contributions
Y. Dong, J. Hu, J. Shang, and D.-W. Ye conceptualized the study; R. Ding, J. Hu, and R. Ke were responsible for data curation; R. Ding, J. Hu, and R. Ke were responsible for formal analysis; Y. Dong, J. Hu, and R. Ke were responsible for methodology; R. Ding, Y. Dong, J. Hu, and R. Ke were responsible for software; R. Ding, Y. Dong, J. Hu, R. Ke, W. Teixeira, and J. Yang were responsible for visualization; X. Ai, J. Shang, and D.-W. Ye were responsible for supervision; J. Hu, J. Shang, and D.-W. Ye were responsible for validation; J. Shang was responsible for investigation; J. Shang and D.-W. Ye were responsible for project administration and resources; J. Hu and W. Teixeira wrote the original draft; and X. Ai, J. Shang, W. Teixeira, J. Yang, and D.-W. Ye reviewed and edited the manuscript.
Data Sharing Statement
The data used in this study can be obtained online (http://ghdx.healthdata.org/gbd-results-tool).
Supplemental Material
This article contains the following supplemental material online at http://links.lww.com/CJN/B77.
Supplementary Methods. Data adjustment, decomposition analysis, and frontier analysis.
Supplemental Table 1. ICD10 codes (N02–N06.9) as reference to the diagnosis of CKD due to glomerulonephritis in this study.
Supplemental Table 2. Definition of measurements and metrics.
Supplemental Table 3. R packages used in this study.
Supplemental Table 4. The regional incidence, prevalence, deaths, and disability-adjusted life-years of CKD due to glomerulonephritis in 2019, and percentage change from 1990 to 2019.
Supplemental Table 5. The incidence, prevalence, deaths, and disability-adjusted life-years of CKD due to glomerulonephritis in 2019, and percentage change from 1990 to 2019 in 204 countries and territories.
Supplemental Table 6. The incidence, prevalence, deaths, and disability-adjusted life-years of CKD due to glomerulonephritis in 2019, and percentage change by sociodemographic-index quintiles from 1990 to 2019.
Supplemental Table 7. Change in the disability-adjusted life-years of CKD due to glomerulonephritis decomposed by three population-level determinants: population aging, population growth, and epidemiological change from 1990 to 2019 at the regional and national levels.
Supplemental Table 8. Frontier age-standardized disability-adjusted life-years and corresponding effective difference of CKD due to glomerulonephritis in 2019 in 204 countries or territories.
Supplemental Figure 1. Burden of CKD due to glomerulonephritis in 21 GBD regions. Age-standardized incidence (A), prevalence (B), deaths (C), and DALYs (D) rates of CKD due to glomerulonephritis per 100,000 population in 2019 in 21 regions.
Supplemental Figure 2. Relative change of burden of CKD due to glomerulonephritis from 1990 to 2019 in 204 countries and territories. Percent change of age-standardized incidence (A), prevalence (B), deaths (C), and DALYs (D) rates of CKD due to glomerulonephritis from 1990 to 2019 in 204 countries and territories, for both sexes.
Supplemental Figure 3. Age and sex patterns of the global burden of CKD due to glomerulonephritis. Global number of incident patients (A), prevalent patients (B), deaths (C), and DALYs (D) of CKD due to glomerulonephritis in 2019, by sex and age.
References
- 1.Chronic Kidney Disease Prognosis Consortium, Matsushita K van der Velde M, et al. Association of estimated glomerular filtration rate and albuminuria with all-cause and cardiovascular mortality in general population cohorts: a collaborative meta-analysis. Lancet. 2010;375:2073-2081. doi: 10.1016/S0140-6736(10)60674-5 [DOI] [PMC free article] [PubMed] [Google Scholar]
- 2.GBD 2019 Diseases and Injuries Collaborators. Global burden of 369 diseases and injuries in 204 countries and territories, 1990–2019: a systematic analysis for the Global Burden of Disease Study 2019. Lancet. 2020;396:1204-1222. doi: 10.1016/S0140-6736(20)30925-9 [DOI] [PMC free article] [PubMed] [Google Scholar]
- 3.Mathers CD, Loncar D. Projections of global mortality and burden of disease from 2002 to 2030. PLoS Med. 2006;3:e442. doi: 10.1371/journal.pmed.0030442 [DOI] [PMC free article] [PubMed] [Google Scholar]
- 4.Foreman KJ Marquez N Dolgert A, et al. Forecasting life expectancy, years of life lost, and all-cause and cause-specific mortality for 250 causes of death: reference and alternative scenarios for 2016-40 for 195 countries and territories. Lancet. 2018;392:2052-2090. doi: 10.1016/S0140-6736(18)31694-5 [DOI] [PMC free article] [PubMed] [Google Scholar]
- 5.Jha V Garcia-Garcia G Iseki K, et al. Chronic kidney disease: global dimension and perspectives. Lancet. 2013;382:260-272. doi: 10.1016/S0140-6736(13)60687-X [DOI] [PubMed] [Google Scholar]
- 6.Safiri S Kolahi AA Hoy D, et al. Global, regional, and national burden of neck pain in the general population, 1990–2017: systematic analysis of the Global Burden of Disease Study 2017. BMJ. 2020;368:m791. doi: 10.1136/bmj.m791 [DOI] [PMC free article] [PubMed] [Google Scholar]
- 7.Ma Q Li R Wang L, et al. Temporal trend and attributable risk factors of stroke burden in China, 1990–2019: an analysis for the Global Burden of Disease Study 2019. Lancet Public Health. 2021;6:e897–e906. doi: 10.1016/S2468-2667(21)00228-0 [DOI] [PMC free article] [PubMed] [Google Scholar]
- 8.GBD 2019 Respiratory Tract Cancers Collaborators. Global, regional, and national burden of respiratory tract cancers and associated risk factors from 1990 to 2019: a systematic analysis for the Global Burden of Disease Study 2019. Lancet Respir Med. 2021;9:1030-1049. doi: 10.1016/S2213-2600(21)00164-8 [DOI] [PMC free article] [PubMed] [Google Scholar]
- 9.Foreman KJ, Lozano R, Lopez AD, Murray CJ. Modeling causes of death: an integrated approach using CODEm. Popul Health Metr. 2012;10:1. doi: 10.1186/1478-7954-10-1 [DOI] [PMC free article] [PubMed] [Google Scholar]
- 10.GBD Chronic Kidney Disease Collaboration. Global, regional, and national burden of chronic kidney disease, 1990–2017: a systematic analysis for the Global Burden of Disease Study 2017. Lancet. 2020;395:709-733. doi: 10.1016/S0140-6736(20)30045-3 [DOI] [PMC free article] [PubMed] [Google Scholar]
- 11.Xie Y Bowe B Mokdad AH, et al. Analysis of the Global Burden of Disease study highlights the global, regional, and national trends of chronic kidney disease epidemiology from 1990 to 2016. Kidney Int. 2018;94:567-581. doi: 10.1016/j.kint.2018.04.011 [DOI] [PubMed] [Google Scholar]
- 12.Li H, Lu W, Wang A, Jiang H, Lyu J. Changing epidemiology of chronic kidney disease as a result of type 2 diabetes mellitus from 1990 to 2017: estimates from Global Burden of Disease 2017. J Diabetes Investig. 2021;12:346-356. doi: 10.1111/jdi.13355 [DOI] [PMC free article] [PubMed] [Google Scholar]
- 13.Wang Y. Smoothing Splines: Methods and Applications. Chapman and Hall/CRC Press; 2011. [Google Scholar]
- 14.Deng Y Li N Wu Y, et al. Global, regional, and national burden of diabetes-related chronic kidney disease from 1990 to 2019. Front Endocrinol (Lausanne). 2021;12:672350. doi: 10.3389/fendo.2021.672350 [DOI] [PMC free article] [PubMed] [Google Scholar]
- 15.Chen A Zou M Young CA, et al. Disease burden of chronic kidney disease due to hypertension from 1990 to 2019: a global analysis. Front Med (Lausanne). 2021;8:690487. doi: 10.3389/fmed.2021.690487 [DOI] [PMC free article] [PubMed] [Google Scholar]
- 16.GBD 2016 Disease and Injury Incidence and Prevalence Collaborators. Global, regional, and national incidence, prevalence, and years lived with disability for 328 diseases and injuries for 195 countries, 1990–2016: a systematic analysis for the Global Burden of Disease Study 2016. Lancet. 2017;390:1211-1259. doi: 10.1016/S0140-6736(17)32154-2 [DOI] [PMC free article] [PubMed] [Google Scholar]
- 17.Harambat J, van Stralen KJ, Kim JJ, Tizard EJ. Epidemiology of chronic kidney disease in children. Pediatr Nephrol. 2012;27:363-373. doi: 10.1007/s00467-011-1939-1 [DOI] [PMC free article] [PubMed] [Google Scholar]
- 18.Shlipak MG Tummalapalli SL Boulware LE, et al. The case for early identification and intervention of chronic kidney disease: conclusions from a Kidney Disease: Improving Global Outcomes (KDIGO) Controversies Conference. Kidney Int. 2021;99:34-47. doi: 10.1016/j.kint.2020.10.012 [DOI] [PubMed] [Google Scholar]
- 19.GBD 2017 Population and Fertility Collaborators. Population and fertility by age and sex for 195 countries and territories, 1950–2017: a systematic analysis for the Global Burden of Disease Study 2017. Lancet. 2018;392:1995-2051. doi: 10.1016/S0140-6736(18)32278-5 [DOI] [PMC free article] [PubMed] [Google Scholar]
- 20.GBD 2019 Demographics Collaborators. Global age-sex-specific fertility, mortality, healthy life expectancy (HALE), and population estimates in 204 countries and territories, 1950–2019: a comprehensive demographic analysis for the Global Burden of Disease Study 2019. Lancet. 2020;396:1160-1203. doi: 10.1016/S0140-6736(20)30977-6 [DOI] [PMC free article] [PubMed] [Google Scholar]
- 21.Sanchez Polo V, Garcia-Trabanino R, Rodriguez G, Madero M. Mesoamerican Nephropathy (MeN): what we know so far. Int J Nephrol Renovasc Dis. 2020;13:261-272. doi: 10.2147/IJNRD.S270709 [DOI] [PMC free article] [PubMed] [Google Scholar]
- 22.James MT, Hemmelgarn BR, Tonelli M. Early recognition and prevention of chronic kidney disease. Lancet. 2010;375:1296-1309. doi: 10.1016/S0140-6736(09)62004-3 [DOI] [PubMed] [Google Scholar]
- 23.Osman MA Alrukhaimi M Ashuntantang GE, et al. Global nephrology workforce: gaps and opportunities toward a sustainable kidney care system. Kidney Int Suppl (2011). 2018;8:52-63. doi: 10.1016/j.kisu.2017.10.009 [DOI] [PMC free article] [PubMed] [Google Scholar]
- 24.Tejani A, Ingulli E. Poststreptococcal glomerulonephritis. Current clinical and pathologic concepts. Nephron. 1990;55:1-5. doi: 10.1159/000185909 [DOI] [PubMed] [Google Scholar]
- 25.Singh GR. Glomerulonephritis and managing the risks of chronic renal disease. Pediatr Clin North Am. 2009;56:1363-1382. doi: 10.1016/j.pcl.2009.09.014 [DOI] [PubMed] [Google Scholar]
- 26.Webster AC, Nagler EV, Morton RL, Masson P. Chronic kidney disease. Lancet. 2017;389:1238-1252. doi: 10.1016/S0140-6736(16)32064-5 [DOI] [PubMed] [Google Scholar]
- 27.Stevens PE, Levin A; Kidney Disease: Improving Global Outcomes Chronic Kidney Disease Guideline Development Work Group Members. Evaluation and management of chronic kidney disease: synopsis of the kidney disease: improving global outcomes 2012 clinical practice guideline. Ann Intern Med. 2013;158:825-830. doi: 10.7326/0003-4819-158-11-201306040-00007 [DOI] [PubMed] [Google Scholar]
Associated Data
This section collects any data citations, data availability statements, or supplementary materials included in this article.
Data Availability Statement
The data used in this study can be obtained online (http://ghdx.healthdata.org/gbd-results-tool).


