


Keywords: kidney disease, genetic kidney disease, glomerular disease, nephrotic syndrome, podocyte, stem cell, malfolding proteins, organoids
Abstract
Significance Statement
Missense variants of NPHS2 that cause mistrafficking of the encoded protein, PODOCIN, have been associated with steroid-resistant nephrotic syndrome. However, most studies have overexpressed such variants in 2D nonpodocyte cells. This study describes the generation and characterization of human kidney organoids representing an allelic series of homozygous NPHS2 missense variants. The strategy revealed a previously unappreciated reduction in variant PODOCIN protein, variant-specific subcellular localization, and specific effects on NEPHRIN association. All variants showed apoptosis in the absence of endoplasmic reticulum stress. Engineering endogenous NPHS2 variants to model in 3D human organoids provides a more accurate view of the pathobiology and a toolkit to screen compounds for reduction of variant protein degradation and mistrafficking.
Background
NPHS2 variants are the most common cause of steroid-resistant nephrotic syndrome in children >1 month old. Missense NPHS2 variants were reported to cause mistrafficking of the encoded protein, PODOCIN, but this conclusion was on the basis of overexpression in some nonpodocyte cell lines.
Methods
We generated a series of human induced pluripotent stem cell (iPSC) lines bearing pathogenic missense variants of NPHS2, encoding the protein changes p.G92C, p.P118L, p.R138Q, p.R168H, and p.R291W, and control lines. iPSC lines were also generated from a patient with steroid-resistant nephrotic syndrome (p.R168H homozygote) and a healthy heterozygous parent. All lines were differentiated into kidney organoids. Immunofluorescence assessed PODOCIN expression and subcellular localization. Podocytes were transcriptionally profiled and PODOCIN-NEPHRIN interaction interrogated.
Results
All variant lines revealed reduced levels of PODOCIN protein in the absence of reduced transcription. Although wild-type PODOCIN localized to the membrane, distinct variant proteins displayed unique patterns of subcellular protein trafficking, some unreported. P118L and R138Q were preferentially retained in the endoplasmic reticulum (ER); R168H and R291W accumulated in the Golgi. Podocyte profiling demonstrated minimal disease-associated transcriptional change. All variants displayed podocyte-specific apoptosis, which was not linked to ER stress. NEPHRIN-PODOCIN colocalization elucidated the variant-specific effect on NEPHRIN association and hence NEPHRIN trafficking.
Conclusions
Specific variants of endogenous NPHS2 result in distinct subcellular PODOCIN localization within organoid podocytes. Understanding the effect of each variant on protein levels and localization and the effect on NEPHRIN provides additional insight into the pathobiology of NPHS2 variants.
Podcast
This article contains a podcast at https://dts.podtrac.com/redirect.mp3/www.asn-online.org/media/podcast/JASN/2023_01_05_JASN2022060707.mp3
Steroid-resistant nephrotic syndrome (SRNS) is one of the most common inherited forms of kidney disease. Affecting the glomerular filtration barrier by causing podocyte foot process effacement, SRNS leads to proteinuria, hypoproteinemia, and edema, progressing to kidney failure. Presenting as an autosomal recessive disease, one commonly mutated gene in SRNS is NPHS2, which encodes PODOCIN.1–3 NPHS2 variants are responsible for >50% of inherited and 20% of patients with sporadic SRNS, presenting across a broad age of onset (3 months to 18 years).4 R138Q missense variants are the most common in both infantile and childhood SRNS.5 Disease-associated NPHS2 variants include missense, nonsense, and splicing variants,1,6 and can present as homozygous or compound heterozygous variants with a phenotype-genotype correlation influencing age of onset.4,6
PODOCIN is a membrane-anchored protein predicted to display a hairpin-like structure, with both N- and C-terminal regions facing the cytoplasm.7 It is a member of the slit-diaphragm protein complex present at the membrane of podocytes in between adjacent foot processes.8 PODOCIN is present as an oligomer in lipid raft microdomains, and is known to directly interact with NEPH-1, NEPHRIN, CD2AP, and TRPC6 via its C-terminal region.8–11 Disease-associated NPHS2 missense variants were previously reported to result in PODOCIN protein misfolding and inappropriate subcellular trafficking.12–16 Some PODOCIN variant proteins do appear to reach the plasma membrane, including G92C or P118L.12,13,15 R291W was described in late endosomes (LE), whereas most others were proposed to mislocalize to the endoplasmic reticulum (ER), including P118L, R138Q, R168H, and R291W.12–16 Although partially reaching the membrane, P118L variant was reported to cause a defect in N-glycosylation, leading the variant C termini to project extracellularly.15 R138Q was reported to predominantly accumulate in the ER,12–14,16,17 but also partially in the Golgi,13,14 and a recent study revealed a rapid degradation of this variant via the proteasome.16 R138Q was not reported to prevent PODOCIN oligomerization, and neither R138Q nor R291W precluded interaction with NEPHRIN, resulting in sequestration of the latter in the ER.2,13 Although this existing analysis provides an insight into specific disease etiology, these previous studies tagged and overexpressed variant PODOCIN in two-dimensional (2D) culture of immortalized podocytes or nonpodocyte lines. Hence, the mislocalization described may result from inappropriate variant proteins levels or inappropriate cellular context.
On the basis of a detailed understanding of kidney development processes, we and others have generated approaches to differentiate human induced pluripotent stem cells (iPSCs) into a complex three-dimensional (3D) multicellular model of the developing human kidney, termed kidney organoids.18–21 The nephrons within kidney organoids show distinct proximodistal segmentation with the formation of glomeruli comprised of a CLAUDIN-1+ parietal epithelial cell–lined Bowman’s capsule, NEPHRIN+ podocytes, and evidence of mesangial and endothelial cell invasion.20,22,23 Organoid glomeruli (OrgGloms) can be isolated via mechanical sieving, as is possible for adult human kidney, and their transcriptional profile shows enhanced expression of key podocyte genes in comparison with existing conditionally immortalized podocyte lines.22,24
In this study, we sought to take advantage of the morphologic accuracy of OrgGloms to improve our understanding of SRNS pathogenesis. Using the CRISPR/Cas9 technology, an allelic series harboring five distinct disease-associated missense variants of the endogenous NPHS2 locus was generated. In all variant lines, we identified quantifiable mistrafficking of variant PODOCIN proteins. This was validated for the R168H variant using kidney organoids from iPSC lines derived from a homozygous patient and healthy heterozygous parent. Distinct PODOCIN variant proteins revealed differential subcellular locations, including previously reported and novel locations, with the mislocalization specific to the variant. Importantly, there was a reduced overall PODOCIN protein level in all variant lines, suggesting increased degradation. Finally, individual PODOCIN variants showed differential effects on NEPHRIN trafficking. Taken together, this expands our knowledge of SRNS pathophysiology and further supports the pertinence of kidney organoids as a model of kidney disease.
Methods
iPSC Line Generation
Gene-Edited iPSC Lines
A healthy foreskin fibroblast cell line (Coriell Institute, Camden, NJ; GM21808) was simultaneously reprogrammed into iPSCs and gene edited to introduce homozygous variants into the endogenous NPHS2 locus, as previously described (Table 1, Supplemental Figure 1).25 Briefly, fibroblasts were harvested with TrypLE Select (Gibco, Waltham, MA; 12563–029), and reprogramming and gene-editing factors (Supplemental File 1) were introduced using the Neon transfection system (1400 V, 20 ms, two pulses). Cells were plated over six wells of a Matrigel (Corning, Corning, NY; 354277)–coated six-well plate in DMEM (Thermo Fisher Scientific, Waltham, MA; 11965–062) FBS 15%. After 3 days, medium was switched to Essential 7 + butyrate26 and refreshed every other day until the first iPSC colonies appeared (approximately 2 weeks). Media were then switched to Essential 8 (E8) medium (Thermo Fisher Scientific; A1517001), and individual colonies were picked and expanded in E8 medium.
Table 1.
Recapitulating sequence variant, corresponding protein change together with anticipated mislocalization of the variant protein on the basis of previous reports,12–16 and the main localization demonstrated in kidney organoids
| Sequence Variant | Protein Change | Anticipated Location | Main Location in Kidney Organoids |
|---|---|---|---|
| c.274G>T | p.G92C | PM | PM |
| c.353C>T | p.P118L | PM extracellular, ER | ER |
| c.413G>A | p.R138Q | ER | ER |
| c.503G>A | p.R168H | ER | Golgi |
| c.871C>T | p.R291W | ER, LE | Golgi, LE |
PM, plasma membrane; Golgi, Golgi apparatus; LE, late endosomes.
To successfully identify gene-edited clones, iPSC colonies were screened using allele-specific PCR primers, and amplicons flanking the variant were Sanger sequenced to confirm gene editing, clonality, and/or absence of indel variants (Table 2, Supplemental Figure 1). Homozygous knock-in clones for each NPHS2 variant were selected for further characterization. Of note, the GE_G92C iPSC line also harbored an indel on one of the two alleles as shown in Supplemental Figure 1, F and G.
Table 2.
PCR primers for amplification before sequencing and Sanger sequencing primers for each variant line generated
| Sequence Variant | Protein Change | PCR Primers | Sequencing Primers |
|---|---|---|---|
| c.274G>T | p.G92C | F-CCACGGTGGTGGACGTGGATG R-CCTTTGCCAAGTTGCTTCGTC |
CCAACCTGTACCACACTCG |
| c.353C>T | p.P118L | F-CCTGTGAACTCTGACTACTC R-CTTCCTGTTCACATTTGAG |
CTTCCTGTTCACATTTGAG |
| c.413G>A | p.R138Q | F-TTTGAAGCAGCCTCAGAAG R-GCATGGGTTGAAGAAATTGG |
AAGCTAGTGCAGAACTCAC |
| c.503G>A | p.R168H | F-GCTATTCTGATTACTTCTGG R-GTACCTTCACAGTAACATCC |
AACGAATATGACATGGAGG |
| c.871C>T | p.R291W | F-CTTATTTGGTCAGTTGTACCC R-CTGCCTCCCTTCATTCTTCAC |
AACTGAGCACAGCTCATCA |
F, forward; R, reverse.
AmpR gene-specific primers were used to detect the presence or absence of episomal vectors used for reprogramming in clonally expanded iPSCs at passage five to six. Absence of episomal vector was confirmed for all clones except for the GE_R168H iPSC line, which produced a moderate band that persisted in subclones. This suggests a potential genomic integration of an episomal vector, unlikely to adversely affect the cell line.
Finally, iPSC pluripotency was confirmed by flow cytometry using the markers SSEA4, TRA- 1–60 and OCT3/4 as described below (Table 3, Supplemental Figure 2A). SNP analysis was carried out by the Victorian Clinical Genetics Service using an Infinium GSA-24 v2.0 DNA microarray to a resolution of 0.5 Mb (Illumina, San Diego, CA). No aneuploidies were detected, and cells tested negative for mycoplasma contamination. The variants introduced into each iPSC line and corresponding protein change are recapitulated in Table 1.
Table 3.
Antibodies used for flow cytometry, immunofluorescence, and Western blot experiments
| Target Protein | Host Species | Application | Dilution Range | Manufacturer | Cat No. |
|---|---|---|---|---|---|
| Calnexin | Mouse | IF | 1:200 | Santa Cruz Biotechnology, Dallas, TX | sc-46669 |
| Caspase-3 | Rabbit | IF | 1:300 | Cell Signaling Technology Danvers, MA | 9661 |
| CD9 | Mouse, FITC-conjugated | FC | 1:10 | BD Biosciences, Franklin Lakes, NJ | 555371 |
| Claudin-1 | Rabbit | IF | 1:100 | Thermo Fisher Scientific, Waltham, MA | 71–7800 |
| E-cadherin | Mouse | IF | 1:300 | BD Biosciences, Franklin Lakes, NJ | 610182 |
| EEA1 | Rabbit | IF | 1:200 | Cell Signaling Technology, Danvers, MA | C45B10 |
| GAPDH | Mouse | WB | 1:5000 | Novus Biologicals, Minneapolis, MN | NB300–221 |
| GATA3 | Rabbit | IF | 1:300 | Cell Signaling Technology, Danvers, MA | 5852S |
| GM130 | Rabbit | IF | 1:200 | Cell Signaling Technology, Danvers, MA | 12480 |
| HNF4 alpha | Mouse | IF | 1:300 | Life Technologies, Waltham, MA | MA1–199 |
| KDEL | Mouse | IF | 1:200 | Enzo Life Sciences, Farmingdale, NY | ADI- SPA-827-D |
| Laminin alpha 5 | Mouse | IF | 1:300 | Abcam, Cambridge, UK | Ab77175 |
| LAMP1 | Mouse | IF | 1:200 | Cell Signaling Technology, Danvers, MA | 15665 |
| Lotus tetragonolobus lectin (LTL) | Biotinylated lectin | IF | 1:300 | Vector Laboratories, Newark, CA | B-1325 |
| Nephrin | Sheep | IF | 1:300 | Bioscientific, Kirrawee, New South Wales, Australia | AF4269 |
| OCT3/4 | Mouse, PE-conjugated | FC | 1:5 | BD Biosciences, Franklin Lakes, NJ | 560186 |
| Podocin | Rabbit | IF | 1:300 | Sigma Aldrich, Burlington, MA | P0372 |
| Podocin | Goat | WB | 1:1000 | Abcam, Cambridge, UK | Ab177242 |
| Rab7 | Mouse | IF | 1:200 | Abcam, Cambridge, UK | Ab50533 |
| SSEA-4 | Mouse, Alexa Fluor 647-conjugated | FC | 1:20 | BioLegend, San Diego, CA | 330408 |
| SSEA-4 | Mouse, PE/Cy7-conjugated | FC | 1:100 | BioLegend, San Diego, CA | 330420 |
| Synaptopodin | Goat | IF | 1:200 | Santa Cruz Biotechnology, Dallas, TX | Sc-21537 |
| TRA-1–60 | Mouse, BV421 conjugated | FC | 1:20 | BD Biosciences, Franklin Lakes, NJ | 562711 |
| TRA-1–81 | Mouse, Alexa Fluor 647-conjugated | FC | 1:100 | BioLegend, San Diego, CA | 330706 |
| Alexa Fluor 405 | Streptavidin | IF | 1:400 | Life Technologies, Waltham, MA | S32351 |
| Alexa Fluor 488 anti-Goat | Donkey | IF | 1:400 | Molecular Probes, Waltham, MA | A11055 |
| Alexa Fluor 488 anti-Mouse | Donkey | IF | 1:400 | Life Technologies, Waltham, MA | A21202 |
| Alexa Fluor 568 anti-Rabbit | Donkey | IF | 1:400–1:500 | Life Technologies, Waltham, MA | A10042 |
| Alexa Fluor 647 anti-Rabbit monovalent Fab fragment | Donkey | IF | 1:400 | Jackson Immuno, West Grove, PA | 711–607–003 |
| Alexa Fluor 647 anti-Goat | Donkey | IF | 1:400 | Life Technologies, Waltham, MA | A21447 |
| Alexa Fluor 647 anti-Sheep | Donkey | IF | 1:400 | Molecular Probes, Waltham, MA | A21448 |
| Anti-Goat IgG (H+L) Cross-Adsorbed | Chicken, HRP- conjugated | WB | 1:5000 | Invitrogen, Waltham, MA | A15969 |
| Anti-Mouse IgG | Horse, HRP-conjugated | WB | 1:1000 | Cell Signaling Technology, Danvers, MA | 7076P2 |
IF, immunofluorescence; FC, flow cytometry; WB, Western blot.
Patient-Derived iPSC Lines
A patient was identified as homozygous for the known pathogenic variant c.503G>A (p.R168H) in exon 4 of the NPHS2 gene. iPSCs were derived from peripheral blood mononuclear cells (PBMCs) from the patient (male) and his mother (control), as previously described.22 Briefly, PBMCs were isolated from whole blood by density gradient centrifugation and cultured in erythroid expansion medium (Stem Cell Technologies, Tullamarine, Victoria, Australia; 09605 and 02692) for 7 days. At day 7, 500,000 PBMCs were infected with Sendai virus (Life Technologies, Waltham, MA; A167517) with multiplicities of infection (MOIs) of 5, 5, and 5 (i.e., KOS MOI = 5, hc-Myc MOI = 5, h-Klf4 MOI = 5) in the presence of polybrene (4 μg/ml) for 24 hours. Then 3 days after transduction, cells were plated onto MEFs in a 50:50 mix of StemSpan SFEM II (Stem Cell Technologies; 09605) and hiPSC media, with progressive increase of hiPSC media content to 100% at day 7. Colonies were picked and expanded at day 21. Three clones were selected for further characterization. Pluripotency of iPSCs was confirmed by flow cytometry using the markers SSEA4, TRA-1–81, and CD9, as described below (Table 3, Supplemental Figure 2B). SNP analysis was carried out by the Victorian Clinical Genetics Service using an Infinium GSA-24 v2.0 DNA microarray (Illumina). No aneuploidies were detected, and cells tested negative for mycoplasma contamination.
Clinical Case Summary and Histopathology
The proband presented at 3.5 years of age with edema, ascites, hypoalbuminemia (serum albumin, 11 g/L), and proteinuria (protein:creatinine ratio, 1600 mg/mmol) after a year of intermittent edema. He had low serum vitamin D and hypothyroidism, suggestive of longstanding proteinuria, and was noted to have microscopic hematuria, hypertension, and a bicuspid aortic valve. He was an otherwise well boy, with normal growth and development, he had no dysmorphic features, and he had normal kidney function. His parents had no history of consanguinity or family history of kidney disease. He did not respond to 4 weeks of prednisolone therapy, and a kidney biopsy was performed. In total, 40 glomeruli were examined by light microscopy, showing widespread severe chronic glomerular injury, with 20 glomeruli showing prominent sclerosing lesions, some of which were cellular with a component of segmental proliferation. Most glomeruli showed mild global mesangial matrix expansion and hypercellularity. Many of the segmental sclerosing lesions were associated with capsular adhesions, and several glomeruli showed extraglomerular proliferation. Immunohistochemisty was negative. Electron microscopy showed extensive foot process effacement with focal microvillous change in podocytes. Chronic glomerular damage and some thickening of the glomerular basement membrane. The trilaminar basement membrane structure was maintained, and no immune complex deposits were demonstrated. Light and electron microscopy supported a diagnosis of focal and segmental glomerulosclerosis. He was started on ramipril and cyclosporin, as per hospital guidelines at that time, 2015. His prednisolone was weaned while continuing regular infusions of albumin and frusemide. His edema stabilized and he no longer required albumin infusions after 4 months, although there was no improvement in his proteinuria, and mycophenolate mofetil was started after 6 months. Then, 7 months into his treatment, his genetic results were returned showing a homozygous pathogenic variant in NPHS2, and his immunosuppression was slowly weaned. His kidney function slowly declined, and he had a kidney transplant from a living, unrelated donor at 6.5 years of age, which was 3 years after his initial presentation. Ethnicity of the patient is not relevant to the study and is not reported to protect his anonymity.
Patient Genome Sequencing and Analysis
This research was conducted with approval from the human research ethics committees of the Royal Children’s Hospital Melbourne (HREC/15/QRCH/126) including research governance approval (SSA/15/RCHM/90). Written informed consent was obtained from the participant’s parents. Massively parallel sequencing was performed using the TruSight One panel on an Illumina HiSeq2500 at The Children’s Hospital at Westmead. The following genes were analyzed: NPHS1, NPHS2, WT1, COL4A3, COL4A4, COL4A5, ACNT4, ALMS1, APOL1, ARHGAP24, CD2AP, COQ2, COQ6, INF2, ITGA3, ITGB4, LAMB2, LMNA, LMX1B, MYH9, MYO1E, PAX2, PDSS2, PLCE1, PTPRO, SCARB2, SMARCAL1, TRPC6, and TTC21B. Analysis of the NHPS2 gene identified a homozygous known pathogenic variant, c.503G>A (p.Arg168His), in exon 4. Both parents were confirmed to be heterozygous for this variant.
Flow Cytometry
To validate iPSC clone pluripotency, cells were harvested with TrypLE Select (Gibco;12563–029) and stained for surface markers (Table 3) as per the manufacturer’s instructions in PBS + FBS 2%. Cells were then fixed with the Foxp3 fixation/permeabilization buffer (Thermo Fisher Scientific; 00–5523–00) and stained for the intracellular marker (Table 3), following the manufacturer’s instructions. Unstained control and stained samples were analyzed by flow cytometry on the LSR II flow cytometer (BD Biosciences, Franklin Lakes, NJ).
Kidney Organoid Differentiation
iPSC-directed differentiation into kidney organoids was performed, following our previously described protocol.22,23,27 Briefly, cells were cultured as a monolayer for 5 days in the presence of 7 μM CHIR99021 (TOCRIS Bioscience, Minneapolis, MN; S442350) and 2 days with 200 ng/ml FGF9 (R&D Systems, Minneapolis, MN; 273-F9-025) to induce metanephric mesenchyme differentiation. On day 7 (D7), cells were harvested, resuspended into a 200,000 cells/μl cell paste, and loaded into a 100-μl Gastight syringe (Hamilton, Ontario, Canada; 7656–05), fitted with a 25-gauge removable needle (Hamilton; 7804–12). Cells were bioprinted into 3D aggregates at a ratio of 1 mm cell paste extrusion per 30-mm movement (ratio 3028) over a 9-mm line equivalent to 100,000 cells per organoid. Kidney organoids were then further cultured for up to 18 days (D7 + 18) before fixation27 or organoid glomeruli isolation.22
Organoid Glomeruli Isolation
Organoid glomeruli were isolated from kidney organoids 14, 17, and 18 days after bioprinting via enzymatic and mechanical dissociation and sieving as previously described.22 Briefly, organoids were digested in TrypLE (Gibco; 12563–029) with gentle pipetting to promote dissociation of glomeruli. The resulting cell suspension was then passed through a series of strainers of various sizes to isolate glomeruli with a diameter of ≥30 μm. Isolated glomeruli were pelleted by centrifugation (5 minutes, 2000× g) for RNA or protein extraction.
Whole-Mount Immunostaining and Imaging
Fixed kidney organoids were immunostained as previously described,27 with antibodies listed in Table 3 and DAPI (1:1000, Molecular Probes, Waltham, MA; D1306) increasing incubation times to up to 96 hours to ensure antibody penetration in subcellular structures. For labeling of primaries raised in the same species, a four-step immunofluorescence protocol was used following the manufacturer’s instructions (www.jacksonimmuno.com). Briefly, incubation with first primary antibody was followed by incubation with a specific Alexa Fluor 647–conjugated monovalent Fab fragment (Table 3) in excess, thus effectively blocking the first primary antibody. The second primary was then incubated followed by an appropriate secondary antibody. Nonspecific overlapping detection of antigens was controlled for all experiments before inclusion in final analysis.
Samples were imaged in 50:50 glycerol:PBS 1× using a Dragonfly Spinning Disc confocal microscope (Andor Technology, Belfast, UK) fitted with an Andor Zyla camera using 20× (CFI Plan Apochromat Lambda 20×, N.A. 0.75; MRD70200) or 100× (CFI Plan Apochromat Lambda 100×, N.A. 1.45; MRD01905) objectives.
Image Analysis and Quantification
For image analysis, a single representative confocal slice capturing glomeruli was analyzed per field.
Protein Expression in Glomeruli
Images were segmented on the basis of NEPHRIN staining to identify the position of glomeruli, and the mean intensity per segmented region of CLAUDIN-1 and cleaved CASPASE-3 within glomeruli was then assessed across all conditions using a Fiji29 macro to allow automated and comparable batch processing of all images. For each condition, a minimum of five field of views per organoid were processed from one to two staining and differentiation experiments. Data were graphed and analyzed in GraphPad Prism v8.2.1.
Subcellular Localization of PODOCIN
As each image contained podocytes and surrounding tissue, localization analysis was restricted to the podocytes by defining a region of interest (ROI) in each field. Initially, gaussian smoothing (Sigma 70), followed by Otsu’s thresholding on the NEPHRIN or SYNAPTOPODIN channels, was used to segment a region that defined the ROI. Each ROI was visually inspected and manually edited for accuracy.
A segmentation mask on the basis of this ROI was then applied to the image data representing each of the subcellular compartment stainings. The methods used are given in Table 4. Two stages of processing were applied per image: a noise removal method (“rollingball” or “gauss”), followed by a thresholding method (“otsu” and “triangle”) and an optional size filter. The combination of methods was selected on the basis of what produced the most accurate segmentation per subcellular marker, as assessed visually.
“Rollingball” refers to the Fiji29 implementation of the rolling ball background subtraction with radius of 50.
“Gauss” refers to the scikit-image30 implementation of Gaussian smoothing the image with σ = 2.
“Otsu” refers to the scikit-image30 implementation of Otsu’s thresholding being subsequently applied to the image.
“Triangle” refers to the scikit-image30 implementation of Triangle thresholding method being subsequently applied to the image.
“Size” refers to the scikit-image30 “remove_small_objects” function being used to remove objects that are <50 pixels.
Table 4.
Summary of thresholding methods used for segmentation of subcellular compartments for quantification of Podocin localization
| Subcellular Compartment | Protein Marker | Segmentation Method |
|---|---|---|
| Early endosomes | EEA1 | Rollingball-tri |
| ER | KDEL | Rollingball-tri |
| Golgi | GM130 | Gauss-tri |
| LE | RAB7 | Rollingball-tri |
| Lysosomes | LAMP1 | Rollingball-tr-size |
| Plasma membrane/slit diaphragm | SYNAPTOPODIN | Rollingball-otsu |
For the target channel (PODOCIN), rollingball background subtraction with a radius of 50 was performed and then any pixels with value below triangle threshold were assigned a value of zero. A modified Manders’ colocalization coefficient was used to assess the localization of PODOCIN to each subcellular compartment for each image. The following equation was applied:
where Pi refers to the value of the ith pixel of the image’s processed target channel (PODOCIN), and Pi,coloc = Pi if the pixel Pi is within the subcellular channel mask.
A minimum of ten field of views per organoid were processed from one to three staining and differentiation experiments, with the number of images used given in Table 5. Graphs were generated using seaborn.31
Table 5.
Number of images quantified for each line and subcellular marker
| Cell Line | SYNPO | KDEL | GM130 | EEA1 | RAB7 | LAMP1 |
|---|---|---|---|---|---|---|
| GE_Control | 20 | 34 | 41 | 41 | 45 | 14 |
| GE_G92C | 10 | 41 | 20 | 31 | 36 | 11 |
| GE_P118L | 10 | 23 | 28 | 13 | 22 | 10 |
| GE_R138Q | 10 | 49 | 17 | 10 | 38 | 11 |
| GE_R168H | 10 | 22 | 26 | 12 | 20 | 10 |
| GE_R291W | 10 | 21 | 26 | 11 | 24 | 10 |
| PD_Control | 11 | 28 | 19 | 12 | 14 | 10 |
| PD_R168H | 10 | 28 | 20 | 11 | 24 | 10 |
GE, gene-edited lines; PD, patient-derived lines.
NEPHRIN and PODOCIN Colocalization
All images where PODOCIN and NEPHRIN channels were both available were used. This amounted to 893 images (all subcellular markers except SYNAPTOPODIN, Table 5). Both channels underwent rollingball background subtraction, followed by triangle thresholding. The segmentation mask for PODOCIN was generated by thresholding all values of the processed PODOCIN image above zero. Manders’ colocalization coefficient was calculated with the processed NEPHRIN channel as the target channel (Image P). Graphs were generated using seaborn.31
Average NEPHRIN and PODOCIN Pixel Intensity
The average pixel intensity for all 893 images of the NEPHRIN and 984 images of PODOCIN channels (as processed above) were plotted using seaborn.31
Protein Extraction and Western Blotting
Pelleted glomeruli isolated at D7 + 18 from three separate replicates (12 organoids per replicate) from two to three independent differentiation experiments were processed for each cell line. Glomeruli pellets were washed three times in 1 ml 1× PBS(centrifugation 5 minutes, 2000 g between washes) to remove FBS traces from the isolation buffer, and stored as a dry pellet at −80°C for downstream batch processing. Protein extraction was carried out using 15 μl RIPA lysis and extraction buffer (Thermo Fisher Scientific; 89900) supplemented with Halt Protease and Phosphatase Inhibitor Cocktail 100× (Thermo Fisher Scientific; 78440). Samples were thoroughly vortexed for 45 seconds, incubated on ice for 15 minutes, and centrifuged for 10 minutes at 14,000 × g at 4°C. Supernatants were then transferred into new Eppendorf tubes and stored at −80°C. Protein stock concentrations were measured using the Pierce BCA Protein Assay Kit (Thermo Fisher Scientific; 23227), and results were read with an Infinite M200 Pro (Tecan, Mannedorf, Switzerland). Western blot was performed using 5 μg of protein per sample, diluted in sample Buffer Laemmli 2× (Sigma Aldrich, Burlington, MA; S3401–10VL) and denatured at 95°C for 5 minutes. Samples were loaded into three 4%–15% Mini-PROTEAN TGX Stain-Free Protein Gels (Bio-Rad Laboratories, Gladesville, New South Wales, Australia; 4568084), and the electrophoresis was run at 100 V for 70 minutes. Then, proteins were transferred onto Trans-Blot Turbo Mini 0.2-μm Nitrocellulose Transfer membranes (Bio-Rad Laboratories; 1704158) in a Trans-Blot Turbo system (Bio-Rad Laboratories) following the manufacturers’ instructions. Membranes were stained with Ponceau S stain (Sigma Aldrich; P7170) for quality control and blocked in TBS-Tween 0.1% with 5% skim milk (TBS-T milk 5%) at room temperature for 90 minutes on a rocker. Podocin primary antibody was diluted in TBS-T BSA 5% and incubated at 4°C overnight, followed by TBS-T washes and secondary antibody diluted in TBS-T milk 5% at room temperature for 90 minutes on a rocker (Table 3). Membranes were then washed in TBS-T, developed with Clarity Western ECL Substrate (Bio-Rad Laboratories; 1705060), and imaged using a ChemiDoc Imaging System (Bio-Rad Laboratories). GAPDH primary antibody (Table 3) was subsequently incubated and imaged on the same membranes following the above-mentioned protocol. Images were quantified using FIJI and graphed and analyzed in GraphPad Prism v8.2.1.
RNA Extraction, Bulk RNA Sequencing, and Data Analysis
Pelleted glomeruli isolated at D7 + 14 from three separate replicates (four organoids per replicate) from two to three independent differentiation experiments were processed for each cell line and stored after lysis at −80°C for downstream batch processing. RNA extraction was performed using the PureLink RNA Mini Kit (Thermo Fisher Scientific; 12183018A), following the manufacturer’s instructions. Libraries were prepared using the Illumina TruSeq Stranded mRNA kit and sequenced on NovaSeq 6000 using 2 × 150-bp reads at approximately 30 M reads per sample. Bulk RNA sequencing data were processed using the RNAsik pipeline,32 which aligned reads to Ensembl GRCh3833 using the STAR aligner,34 marked duplicates using Picard (https://broadinstitute.github.io/picard/) and quantified gene level counts using featureCounts.35 One P118L sample clustered away from all other samples on principal component analysis creating a bias. We attributed this difference to the significantly lower library size, which affected the dispersion calculation. This sample was excluded from the analysis as an outlier but has been submitted to GEO (GSE205647). The differential gene expression analysis was performed in Degust36 using the Voom Sample Weight method37 to find differentially expressed genes using an FDR cutoff ≤0.05. Gene set enrichment analysis was then carried out using the ToppFun browser (www.toppgene.cchmc.org).38 Figures were generated using R (version 4.1), ggplot2, and ComplexHeatmap.39
To assess the transcription frequency of each NPHS2 allele in G92C bulk RNA sequencing samples, the indel sequence detected by Sanger sequencing in G92C cells (Supplemental Figure 1F) was inserted into the reference genomic sequence using GATK’s FastaAlternateReferenceMaker.40 Next, fastq files were aligned against the new reference using STAR bam files, then marked duplicates with PICARD. Finally, bam files were analyzed and a figure was generated using the R package CrispRVariants.41
RNA Extraction, cDNA Synthesis, and Quantitative RT-PCR
Pelleted glomeruli isolated at D7 + 17 from three separate replicates (four organoids per replicate) from two to three independent differentiation experiments were processed for each cell line and stored after lysis at −80°C for downstream batch processing. RNA extraction was performed as above. RNA concentrations and quality were measured using a NanoDrop 2000 spectrophotometer (Thermo Fisher Scientific), and 50 ng of RNA was used for cDNA synthesis with the SensiFAST cDNA Synthesis Kit (Bioline, Toronto, Canada; BIO-65053) following a genomic DNA degradation step with the RQ1 RNase-Free DNase kit (Promega, Madison, WI; M6101). Quantitative RT-PCR was carried out on 2 ng of cDNA per reaction with the GoTaq qPCR Master Mix (Promega; A6001) in triplicate following the manufacturer’s instructions, using the primer pairs provided in Table 6, and ran on the LightCycler 480 II (Roche). Data were graphed and analyzed in GraphPad Prism v8.2.1.
Table 6.
Primer pairs used for quantitative RT-PCR and PCR experiments
| Target Gene | Forward Primers | Reverse Primers |
|---|---|---|
| DDIT3 | GAGGAAGACCAAGGGAGAACC | GATTTCCTGTTGAGCCGTTC |
| GAPDH | AGCCACATCGCTCAGACAC | GCCCAATACGACCAAATCC |
| NPHS2 | CTGTGAGTGGCTTCTTGTCCTC | CCTTTGGCTCTTCCAGGAAGCA |
| XBP1 | TTACGAGAGAAAACTCATGGCCT | TGGGGAGATGTTCTGGAGGG |
XBP1 PCR and Electrophoresis
PCR was carried out on 6 ng of cDNA per reaction with the GoTaq G2 Green Master mix (Promega; M7823) following the manufacturer’s instructions using the XBP1 primer pairs provided in Table 6 and the following PCR program: (95°C for 3 minutes) × 1 cycle; (95°C for 30 seconds; 63°C for 30 seconds; 72°C for 60 seconds) × 14 cycles; (95°C for 30 seconds; 56°C for 30 seconds; 72°C for 60 seconds) × 21 cycles; and (72°C for 7 minutes) × 1 cycle. PCR products were then run on a 2.5% agarose gel at 130 V for 1.5 hours and imaged on a G:BOX Imager (Syngene, Cambridge, UK). Images were quantified using FIJI and graphed and analyzed in GraphPad Prism v8.2.1.
Statistics
Data were tested for normality using a Shapiro–Wilk test to define the use of a parametric or nonparametric test. Pairwise analyses were performed with an unpaired t test, whereas a one-way ANOVA followed by a Tukey’s multiple comparison test was used for group analyses. For image quantifications, P values were calculated using Welch’s t test compared with control. Differences were considered statistically significant for P<0.05. P values are represented as follows: *P<0.05, **P<0.01, ***P<0.001, and ****P<0.0001. All error bars are presented as SEM.
Results
Generation of an iPSC NPHS2 Allelic Series to Model SRNS
NPHS2 missense variants c.274G>T, c.353C>T, c.413G>A, c.503G>A, and c.871C>T leading to the protein changes p.G92C, p.P118L, p.R138Q, p.R168H, and p.R291W, respectively, were selected for analysis on the basis of their frequency, severity,1 and previously published PODOCIN variant phenotypes12–16 (Table 1, Figure 1A). In brief, the focus was on modeling missense variants, resulting in amino acid changes across the protein. Variants will be described on the basis of the resulting amino acid change (i.e., c.274G>T; G92C).
Figure 1.

Genetically engineered NPHS2 allelic series differentiated into kidney organoids. (A) Schematic of the PODOCIN protein showing the five missense variants characterized in this study, G92C, P118L, R138Q, R168H, and R291W. (B) Brightfield representative examples of kidney organoids differentiated from control and gene-edited cell lines at D7 + 17 (scale bar, 1000 μm). (C) Kidney organoids immunostained for glomeruli (NEPHRIN), proximal (Lotus tetragonolobus lectin, LTL), distal (E-CADHERIN), and connecting tubules (GATA-3) markers to show organoid patterning at D7 + 17 (scale bar, 200 μm). (D) and (E) Kidney organoids immunostained for podocyte (NEPHRIN) and parietal epithelial cell (CLAUDIN-1) markers showing similar podocyte maturity across cell lines and quantification at D7 + 17 (scale bar, 50 μm). Every dot represents a field of view.
A control human fibroblast cell line was subjected to simultaneous reprogramming and gene editing as previously described,25 thereby generating an allelic series of NPHS2 variant iPSC on an identical genetic background. Each iPSC line was sequenced to confirm genotype and homozygosity (Supplemental Figure 1, A–E). Sanger sequencing revealed the presence of an indel on one allele upstream of the G92C missense variant, which introduced a frame-shift predicting premature termination of the resulting PODOCIN variant protein (Supplemental Figure 1, F and G). All other lines in this allelic series carry homozygous NPHS2 variants with no other genomic changes detected.
Kidney Organoid Differentiation of the NPHS2 Allelic Series
Kidney organoids were successfully generated from control and variant cell lines (Figure 1B), with all organoids containing interconnected and appropriately patterned nephrons, including NEPHRIN+ glomeruli, LTL+ proximal tubules, and E-CADHERIN+, and E- CADHERIN+GATA3+ distal and connecting tubules (Figure 1C). CLAUDIN-1 (parietal epithelial cells) and NEPHRIN (podocytes) immunostaining showed the presence of a Bowman’s capsule of parietal epithelial cells surrounding podocytes in all kidney organoids (Figure 1, D and E).
Successful and uniform glomerular patterning in all variant lines supported the use of this approach to investigate variant-specific phenotypes.
PODOCIN Expression Decreases in NPHS2 Variant Lines
Immunostaining for PODOCIN (polyclonal antibody) revealed a quantifiable reduction of PODOCIN variants across all genotypes compared with control (Figure 2A top panel, Supplemental Figure 3A). Western blotting of proteins extracted from isolated OrgGloms using a different polyclonal antibody confirmed this observation, revealing a two-fold decrease of PODOCIN protein expression in all variants compared with control (Figure 2B, Supplemental Figure 3B). NPHS2 mRNA levels in isolated early (D7 + 14) OrgGloms were unchanged in all variants except G92C (Figure 2C), but was decreased in P118L, R138Q, and G92C at the later timepoint (D7 + 17; Supplemental Figure 3C). Stable NPHS2 mRNA, but reduced protein in R168H and R291W variants, suggests PODOCIN-specific decreased translation, or increased protein degradation. Decreased NPHS2 expression in G92C may be influenced by the indel detected on allele 2. Analysis of bulk RNA sequencing reads revealed that 84% of NPHS2 reads from these organoids contained the indel sequence, suggesting the observed decrease in NPHS2 mRNA is due to a depletion of the nonindel allele 1. A truncated protein was not evident on Western blotting because the antibody used would not detect it. The presence of PODOCIN of an appropriate length does suggest translation from the nonindel allele, which contains G92C mutation. In summary, our data show a significant decrease of PODOCIN protein expression in all variant lines, suggesting either reduced translation and/or increased protein degradation.
Figure 2.

Podocin expression levels and patterns were altered in gene-edited variants. (A) Kidney organoids immunostained for PODOCIN. Top panel illustrates decreased PODOCIN intensity in all gene-edited cell lines compared with control (scale bar, 50 μm; images are scaled at the same range). Middle and bottom panels illustrate the altered PODOCIN localization for most variants in D7 + 17 organoids (scale bar, 5 μm). Middle and lower panel images were adjusted to maximum value to illustrate location and not relative protein levels. DAPI stains nuclei and arrowheads indicate punctate Golgi-like pattern. (B) Western blot quantification showing PODOCIN protein expression levels at D7 + 18 in isolated OrgGloms. (C) NPHS2 mRNA expression levels at D7 + 14 measured by bulk RNA sequencing in isolated OrgGloms. (D) and (E) PODOCIN and SYNAPTOPODIN (slit diaphragm marker) immunostainings displaying an absence of colocalization in all variants but G92C and corresponding quantification at D7 + 17 (scale bar, 5 μm; images are adjusted to maximum value). Every dot represents a field of view and the black diamond represents the mean. Arrowheads indicate examples of colocalization. *P≤0.05; **P≤0.01; ***P≤0.001; ****P≤0.0001 versus control.
Distinct NPHS2 Variants Result in Differential Trafficking Abnormalities
High-magnification imaging of PODOCIN immunostaining in control kidney organoids showed an appropriately polarized expression pattern in organoid glomeruli. In contrast, the variants P118L, R138Q, R168H, and R291W, but not G92C, revealed reduced membrane staining compared with control, with R168H and R291W displaying a punctate perinuclear pattern suggestive of a novel Golgi apparatus localization (Figure 2A, middle and bottom panels).12,13 Coimmunostaining of PODOCIN and SYNAPTOPODIN, a slit diaphragm marker detected at the podocyte membrane, was quantified using the automated segmentation of each channel and is presented as modified Mander’s colocalization coefficient, where one shows a perfect colocalization and zero shows the absence of any colocalization.42 Whereas PODOCIN and SYNAPTOPODIN overlapped in both control and G92C glomeruli, their colocalization was significantly decreased in all other variant glomeruli, indicating PODOCIN mistrafficking, as previously reported (Figure 2, D and E, Table 1).12–16
To investigate the subcellular localization of PODOCIN variants, immunostaining for PODOCIN was performed along with markers of the ER (KDEL), the Golgi apparatus (GM130), early endosomes (EE) (EEA1), and LE (RAB7). Although PODOCIN could also be detected within the trafficking machinery of control organoids, quantified analysis of all variant lines indicated a differential accumulation of PODOCIN variants into specific organelles depending on the variant present (Figure 3, Supplemental Figure 4). Consistent with previous literature,12–14,16 P118L and R138Q variant proteins showed preferential localization in the ER compared with control and other variants (Figure 3, A and D, Supplemental Figure 4B). Although R168H and R291W variants have previously been described as also presenting with an ER mislocalization, a preferential sequestration of these variants in the Golgi was observed (Figure 3, B and D, Supplemental Figure 4C). Most PODOCIN proteins showed little colocalization with the LE marker RAB7, but colocalization of RAB7 with R291W PODOCIN was evident in Golgi-like punctate perinuclear structures (Figure 3, C and D, Supplemental Figure 4D). All PODOCIN proteins were detected in EE, although P118L and R138Q showed less colocalization with EEA1, potentially due to sequestration in the ER (Figure 3D, Supplemental Figure 4, A and E). Colocalization with LAMP1, a marker of lysosomes, was also performed to investigate this as a potential mechanism for increased protein degradation. No statistical increase in targeting to the lysosome was evident for any PODOCIN variant (Supplemental Figure 5). Indeed, some showed decreased lysosomal targeting.
Figure 3.
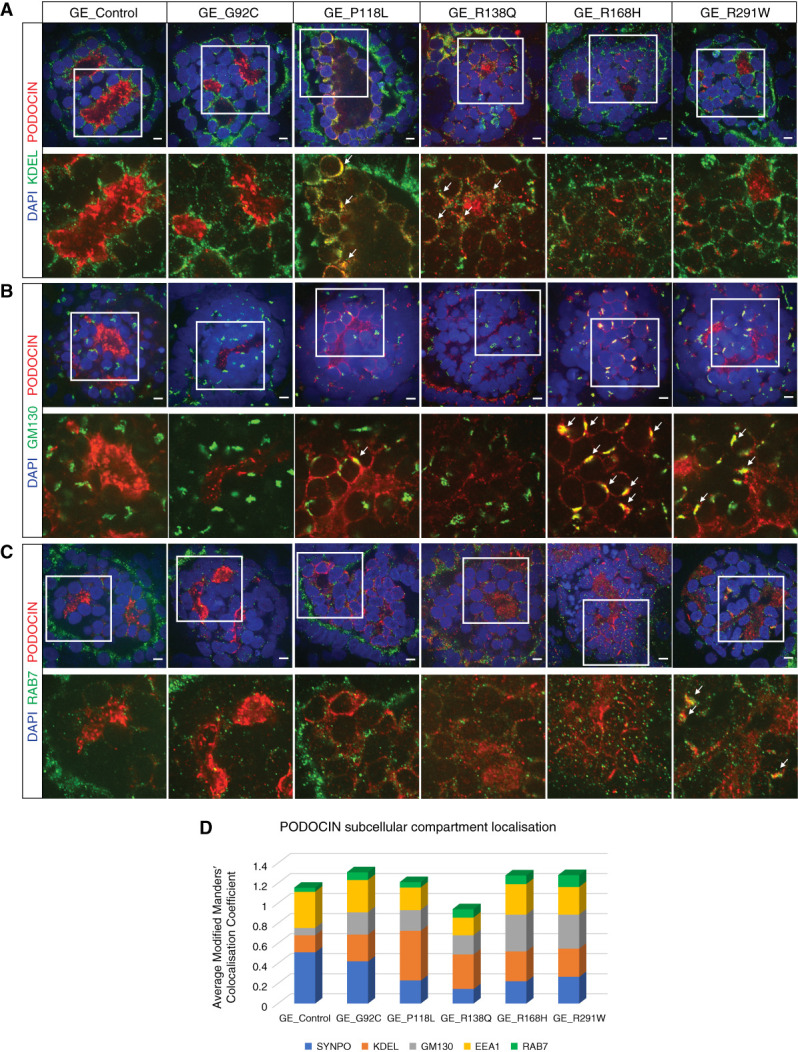
Distinct NPHS2 variants resulted in differential trafficking abnormalities. (A)–(C) Kidney organoids immunostained for PODOCIN and endoplasmic reticulum (A, KDEL), Golgi (B, GM130), or late endosome (C, RAB7) markers showing partial colocalization in various subcellular structures for all variant cell lines at D7 + 17 (scale bar, 5 μm). DAPI stains nuclei. Images are adjusted to maximum value. (D) Relative quantification of PODOCIN subcellular compartment localization in control and variant glomeruli presented as the average modified Manders’ colocalization coefficient across different subcellular markers investigated per line. Values of the same subcellular marker should be compared across lines and not different subcellular markers within the same line.
R168H Homozygous Patient-Derived Kidney Organoids Recapitulate the Phenotype of Their Gene-Edited Counterparts
To validate our findings on R168H PODOCIN Golgi mislocalization, iPSC lines generated from a patient homozygous for this variant (patient derived; PD_R168H), together with an unaffected heterozygous parent (PD_Control), were used to generate kidney organoids (Figure 4, A–D). As for GE_R168H organoids, PODOCIN protein expression was significantly decreased in PD_R168H compared with PD_Control (Figure 4E, left panel, Supplemental Figure 3, A and B, Figure 4F), whereas NPHS2 mRNA expression was unchanged (Figure 4G, Supplemental Figure 3C). PD_R168H podocytes again showed PODOCIN staining in distinct perinuclear puncta, whereas the PD_Control showed the expected polarized expression profile of PODOCIN at the slit diaphragm (Figure 4E, middle and right panels). Colocalization experiments indicated a significant reduction of PODOCIN membrane localization in PD_R168H but not in PD_Control, as shown by costaining with SYNAPTOPODIN (Figure 5A, Supplemental Figure 6B). A strong Golgi accumulation of PODOCIN was evident in PD_R168H but not in PD_Control, although ER sequestration of the variant was also present (Figure 5, B and C, Supplemental Figure 6, C and D). PODOCIN in EE and LE was similar in both PD_R168H and PD_Control podocytes (Figure 5D, Supplemental Figure 6A, E, and F). Again, there was no evidence for increased lysosomal trafficking (Supplemental Figure 5). These data confirm the findings made in engineered cell lines (Figure 5E).
Figure 4.
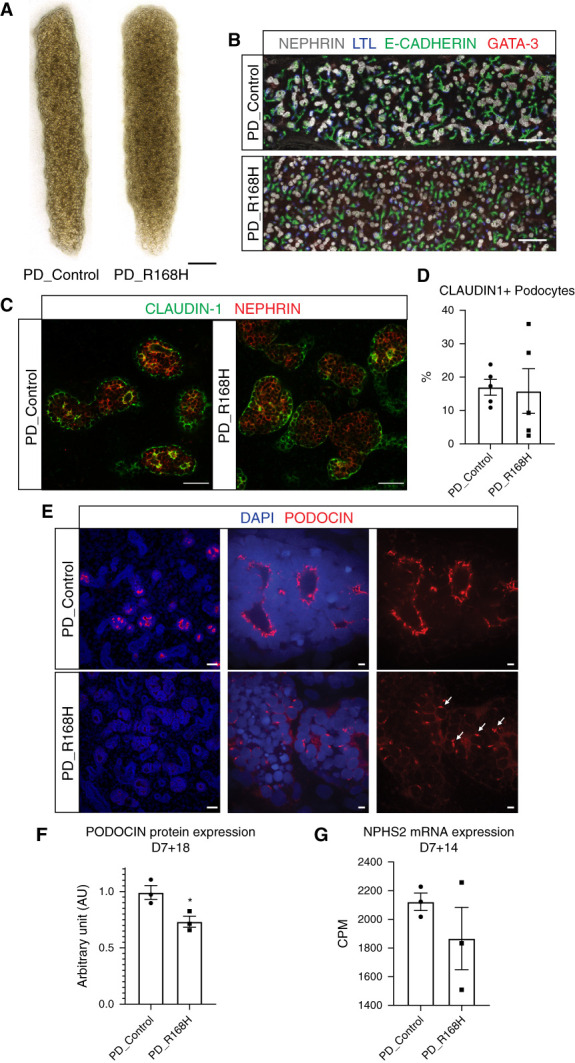
R168H patient-derived kidney organoids differentiated into kidney organoids. (A) Brightfield representative examples of kidney organoids differentiated from proband (PD_R168H) and unaffected relative (PD_Control) derived cell lines at D7 + 17 (scale bar, 1000 μm). (B) Kidney organoids immunostained for glomeruli (NEPHRIN), proximal (lotus tetragonolobus lectin, LTL), distal (E-CADHERIN), and connecting tubule (GATA-3) markers to show organoid patterning at D7 + 17 (scale bar, 200 μm). (C) and (D) Kidney organoids immunostained for podocyte (NEPHRIN) and parietal epithelial cell (CLAUDIN-1) markers showing similar podocyte maturity across cell lines and quantification at D7 + 17 (scale bar, 50 μm). Every dot represents a field of view. (E) Kidney organoids immunostained for PODOCIN showing different expression level and pattern in patient-derived variant organoids. Left panel illustrates decreased PODOCIN intensity in patient-derived variant cell line compared with control (scale bar, 50 μm; images are scaled at the same range). Middle and right panels illustrate the altered PODOCIN localization for variant organoids at D7 + 17 (scale bar, 5 μm). Middle and right panel images were adjusted to maximum value to illustrate location and not relative protein levels. DAPI stains nuclei and arrowheads indicate punctate Golgi-like pattern. (F) Western blot quantification showing PODOCIN protein expression levels at D7 + 18 in isolated OrgGloms. (G) NPHS2 mRNA expression levels at D7 + 14 measured by bulk RNA sequencing in isolated OrgGloms. *P≤0.05 versus PD_Control.
Figure 5.

R168H patient-derived kidney organoids recapitulated the phenotype of their gene-edited counterpart. (A)–(D) Kidney organoids immunotained for PODOCIN and slit-diaphragm (SYNAPTOPODIN, A), endoplasmic reticulum (KDEL, B), Golgi (GM130, C), or late endosome (RAB7, D) markers showing preferential variant localization in the Golgi apparatus at D7 + 17 (scale bar, 5 μm). DAPI stains nuclei. Images are adjusted to maximum value. (E) Relative quantification of PODOCIN subcellular compartment localization in gene-edited (GE) and patient-derived (PD) control and R168H variant glomeruli presented as the average modified Manders’ colocalization coefficient across different subcellular markers investigated per line, demonstrating a similar PODOCIN distribution in both R168H variant glomeruli. Values of the same subcellular marker should be compared across lines and not different subcellular markers within the same line.
Podocyte Transcriptional Profiling Does Not Show Disease-Associated Anomalies
Transcription profiling was used to further investigate the effect of PODOCIN protein mislocalization on podocyte biology. OrgGloms were isolated from D7 + 14 organoids to investigate underlying mechanism of action and not final pathology. The presence of reduced variant PODOCIN protein levels and subcellular localization was present in D7 + 14 organoids (Supplemental Figure 7). Isolated D7 + 14 OrgGloms for each genotype, including GE and PD lines, were transcriptionally profiled, with podocyte enrichment confirmed by enhanced podocyte-specific gene expression (Supplemental Figure 8A). Principal component analysis showed clustering of replicates for all lines; however, although a clear segregation of PD_Control versus PD_R168H was observed (distinct genotypes), all GE lines, including the GE_Control (isogenic allelic series), clustered together, suggesting limited disease-associated changes (Figure 6A). Differential gene expression analysis between variants and controls did not reveal marked differences, with only two genes differentially expressed, TRIM61 and SDR42E1 (Figure 6B), whereas specific comparison of GE_Control and GE_Variants yielded only two additional genes, FAM218A and PCDHA6 (Supplemental Figure 8B). In addition, assessment of podocyte-specific gene expression did not show significant variation across genotypes, with the exception of a decrease in NPHS2 expression in the GE_G92C samples (Figure 6C, Figure 2C, Supplemental Figure 3C). Pairwise comparison of each variant with their respective control indicated a possible effect of several NPHS2 variants on cell adhesion; however, this was not evident for GE_G92C, GE_R291W, and PD_R168H (Supplemental Figure 8, C–G). Finally, we compared the differentially expressed genes in both GE and PD pairwise analyses for the R168H variants. In total, 17 genes were significantly modulated in both pairs, but only eight observed the same trend in both GE and PD pairs (Figure 6, D and E). When submitted to gene set enrichment analysis, those eight genes did not yield a specific gene ontology signature. The limited disease-associated transcriptional changes observed in variants compared with control suggest that the effect of PODOCIN mistrafficking on podocytes biology is likely to be post-transcriptional and/or post-translational.
Figure 6.

OrgGloms transcriptional profiling did not show marked disease associated anomalies. (A) Transcriptional profiling of OrgGloms isolated at D7 + 14 and processed by bulk RNA sequencing displayed as PCA plot illustrating an absence of disease-associated clustering. (B) Heatmap of differentially expressed genes in all variant glomeruli compared with all controls. (C) Heatmap of podocyte gene expression showing an absence of variation between variant and controls. (D) and (E) Pairwise comparison of R168H variants versus controls in both gene-edited (GE) and patient-derived (PD) pairs resulting in a small number of overlapping genes. DR, downregulated; UR, upregulated.
PODOCIN Variants Mistrafficking Induce ER Stress-Independent Podocyte Apoptosis
A previous report suggested increased apoptosis in cultured podocytes transfected with R168H variant.43 We have previously reported podocyte-specific apoptosis in a kidney organoid model of SRNS carrying homozygous variants in NOS1AP.44 In this study, all variants presented increased podocyte-specific cleaved caspase-3 apoptosis at D7 + 18 compared with their respective controls (Figure 7, A–C). Because misfolded protein accumulation in ER can activate the unfolded protein response, sometimes leading to apoptosis, we measured the expression of two known readouts of ER stress; XBP1 splicing and DDIT3 expression, the latter encoding the protein CHOP.45 These two genes were not detected by bulk RNA sequencing in isolated OrgGloms at D7 + 14, but low expression levels were found by PCR at D7 + 17. However, XBP1 splicing was not induced by NPHS2 variants and DDIT3 expression was not significantly increased indicating an absence of ER stress in podocytes of variant kidney organoids (Figure 7, D and E, Supplemental Figure 9). Hence, apoptosis in NPHS2 variants was not driven by ER stress.
Figure 7.

PODOCIN variants mistrafficking induced ER-stress–independent podocyte apoptosis. (A) Kidney organoids immunostained for podocytes (NEPHRIN), proximal tubules (HNF4A), and apoptosis (CAPSPASE-3) showing increased and podocyte-specific cell death in all variants compared with controls at D7 + 18 (scale bar, 50 μm). Images are scaled at the same range. (B) and (C) Staining quantification at D7 + 18 for (B) gene-edited lines and (C) over time for patient-derived lines. (B) Every dot represents a field of view. (D) and (E) Absence of ER stress in variants compared with controls shown at D7 + 17 with (D) XBP1 splicing and (E) DDIT3 mRNA expression. *P≤0.05; **P≤0.01; ****P≤0.0001 versus control.
PODOCIN Variant Mislocalization Affects NEPHRIN Trafficking
NEPHRIN and PODOCIN proteins are known to interact via a binding domain within the C terminal end of the PODOCIN protein.8 Previous reports have suggested that appropriate NEPHRIN targeting to lipid raft microdomains at the membrane is dependent on its cytosolic interaction with PODOCIN.2,13 Our data did not indicate a marked effect of NPHS2 variants on NPHS1 mRNA expression (Figure 6C); however, there was a detectable reduction in absolute NEPHRIN protein levels in the presence of all PODOCIN variants other than P118L (Figure 8A, Supplemental Figure 10). To investigate whether the mislocalization of individual variants affected NEPHRIN trafficking to the membrane, we quantified the relative colocalization of NEPHRIN with PODOCIN versus colocalization of PODOCIN with NEPHRIN. A discordance between these two parameters might suggest that NEPHRIN does not bind a given variant, whereas tight association, even if in an inappropriate location, suggests an association between the two proteins that may be preventing NEPHRIN from reaching the lipid raft microdomains at the plasma membrane. Although PODOCIN showed high colocalization with NEPHRIN in all variants except R138Q (Figure 8B), NEPHRIN colocalization with PODOCIN was decreased to varying extents for all variants (Figure 8C). This analysis suggests variable effects on NEPHRIN localization and concordance with PODOCIN localization, summarized in Figure 8D. Of note, G92C and R138Q were the variants with the lowest concordance of PODOCIN:NEPHRIN colocalization. Although colocalization does not prove direct protein-protein interactions, this would suggest that NEPHRIN can reach the plasma membrane without direct interaction with PODOCIN.
Figure 8.

PODOCIN variant mislocalization affected NEPHRIN trafficking. (A)–(C) Kidney organoids immunostained for PODOCIN and NEPRHIN showing colocalization in most lines at D7 + 17 (scale bar, 5 μm). Representative images for (A) GE and PD kidney organoids (B) corresponding quantifications of PODOCIN colocalization to NEPHRIN, and (C) NEPHRIN colocalization to PODOCIN. Arrowheads indicate examples of colocalization. Images are adjusted to maximum value. The black diamond represents the mean. (D) Summary diagram illustrating the relative concordance of NEPHRIN (black dot) and PODOCIN (gray dot) localization. A high concordance between the values of PODOCIN colocalization with NEPHRIN versus NEPHRIN colocalization with PODOCIN indicates that NEPHRIN is located in the same compartments as PODOCIN (P118L, R168H, R291W). A low concordance suggests a separation of location between these two proteins, suggesting a loss of protein-protein binding (R138Q, G92C). *P≤0.05; **P≤0.01; ****P≤0.0001 versus respective controls.
Discussion
In this study, a series of endogenous missense NPHS2 alleles were modeled using human kidney organoids. This revealed decreased PODOCIN protein expression, novel variant-specific PODOCIN mislocalization, and ER-independent podocyte-specific apoptosis. Different PODOCIN variants showed distinct subcellular mistrafficking and differential effects on NEPHRIN localization. As the endogenous NPHS2 alleles were mutated, rather than the variant being overexpressed, this represents a more valid model of NPHS2 variant-specific pathophysiological mechanisms.
PODOCIN should be detected at the plasma membrane of the podocyte foot processes near the glomerular basement membrane in a healthy podocyte. Previous reports have shown a retention of PODOCIN variants along the protein trafficking pathway.12–16 In this study, P118L and R138Q were mainly sequestered in the ER, whereas R168H and R291W showed a novel sequestration within the Golgi complex. Previous work had shown the presence of G92C at the membrane,12,13 as we also report here. The selective loss of mRNA containing this G92C variant allele implies an instability of this mRNA. P118L was previously described to localize partially at the membrane with a nonconventional membrane topology due to altered protein N-glycosylation15; however, a conflicting report suggests it does not reach the membrane.12 Our analysis identifies increased ER and minimal membrane localization, in line with previous data showing marked ER retention.12,15 One of the most studied PODOCIN variants, due to its high frequency in patients, is R138Q.12–14,16,17 Our data are consistent with previously published reports suggesting a predominant accumulation of this variant in the ER. The most striking finding of this study was the marked accumulation of PODOCIN R168H and R291W in the Golgi. Colocalization with GM130, a cis-Golgi marker, would suggest a trafficking defect beyond ER transport, in contrast with previous reports.12,13 The Golgi complex plays a critical role in specific protein glycosylation, with specific enzymes preferentially retained within the Golgi cisternae. A number of retention strategies include composition and length of their transmembrane domain, protein aggregation/kin recognition, intra-Golgi pH, amino acid (RR and RXR)–based, and lipid composition–based mechanisms.46 However, we have found no reports describing the preferential Golgi localization of disease-associated missense proteins. Both the R168H and R291W mutations are beyond the transmembrane domain and do not appear to create any retention motif. The missense variants neither remove nor insert amino acids involved in specific post-translational modifications. These two mutations are the most C-terminal mutations modeled but continue to show colocalization with NEPHRIN. Although neither variant lies within the transmembrane domain, it remains possible that the resulting change in protein conformation may affect lipid membrane association, thereby affecting the capacity for the protein to progress beyond the Golgi. Golgi retention also involves anterograde and retrograde trafficking to return proteins to the Golgi. The colocalization of R291W with the LE marker RAB7 within Golgi-like punctate perinuclear structures may suggest elevated retrograde endosome-to-trans-Golgi-network trafficking for this particular variant.47
This study identified a clear and previously unappreciated significant decrease of PODOCIN protein in all of the variants. Schwarz et al. previously reported low R138Q PODOCIN protein expression in the biopsy of a patient with SRNS, compared with normal human kidney.8 This suggests either reduced NPHS2 mRNA translation or increased PODOCIN degradation in the presence of these missense variants. An analysis of colocalization with the lysosomal marker LAMP1 suggested no increase in lysosomal trafficking. Increased proteasomal degradation may also result in reduced protein levels. Indeed, rapid proteasomal degradation of R138Q PODOCIN variant was previously reported in immortalized podocyte cell lines stably transfected with variant or wild-type NPHS2 constructs.16
To investigate the effect of NPHS2 variant disruption to podocytes, we performed transcriptional profiling specifically on isolated OrgGloms sieved from kidney organoids. The simultaneous analysis of the allelic series combined with the two-way comparison of patient and parental material revealed no genuine transcriptional change. Although apparently unenlightening, this reinforces a pathology related to PODOCIN trafficking and stability rather than any consequential shift in expression profile. It also provides a word of caution with respect to overinterpretation of technical variables in the absence of sufficient comparator lines. Of note, although ER sequestration has been an accepted defect for NPHS2 missense variants, we found no evidence of upregulation of ER stress pathways either via direct analysis or in transcriptional profiling.
NPHS2 variant–induced apoptosis was previously described in immortalized podocytes transfected with R168H variant, compared with wild-type PODOCIN.43 Despite the differential mistrafficking for each variant, all variants displayed a unified apoptotic phenotype, suggesting a common downstream pathophysiological mechanism. PODOCIN acts as an anchor protein for cell–cell junctions and actin cytoskeleton in the podocyte.48 Critically, it also recruits the key slit-diaphragm protein NEPHRIN to lipid raft microdomains at the membrane2,7,10 allowing NEPHRIN to play a role in cell–cell adhesion, cell survival, and regulation of actin cytoskeleton.49,50 Previous reports have suggested that NEPHRIN localization is dependent on its cytosolic interaction with PODOCIN, with R138Q, V180M, and R291W NPHS2 variants indirectly affecting NEPHRIN targeting to plasma membrane and lipid raft microdomains.2,13 Our data indicated that P118L, R168H, and R291W variants all showed a degree of NEPHRIN sequestration in ER or Golgi, presumably reducing NEPHRIN transport to the plasma membrane. Interestingly, R138Q only partially prevented NEPHRIN trafficking to the membrane.
In summary, this study has improved our understanding of the effect of specific NPHS2 missense variants, highlighting variant-specific disruption to trafficking, a uniform reduction in total PODOCIN protein, disruption to NEPHRIN trafficking, and ER-stress independent apoptosis. The knowledge gained on each PODOCIN variant, and the cell lines generated in this work, provide the opportunity to develop targeted therapeutic strategies adapted to address individual NPHS2 variants.
Supplementary Material
Acknowledgments
We thank Dr. Katerina Vlahos and the Murdoch Children’s Research Institute iPSC Core for patient iPSC line derivation, Matthew McLeod and the Victorian Clinical Genetics Services/Murdoch Children’s Research Institute Sequencing and Development Platform for library preparation and bulk RNA sequencing, and Dr. Matthew Burton and the Murdoch Children’s Research Institute Flow Cytometry & Imaging facility. Because Prof. M.H. Little is an editor of the Journal of the American Society of Nephrology, she was not involved in the peer review process for this manuscript. A guest editor oversaw the peer review and decision-making process for this manuscript.
Published online ahead of print. Publication date available at www.jasn.org.
See related editorial, “Pinpointing Podocin Trafficking Defects in Kidney Organoids,” on pages 2–4.
Disclosures
A. Dorison reports having an advisory or leadership role as a member of the Medical Research Future Fund 2021 Stem Cell Therapies Grant Assessment Committee for the National Health and Medical Research Council. C. Quinlan reports having employment with a partner MYOB (Australian software company); and reports having an advisory or leadership role on the Blue Ribbon Panel of Nephmadness, as an executive member of Nephrology Social Media Collective, faculty member of NephSim, and on the Education and Training committee of Australian and New Zealand Society of Nephrology. M.H. Little reports receiving research funding from Novo Nordisk; reports having patents or royalties with Murdoch Children’s Research Institute and Uniquest; reports having advisory or leadership role as a Board Member of Research Australia, CEO of Novo Nordisk Foundation Center for Stem Cell Medicine, and President of International Society for Stem Cell Research; reports being a member of the editorial board of Cell Stem Cell, Development, Journal of the American Society for Nephrology, Kidney International; and reports being a Member of the Advisory Board for Nature Reviews Nephrology; reports speakers bureau through presenting a seminar for Roche and was paid an honorarium; and reports having other interests or relationships as Chief Scientist and Group Leader of Murdoch Children’s Research Institute, Co-Chair of Advisory Committee for the Medical Research Future Fund Stem Cell Therapies Mission Australia, Past President of International Society for Stem Cell Research, Professor of University of Copenhagen, Professor of University of Melbourne, and Reviewer for National Health and Medical Research Council Australia; and reports holding an National Health and Medical Research Council Senior Principal Research Fellowship (GNT1136085). M. Ramialison reports having an advisory or leadership role as Treasurer of the Australian Bioinformatics and Computational Biology Society (not paid). M.A. Saleem reports having consultancy agreements with Confo Therapeutics, Mission Therapeutics, Pfizer, and Retrophin; reports having an ownership interest in Purespring Therapeutics; reports receiving research funding from Evotec, Retrophin, and UCB (global biopharmaceutical company); reports receiving honoraria from Purespring Therapeutics Director and Chief Scientific Officer; reports having patents or royalties from Purespring Therapeutics and the University of Bristol; and reports having an advisory or leadership role as a Director of Purespring Therapeutics. M. See reports having employment with Telstra Australia; reports having an ownership interest in AGL Energy, Austal, Coles Group, Commonwealth Bank of Australia, Medibank Private, Origin Energy, and Woolworths. S.E. Howden reports having consultancy agreements with Ovid Research; and reports having an advisory or leadership role with Scientific Reports. The Murdoch Children's Research Institute Gene Editing Facility is supported by the Stafford Fox Medical Research Foundation, the Novo Nordisk Foundation (NNF21CC0073729) and Phenomics Australia (National Collaborative Research Infrastructure Strategy, NCRIS). T.A. Forbes reports having an ownership interest in their partner owning stocks in Avita Medical, Cochlear, and other Australian Stock Exchange–listed companies without medical or biotechnology affiliations; reports receiving honoraria from Otsuka; reports receiving speakers honorarium from a nondirected donation to research; and reports having other interests or relationships as site principal investigator for Phase 2 and 3 clinical trials for nedosiran with Dicerna/Novo Nordisc; and reports being a Clinician Scientist Fellow supported by the Royal Children’s Hospital Foundation. The research conducted at the Murdoch Children's Research Institute is supported by the Victorian Government's Operational Infrastructure Support Program. All remaining authors have nothing to disclose.
Funding
This work was supported by the Medical Research Future Fund (2007286), the National Health and Medical Research Council of Australia (GNT2011314 and GNT1136085), the Australian Research Council (Stem Cells Australia, SRI110001002), and the Novo Nordisk Foundation Center for Stem Cell Medicine (NNF21CC0073729).
Author Contributions
A. Dorison and M.H. Little conceptualized the study; A. Dorison, T. Peiris, and M. See were responsible for the formal analysis; A. Dorison, T.A. Forbes, M.H. Little, C. Quinlan, M. Ramialison, and M.A. Saleem were responsible for the funding acquisition; A. Dorison, I. Ghobrial and, M. Das were responsible for the investigation; A. Dorison, A. Graham, S.E. Howden, M.H. Little, and M.A. Saleem were responsible for the methodology; A. Dorison and M.H. Little were responsible for the project administration; T.A. Forbes, M.H. Little, and C. Quinlan were responsible for the resources; T. Peiris was responsible for the software; A. Dorison, S.E. Howden, K.T. Lawlor, M.H. Little, and M. Ramialison provided supervision; A. Dorison and M.H. Little were responsible for the validation; A. Dorison and M.H. Little were responsible for the visualization; A. Dorison and M.H. Little wrote the original draft; and A. Dorison, T.A. Forbes, S.E. Howden, K.T. Lawlor, M.H. Little, T. Peiris, M. Ramialison, and M. See reviewed and edited the manuscript.
Data Sharing Statement
All transcriptional profiling datasets have been submitted to GEO (GSE205647). Raw imaging data for PODOCIN localization and image analysis code are available at https://github.com/KidneyRegeneration/Dorison2022. Additional raw data generated in this study is provided in supplemental material or available on reasonable request.
Supplemental Material
This article contains the following supplemental material online at http://links.lww.com/JSN/D630.
Supplemental Figure 1. Sanger sequencing of gene-edited iPS cell lines and predicted truncated protein for G92C variant in presence of indel.
Supplemental Figure 2. Flow cytometry data showing iPS cell line pluripotency.
Supplemental Figure 3. PODOCIN quantification in immunostainings, raw Western blot gels, and NPHS2 expression in gene-edited and patient-derived lines at D7 + 17, and G92C reads in bulk RNA sequencing across the indel region.
Supplemental Figure 4. PODOCIN mislocalization quantification in gene-edited lines.
Supplemental Figure 5. PODOCIN and LAMP1 costaining and quantification in gene-edited and patient-derived lines.
Supplemental Figure 6. PODOCIN mislocalization quantification in patient-derived lines.
Supplemental Figure 7. PODOCIN expression level and pattern in gene-edited and patient-derived lines at D7 + 14.
Supplemental Figure 8. OrgGloms transcriptional profiling in gene-edited and patient-derived lines at D7 + 14.
Supplemental Figure 9. XBP1 splicing raw electrophoresis gels in gene-edited and patient-derived lines at D7 + 17.
Supplemental Figure 10. NEPHRIN quantification in immunostainings in gene-edited and patient derived lines at D7 + 17.
Supplemental File 1. Knock-in template sequences used for gene editing.
REFERENCES
- 1.Bouchireb K, Boyer O, Gribouval O, Nevo F, Huynh-Cong E, Morinière V, et al. : NPHS2 mutations in steroid-resistant nephrotic syndrome: A mutation update and the associated phenotypic spectrum. Hum Mutat 35: 178–186, 2014. 10.1002/humu.22485 [DOI] [PubMed] [Google Scholar]
- 2.Huber TB, Simons M, Hartleben B, Sernetz L, Schmidts M, Gundlach E, et al. : Molecular basis of the functional podocin-nephrin complex: Mutations in the NPHS2 gene disrupt nephrin targeting to lipid raft microdomains. Hum Mol Genet 12: 3397–3405, 2003. 10.1093/hmg/ddg360 [DOI] [PubMed] [Google Scholar]
- 3.Gödel M, Ostendorf BN, Baumer J, Weber K, Huber TB: A novel domain regulating degradation of the glomerular slit diaphragm protein podocin in cell culture systems. PLoS One 8: e57078, 2013. 10.1371/journal.pone.0057078 [DOI] [PMC free article] [PubMed] [Google Scholar]
- 4.Sadowski CE Lovric S Ashraf S Pabst WL Gee HY Kohl S et al. ; SRNS Study Group : A single-gene cause in 29.5% of cases of steroid-resistant nephrotic syndrome. J Am Soc Nephrol 26: 1279–1289, 2015. 10.1681/ASN.2014050489 [DOI] [PMC free article] [PubMed] [Google Scholar]
- 5.Hinkes BG Mucha B Vlangos CN Gbadegesin R Liu J Hasselbacher K et al. ; Arbeitsgemeinschaft für Paediatrische Nephrologie Study Group : Nephrotic syndrome in the first year of life: Two thirds of cases are caused by mutations in 4 genes (NPHS1, NPHS2, WT1, and LAMB2). Pediatrics 119: e907–e919, 2007. 10.1542/peds.2006-2164 [DOI] [PubMed] [Google Scholar]
- 6.Bierzynska A, McCarthy HJ, Soderquest K, Sen ES, Colby E, Ding WY, et al. : Genomic and clinical profiling of a national nephrotic syndrome cohort advocates a precision medicine approach to disease management. Kidney Int 91: 937–947, 2017. 10.1016/j.kint.2016.10.013 [DOI] [PubMed] [Google Scholar]
- 7.Roselli S, Gribouval O, Boute N, Sich M, Benessy F, Attié T, et al. : Podocin localizes in the kidney to the slit diaphragm area. Am J Pathol 160: 131–139, 2002. 10.1016/S0002-9440(10)64357-X [DOI] [PMC free article] [PubMed] [Google Scholar]
- 8.Schwarz K, Simons M, Reiser J, Saleem MA, Faul C, Kriz W, et al. : Podocin, a raft-associated component of the glomerular slit diaphragm, interacts with CD2AP and nephrin. J Clin Invest 108: 1621–1629, 2001. 10.1172/JCI12849 [DOI] [PMC free article] [PubMed] [Google Scholar]
- 9.Sellin L, Huber TB, Gerke P, Quack I, Pavenstädt H, Walz G: NEPH1 defines a novel family of podocin interacting proteins. FASEB J 17: 115–117, 2003. 10.1096/fj.02-0242fje [DOI] [PubMed] [Google Scholar]
- 10.Huber TB, Kottgen M, Schilling B, Walz G, Benzing T: Interaction with podocin facilitates nephrin signaling. J Biol Chem 276: 41543–41546, 2001. 10.1074/jbc.C100452200 [DOI] [PubMed] [Google Scholar]
- 11.Reiser J, Polu KR, Möller CC, Kenlan P, Altintas MM, Wei C, et al. : TRPC6 is a glomerular slit diaphragm-associated channel required for normal renal function. Nat Genet 37: 739–744, 2005. 10.1038/ng1592 [DOI] [PMC free article] [PubMed] [Google Scholar]
- 12.Roselli S, Moutkine I, Gribouval O, Benmerah A, Antignac C: Plasma membrane targeting of podocin through the classical exocytic pathway: Effect of NPHS2 mutations. Traffic 5: 37–44, 2004. 10.1046/j.1600-0854.2003.00148.x [DOI] [PubMed] [Google Scholar]
- 13.Nishibori Y, Liu L, Hosoyamada M, Endou H, Kudo A, Takenaka H, et al. : Disease-causing missense mutations in NPHS2 gene alter normal nephrin trafficking to the plasma membrane. Kidney Int 66: 1755–1765, 2004. 10.1111/j.1523-1755.2004.00898.x [DOI] [PubMed] [Google Scholar]
- 14.Ohashi T, Uchida K, Uchida S, Sasaki S, Nihei H: Intracellular mislocalization of mutant podocin and correction by chemical chaperones. Histochem Cell Biol 119: 257–264, 2003. 10.1007/s00418-003-0511-x [DOI] [PubMed] [Google Scholar]
- 15.Schurek EM, Völker LA, Tax J, Lamkemeyer T, Rinschen MM, Ungrue D, et al. : A disease-causing mutation illuminates the protein membrane topology of the kidney-expressed prohibitin homology (PHB) domain protein podocin. J Biol Chem 289: 11262–11271, 2014. 10.1074/jbc.M113.521773 [DOI] [PMC free article] [PubMed] [Google Scholar]
- 16.Serrano-Perez MC, Tilley FC, Nevo F, Arrondel C, Sbissa S, Martin G, et al. : Endoplasmic reticulum-retained podocin mutants are massively degraded by the proteasome. J Biol Chem 293: 4122–4133, 2018. 10.1074/jbc.RA117.001159 [DOI] [PMC free article] [PubMed] [Google Scholar]
- 17.Philippe A, Weber S, Esquivel EL, Houbron C, Hamard G, Ratelade J, et al. : A missense mutation in podocin leads to early and severe renal disease in mice. Kidney Int 73: 1038–1047, 2008. 10.1038/ki.2008.27 [DOI] [PubMed] [Google Scholar]
- 18.Freedman BS, Brooks CR, Lam AQ, Fu H, Morizane R, Agrawal V, et al. : Modelling kidney disease with CRISPR-mutant kidney organoids derived from human pluripotent epiblast spheroids. Nat Commun 6: 8715, 2015. 10.1038/ncomms9715 [DOI] [PMC free article] [PubMed] [Google Scholar]
- 19.Morizane R, Lam AQ, Freedman BS, Kishi S, Valerius MT, Bonventre JV: Nephron organoids derived from human pluripotent stem cells model kidney development and injury. Nat Biotechnol 33: 1193–1200, 2015. 10.1038/nbt.3392 [DOI] [PMC free article] [PubMed] [Google Scholar]
- 20.Takasato M, Er PX, Chiu HS, Maier B, Baillie GJ, Ferguson C, et al. : Kidney organoids from human iPS cells contain multiple lineages and model human nephrogenesis. Nature 526: 564–568, 2015. 10.1038/nature15695 [DOI] [PubMed] [Google Scholar]
- 21.Taguchi A, Kaku Y, Ohmori T, Sharmin S, Ogawa M, Sasaki H, et al. : Redefining the in vivo origin of metanephric nephron progenitors enables generation of complex kidney structures from pluripotent stem cells. Cell Stem Cell 14: 53–67, 2014. 10.1016/j.stem.2013.11.010 [DOI] [PubMed] [Google Scholar]
- 22.Hale LJ, Howden SE, Phipson B, Lonsdale A, Er PX, Ghobrial I, et al. : 3D organoid-derived human glomeruli for personalised podocyte disease modelling and drug screening. Nat Commun 9: 5167, 2018. 10.1038/s41467-018-07594-z [DOI] [PMC free article] [PubMed] [Google Scholar]
- 23.Djenoune L, Tomar R, Dorison A, Ghobrial I, Schenk H, Hegermann J, et al. : Autonomous calcium signaling in human and zebrafish podocytes controls kidney filtration barrier morphogenesis. J Am Soc Nephrol 32: 1697–1712, 2021. 10.1681/ASN.2020101525 [DOI] [PMC free article] [PubMed] [Google Scholar]
- 24.Saleem MA, O’Hare MJ, Reiser J, Coward RJ, Inward CD, Farren T, et al. : A conditionally immortalized human podocyte cell line demonstrating nephrin and podocin expression. J Am Soc Nephrol 13: 630–638, 2002 [DOI] [PubMed] [Google Scholar]
- 25.Howden SE, Thomson JA, Little MH: Simultaneous reprogramming and gene editing of human fibroblasts. Nat Protoc 13: 875–898, 2018. 10.1038/nprot.2018.007 [DOI] [PMC free article] [PubMed] [Google Scholar]
- 26.Chen G, Gulbranson DR, Hou Z, Bolin JM, Ruotti V, Probasco MD, et al. : Chemically defined conditions for human iPSC derivation and culture. Nat Methods 8: 424–429, 2011. 10.1038/nmeth.1593 [DOI] [PMC free article] [PubMed] [Google Scholar]
- 27.Takasato M, Er PX, Chiu HS, Little MH: Generation of kidney organoids from human pluripotent stem cells. Nat Protoc 11: 1681–1692, 2016. 10.1038/nprot.2016.098 [DOI] [PMC free article] [PubMed] [Google Scholar]
- 28.Lawlor KT, Vanslambrouck JM, Higgins JW, Chambon A, Bishard K, Arndt D, et al. : Cellular extrusion bioprinting improves kidney organoid reproducibility and conformation. Nat Mater 20: 260–271, 2021. 10.1038/s41563-020-00853-9 [DOI] [PMC free article] [PubMed] [Google Scholar]
- 29.Schindelin J, Arganda-Carreras I, Frise E, Kaynig V, Longair M, Pietzsch T, et al. : Fiji: An open-source platform for biological-image analysis. Nat Methods 9: 676–682, 2012. 10.1038/nmeth.2019 [DOI] [PMC free article] [PubMed] [Google Scholar]
- 30.van der Walt S Schönberger JL Nunez-Iglesias J Boulogne F Warner JD Yager N et al. ; scikit-image contributors : scikit-image: Image processing in Python. PeerJ 2: e453, 2014. 10.7717/peerj.453 [DOI] [PMC free article] [PubMed] [Google Scholar]
- 31.Waskom ML: seaborn: Statistical data visualization. J Open Source Softw 6: 3021, 2021. 10.21105/joss.03021 [DOI] [Google Scholar]
- 32.Kirill Tsyganov AJP: Stuart Kenneth Archer, David Powell: RNAsik: A pipeline for complete and reproducible RNA-seq analysis that runs anywhere with speed and ease. J Open Source Softw 3: 583, 2018. 10.21105/joss.00583 [DOI] [Google Scholar]
- 33.Cunningham F, Allen JE, Allen J, Alvarez-Jarreta J, Amode MR, Armean IM, et al. : Ensembl 2022. Nucleic Acids Res 50[D1]: D988–D995, 2022. 10.1093/nar/gkab1049 [DOI] [PMC free article] [PubMed] [Google Scholar]
- 34.Dobin A, Davis CA, Schlesinger F, Drenkow J, Zaleski C, Jha S, et al. : STAR: Ultrafast universal RNA-seq aligner. Bioinformatics 29: 15–21, 2013. 10.1093/bioinformatics/bts635 [DOI] [PMC free article] [PubMed] [Google Scholar]
- 35.Liao Y, Smyth GK, Shi W: featureCounts: An efficient general purpose program for assigning sequence reads to genomic features. Bioinformatics 30: 923–930, 2014. 10.1093/bioinformatics/btt656 [DOI] [PubMed] [Google Scholar]
- 36.Powell DR: Degust: Interactive RNA-seq analysis, 2019 10.5281/zenodo.3258932 [DOI]
- 37.Law CW, Chen Y, Shi W, Smyth GK: voom: Precision weights unlock linear model analysis tools for RNA-seq read counts. Genome Biol 15: R29, 2014. 10.1186/gb-2014-15-2-r29 [DOI] [PMC free article] [PubMed] [Google Scholar]
- 38.Chen J, Bardes EE, Aronow BJ, Jegga AG: ToppGene Suite for gene list enrichment analysis and candidate gene prioritization. Nucleic Acids Res 37: W305-11, 2009. 10.1093/nar/gkp427 [DOI] [PMC free article] [PubMed] [Google Scholar]
- 39.Gu Z, Eils R, Schlesner M: Complex heatmaps reveal patterns and correlations in multidimensional genomic data. Bioinformatics 32: 2847–2849, 2016. 10.1093/bioinformatics/btw313 [DOI] [PubMed] [Google Scholar]
- 40.McKenna A, Hanna M, Banks E, Sivachenko A, Cibulskis K, Kernytsky A, et al. : The Genome Analysis Toolkit: A MapReduce framework for analyzing next-generation DNA sequencing data. Genome Res 20: 1297–1303, 2010. 10.1101/gr.107524.110 [DOI] [PMC free article] [PubMed] [Google Scholar]
- 41.Lindsay H, Burger A, Biyong B, Felker A, Hess C, Zaugg J, et al. : CrispRVariants charts the mutation spectrum of genome engineering experiments. Nat Biotechnol 34: 701–702, 2016. 10.1038/nbt.3628 [DOI] [PubMed] [Google Scholar]
- 42.Manders EMM, Verbeek FJ, Aten JA: Measurement of co-localization of objects in dual-colour confocal images. J Microsc 169: 375–382, 1993. 10.1111/j.1365-2818.1993.tb03313.x [DOI] [PubMed] [Google Scholar]
- 43.Fan Q, Zhang H, Ding J, Liu S, Miao J, Xing Y, et al. : R168H and V165X mutant podocin might induce different degrees of podocyte injury via different molecular mechanisms. Genes Cells 14: 1079–1090, 2009. 10.1111/j.1365-2443.2009.01336.x [DOI] [PubMed] [Google Scholar]
- 44.Majmundar AJ, Buerger F, Forbes TA, Klämbt V, Schneider R, Deutsch K, et al. : Recessive NOS1AP variants impair actin remodeling and cause glomerulopathy in humans and mice. Sci Adv 7: eabe1386, 2021. 10.1126/sciadv.abe1386 [DOI] [PMC free article] [PubMed] [Google Scholar]
- 45.Hetz C: The unfolded protein response: Controlling cell fate decisions under ER stress and beyond. Nat Rev Mol Cell Biol 13: 89–102, 2012. 10.1038/nrm3270 [DOI] [PubMed] [Google Scholar]
- 46.Banfield DK: Mechanisms of protein retention in the Golgi. Cold Spring Harb Perspect Biol 3: a005264, 2011. 10.1101/cshperspect.a005264 [DOI] [PMC free article] [PubMed] [Google Scholar]
- 47.Tu Y, Zhao L, Billadeau DD, Jia D: Endosome-to-TGN trafficking: Organelle-vesicle and organelle-organelle interactions. Front Cell Dev Biol 8: 163, 2020. 10.3389/fcell.2020.00163 [DOI] [PMC free article] [PubMed] [Google Scholar]
- 48.Shono A, Tsukaguchi H, Yaoita E, Nameta M, Kurihara H, Qin XS, et al. : Podocin participates in the assembly of tight junctions between foot processes in nephrotic podocytes. J Am Soc Nephrol 18: 2525–2533, 2007. 10.1681/ASN.2006101084 [DOI] [PubMed] [Google Scholar]
- 49.Kestilä M, Lenkkeri U, Männikkö M, Lamerdin J, McCready P, Putaala H, et al. : Positionally cloned gene for a novel glomerular protein--nephrin--is mutated in congenital nephrotic syndrome. Mol Cell 1: 575–582, 1998. 10.1016/s1097-2765(00)80057-x [DOI] [PubMed] [Google Scholar]
- 50.Akchurin O, Reidy KJ: Genetic causes of proteinuria and nephrotic syndrome: Impact on podocyte pathobiology. Pediatr Nephrol 30: 221–233, 2015. 10.1007/s00467-014-2753-3 [DOI] [PMC free article] [PubMed] [Google Scholar]
Associated Data
This section collects any data citations, data availability statements, or supplementary materials included in this article.
Data Availability Statement
All transcriptional profiling datasets have been submitted to GEO (GSE205647). Raw imaging data for PODOCIN localization and image analysis code are available at https://github.com/KidneyRegeneration/Dorison2022. Additional raw data generated in this study is provided in supplemental material or available on reasonable request.