Abstract
The EWS-FLI1 fusion oncoprotein deregulates transcription to initiate the pediatric cancer Ewing sarcoma. Here, we used a domain-focused CRISPR screen to implicate the transcriptional repressor ETV6 as a unique dependency in this tumor. Using biochemical assays and epigenomics, we show that ETV6 competes with EWS-FLI1 for binding to select DNA elements enriched for short GGAA repeat sequences. Upon inactivating ETV6, EWS-FLI1 overtakes and hyper-activates these cis-elements to promote mesenchymal differentiation, with SOX11 being a key downstream target. We show that squelching of ETV6 with a dominant-interfering peptide phenocopies these effects and suppresses Ewing sarcoma growth in vivo. These findings reveal targeting of ETV6 as a strategy for neutralizing the EWS-FLI1 oncoprotein by reprogramming of genomic occupancy.
Introduction
Ewing sarcoma is an aggressive bone tumor occurring in children and young adults, which currently lacks effective therapies for metastatic disease1–4. The most common genetic alteration in this tumor is a chromosomal translocation that fuses the intrinsically disordered N-terminus of EWS (encoded by EWSR1) to the C-terminal DNA-binding domain of the ETS transcription factor FLI15,6. The resulting EWS-FLI1 fusion protein is an oncogenic transcription factor that promotes sarcoma formation through aberrant interactions with DNA and with protein cofactors. For example, the wild-type FLI1 protein preferentially binds to single GGAA motifs (also known as ETS motifs) found at promoters and distal enhancer elements7–10. In contrast, the EWS-FLI1 fusion acquires a neomorphic ability to bind to tandem GGAA repeats, which are often referred to as microsatellites when greater than 16 nucleotides in length (4 tandem GGAA repeats)10–15. GGAA microsatellites are normally packaged into condensed heterochromatin and lack a regulatory function, yet EWS-FLI1 converts these sequences into functional enhancers that elevate transcription of nearby genes 10,14,16,17. While GGAA microsatellites are high affinity EWS-FLI1 binding sites, this fusion protein will also associate with a wide-range of GGAA-containing DNA elements with varying motif densities and configurations10,18. Another important aspect of EWS-FLI1 function is its interaction with protein cofactors (e.g., BAF and p300/CBP), which are often mediated by the EWS portion of the fusion protein15,19,20. The net output of EWS-FLI1 function is a blockade of cell differentiation, which can be reversed by genetic perturbation of this oncoprotein21,22. As a powerful driver and dependency, EWS-FLI1 and its interactions are potential points for therapeutic intervention in Ewing sarcoma.
The transcriptional repressor ETV6 (also known as TEL) is another member of the ETS transcription factor family that binds to GGAA-containing DNA elements23,24. One unique feature of ETV6 relative to other ETS proteins is its SAM (sterile alpha motif) domain, which facilitates homo-oligomerization25. Genetic and biochemical experiments indicate that ETV6 oligomerization is critical for stable DNA binding and for transcriptional repression25,26. ETV6 is widely expressed in mouse and human tissues, yet genetic studies implicate a specific role in normal and malignant hematopoiesis27,28. For example, loss-of-function mutations of ETV6 confer a germline predisposition to leukemia29 and translocations that fuse the ETV6 SAM domain with >20 different fusion partners have been identified in leukemia and in various solid tumor contexts30,31. To our knowledge, no prior study has shown a role for ETV6 in Ewing sarcoma.
Here we performed a genetic screen in search of essential transcription factors in Ewing sarcoma cell lines, which revealed a role for ETV6 in this tumor. We provide evidence that this genetic dependency is due to the competing functions of ETV6 (a repressor) and EWS-FLI1 (an activator) at a common set of GGAA-containing DNA sequences. We identify hundreds of such elements in the genome in which ETV6 and EWS-FLI1 exert antagonistic effects on enhancer activity, which we show underlies ETV6 dependency. These findings reveal how competition among activating and repressive ETS transcription factors can establish a molecular dependency in cancer.
Results
ETV6 is a unique dependency in Ewing sarcoma cell lines
We previously performed transcription factor (TF)-focused CRISPR-Cas9 sgRNA ‘dropout’ screening to identify dependencies in acute myeloid leukemia32, small cell lung cancer33, pancreatic cancer32, and rhabdomyosarcoma34. Here, we extended this approach to three Ewing sarcoma cell lines in search of unique transcriptional dependencies. Using our existing DNA binding domain-focused sgRNA library, we targeted 1,437 TFs in Cas9-expressing A673, TC71, and RH1 Ewing sarcoma lines and tracked the impact on cell fitness by quantifying the change in sgRNA abundance after 14 population doublings. By comparing the results with screening data obtained in other cancer lineages32–34, we nominated FLI1 and ETV6 as the top Ewing sarcoma-biased TF dependencies (Fig. 1a, 1b). Importantly, the specificity of FLI1 and ETV6 dependency to Ewing sarcoma was corroborated by genome-wide screening results obtained by the Cancer Dependency Map Project (Fig. 1c, 1d), which profiled gene essentiality in >800 cancer cell lines and included 16 Ewing sarcoma lines35,36. Of note, our screens validated wild-type FLI1 as a lineage survival gene in leukemia cell lines37–39, whereas ETV6 is not a consistent dependency in this context (Fig. 1b). While the growth arrest caused by sgRNAs targeting FLI1 in Ewing sarcoma is in accord with the presence of the EWS-FLI1 fusion oncoprotein, we are unaware of any prior study investigating ETV6 in this tumor.
Fig. 1 |. ETV6 is a dependency in Ewing sarcoma.
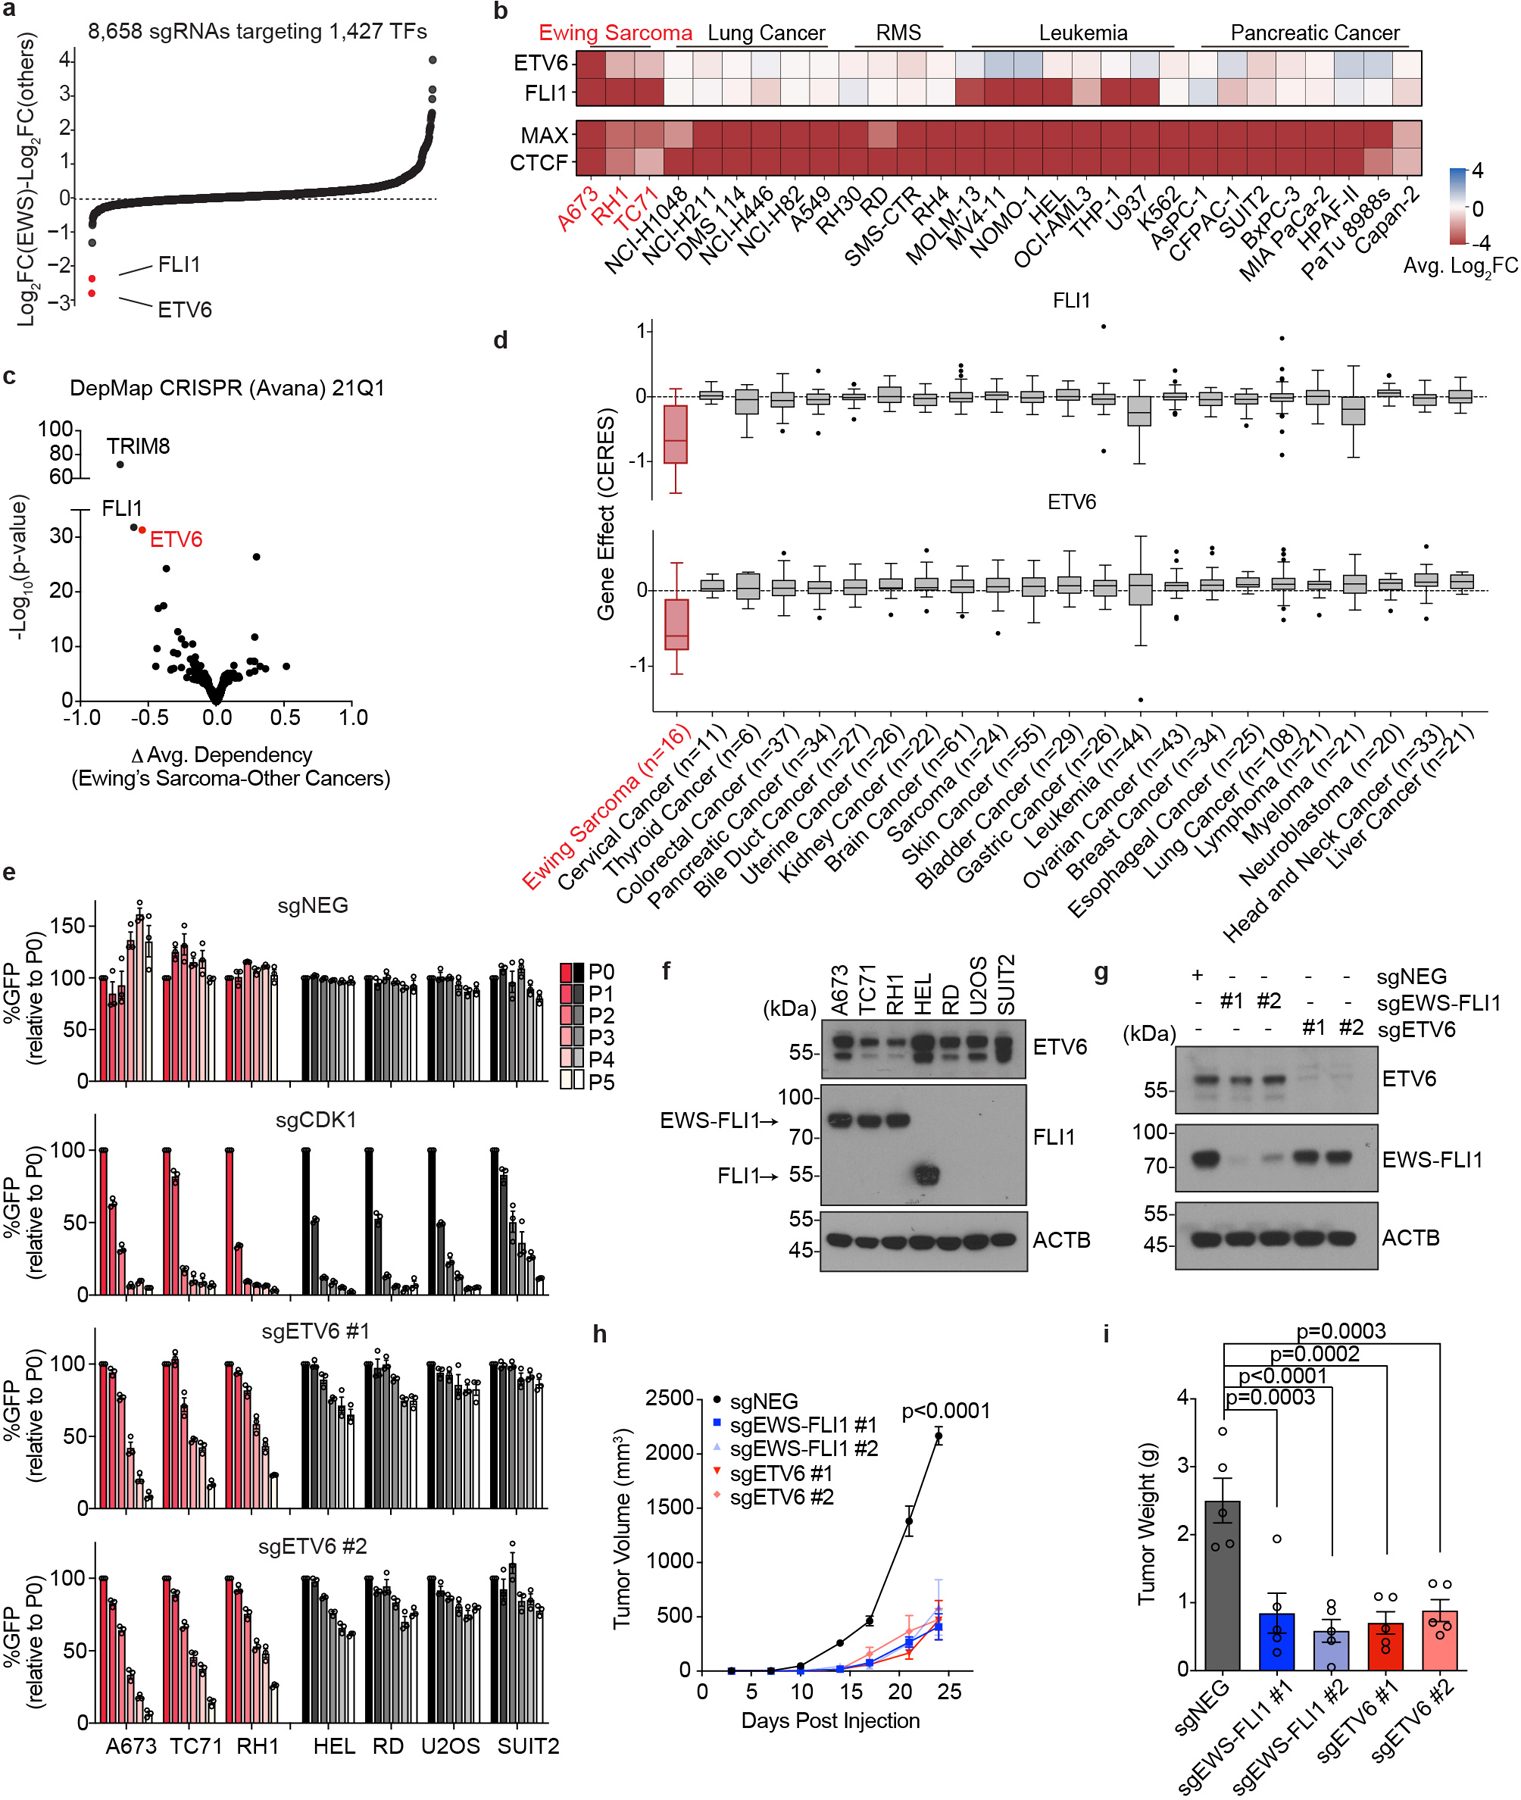
a, Summary of TF domain focused CRISPR screens. Plotted are 1,427 TFs ranked by preferential essentiality in Ewing sarcoma (n = 3) against all other cell lines (n = 26). The most Ewing sarcoma biased hits (ETV6 and FLI1) are labelled in red. b, Heat map of sgRNA abundance changes of two hits (ETV6 and FLI1) and two pan-essential controls (CTCF and MAX) in different cancer cell lines. RMS, rhabdomyosarcoma. c, Analysis of Ewing sarcoma biased essentiality using Project Achilles (21Q1) screening data. The P values compared gene effect scores in Ewing sarcoma (n = 16) versus other cancers (n = 792) using two-tailed unpaired Student’s t-test. d, Dependency scores of FLI1 and ETV6 on DepMap. Box plots indicate the distribution of dependency scores extracted from Project Achilles (21Q1) (CERES: a normalized metric of gene essentiality) of FLI1 (top) and ETV6 (bottom) across different cancer types. Box plot with centre line represents the median; lower and upper hinges indicate 25th and 75th percentiles; whiskers extend to 1.5 times the interquartile range (IQR). e, Competition-based proliferation assay of individual sgRNAs performed in Cas9-expressing cells. The expression of sgRNA is linked to a GFP reporter. The relative GFP percentage (normalized to P0) over culturing is plotted. An sgRNA targeting CDK1 was included as a positive control. sgNEG, negative control. Data are mean ± standard error of the mean (s.e.m.) (n = 3 biological replicates). f, Western blot of ETV6 and FLI1 (or EWS-FLI1) level across different cancer cell lines. β-Actin (ACTB) was included as a loading control. g, Western blot of ETV6 and EWS-FLI1 levels in A673 cells infected with indicated sgRNAs before subcutaneous injection. h, Average growth curves of EWS-FLI1 or ETV6 knockout A673 xenografts in immunodeficient mice. Differences in tumour volume were examined using simultaneous tests for general linear hypotheses of contrasts of interest. Data are mean ± s.e.m. P values were adjusted for multiple comparisons using the Bonferroni–Holm method (n = 5 tumours). i, Weight of the resected tumours at the end point. Data are mean ± s.e.m. Tumour weights were compared using one-way ANOVA test followed by pairwise comparisons using two-sample
To validate the results of our genetic screens, we performed competition-based proliferation assays in three Ewing sarcoma and four non-Ewing cancer cell lines following CRISPR-based targeting of ETV6 or CDK1 (a pan-essential gene) (Fig. 1e). These experiments showed that targeting ETV6 with two independent sgRNAs impaired cell fitness of Ewing sarcoma cell lines but had minimal effects on cell lines representing other cancer lineages (Fig. 1e). In contrast, CDK1 was essential in all of these cell lines (Fig. 1e). Western blotting revealed that ETV6 is expressed at similar levels in Ewing and non-Ewing cancer cell lines, which is distinct from the expression pattern of FLI1 and EWS-FLI1 (Fig. 1f). In addition, ETV6 expression in Ewing sarcoma primary tumors did not correlate with clinical outcomes (Extended Data Fig. 1a-b). Western blotting also confirmed the on-target effects of ETV6 sgRNAs and revealed that the differential requirement for ETV6 in Ewing vs non-Ewing lines was not due to differences in CRISPR genome editing (Extended Data Fig. 1c). Using xenograft experiments in immunodeficient mice, we verified that ETV6 and EWS-FLI1 are both dependencies under in vivo conditions (Fig. 1g-i, Extended Data Fig. 1d-e).
We next investigated the cellular phenotype of ETV6-deficient Ewing sarcoma cells. Using BrdU incorporation and DNA content analyses, we found that targeting of ETV6 led to an arrest of A673 cells in the G1/G0 stage of the cell cycle (Fig. 2a). In addition, ETV6 knockout xenograft tumors showed a reduced mitotic index without any evidence of apoptosis (Extended Data Fig. 1f-g). We also noticed a striking change in cell morphology following ETV6 inactivation, associated with a significant increase in cell size (Fig. 2b-c, Extended Data Fig. 2a-d). These findings resemble differentiation phenotypes described previously in Ewing sarcoma40, and were further supported by increased expression of mesenchymal lineages markers alpha smooth muscle actin (α-SMA) and type I collagen (Collagen I)41,42 observed using immunofluorescence staining (Fig. 2b, Extended Data Fig. 2a, 2b, 2c, 2e). To further evaluate this phenotype, we performed an RNA-seq analysis at a day 5 time point after knockout of ETV6 in three Ewing sarcoma and three non-Ewing cancer cell lines (Fig. 2d, Extended Data Fig. 3a, 3b). Using a gene ontology analysis, we found that knockout of ETV6 significantly increased the expression of genes related to mesenchymal cell differentiation as a top-ranking gene signature in all three Ewing cell line contexts (Fig. 2e). We observed fewer overall gene expression changes upon targeting of ETV6 in non-Ewing cell lines, without changes in mesenchymal differentiation genes (Extended Data Fig. 3a, 3c). Collectively, these findings suggest that ETV6 is needed in Ewing sarcoma to maintain a block in cell differentiation. EWS-FLI1 is also needed to prevent mesenchymal differentiation in Ewing sarcoma22, however we observed that the differentiation signature of ETV6- and EWS-FLI1-deficient cells was distinct at the transcriptome level (Extended Data Fig. 3d). Targeting of EWS-FLI1 is also known to promote invasion and motility phenotypes in Ewing sarcoma cells43,44; however, these effects do not occur upon targeting of ETV6 (Extended Data Fig. 4a, 4b).
Fig. 2 |. ETV6 knockout in Ewing sarcoma drives mesenchymal differentiation.
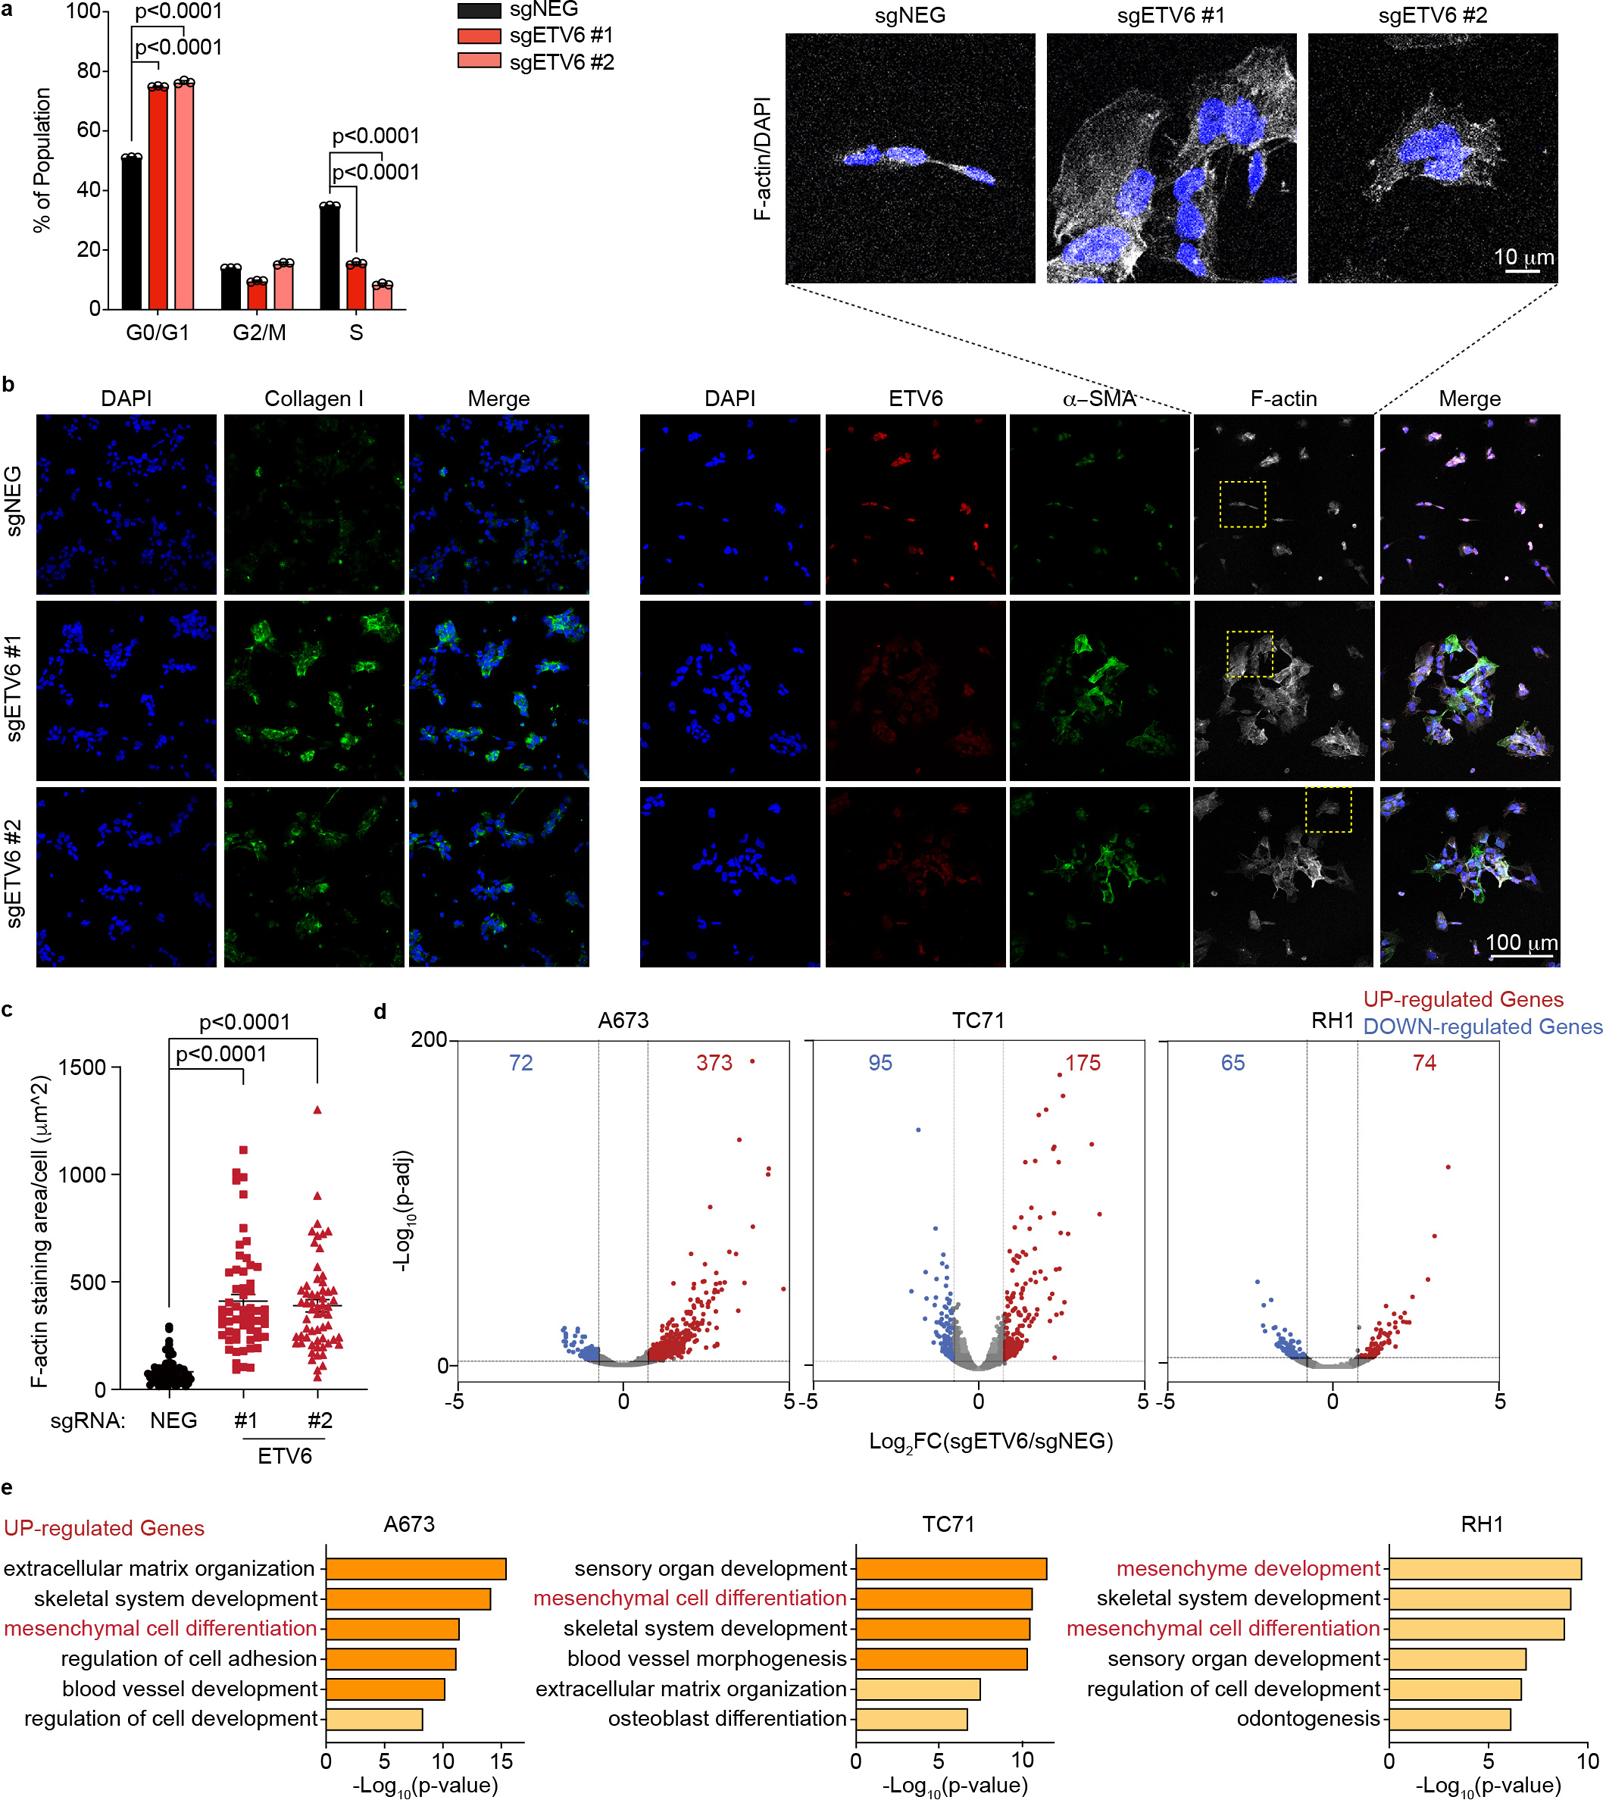
a, Cell cycle analysis based on BrdU incorporation and DNA content (7-AAD) staining of A673 cells infected with indicated sgRNAs. Data are mean ± s.e.m. P values were calculated using one-way ANOVA, Dunnett’s multiple comparison tests (n = 3 biological replicates). b, Representative images of immunofluorescence staining for ETV6 (red), two mesenchymal differentiation markers: collagen I (green, left), α-SMA (green, right) and the cytoskeleton component F-actin (white) in A673 cells infected with indicated sgRNAs. Top: zoomed-in areas of F-actin and DAPI overlay. c, Quantification of cell size based on F-actin staining. The size of F-actin-stained area (μm2 ) per cell was quantified in each group. Data are mean ± s.e.m. P values were calculated using Kruskal– Wallis one-way ANOVA, Dunnett’s multiple comparison tests (sgNEG; n = 65 cells, sgETV6 #1; n = 58 cells; sgETV6 #2; n = 60 cells). d, Volcano plots showing the gene changes upon ETV6 knockout in three different Ewing sarcoma cell lines assessed by RNA-seq. Upregulated genes (log2FC >0.5, adjusted P value
Distinct repression targets underlie ETV6 dependency
We observed a striking cell type specificity of gene expression changes following ETV6 knockout in the aforementioned RNA-seq data (Fig. 3a). Furthermore, the common up-regulated genes in Ewing sarcoma cells were not significantly changed upon ETV6 knockout in non-Ewing cells (Fig. 3b). This led us to hypothesize that ETV6 occupies a distinct set of target genes in Ewing sarcoma. To directly evaluate this, we performed chromatin immunoprecipitation coupled with high-throughput DNA sequencing (ChIP-seq) to define ETV6-occupied regions in Ewing (A673) and non-Ewing (RD, U2OS, and SUIT2) cell lines. As expected, we found that global ETV6 occupancy in Ewing sarcoma was distinct from its occupancy pattern in non-Ewing lines (Extended Data Fig. 5a). In A673 cells, we intersected ETV6 occupancy with ETV6 knockout RNA-seq data to define 895 ETV6 peaks in the vicinity of 313 genes as direct repression targets of ETV6 in this context (Fig. 3c). For simplicity, we hereafter refer to these 895 elements as ‘R sites’ (Supplementary Table 1). Using ChIP-seq analysis of the active chromatin mark histone H3K27 acetylation, we confirmed that ETV6 is required to suppress active chromatin at R sites (Fig. 3d, 3e). These results indicate that the repression function of ETV6 is directed to unique target genes in Ewing sarcoma.
Fig. 3 |. ETV6-mediated transcriptional repression is essential in Ewing sarcoma.
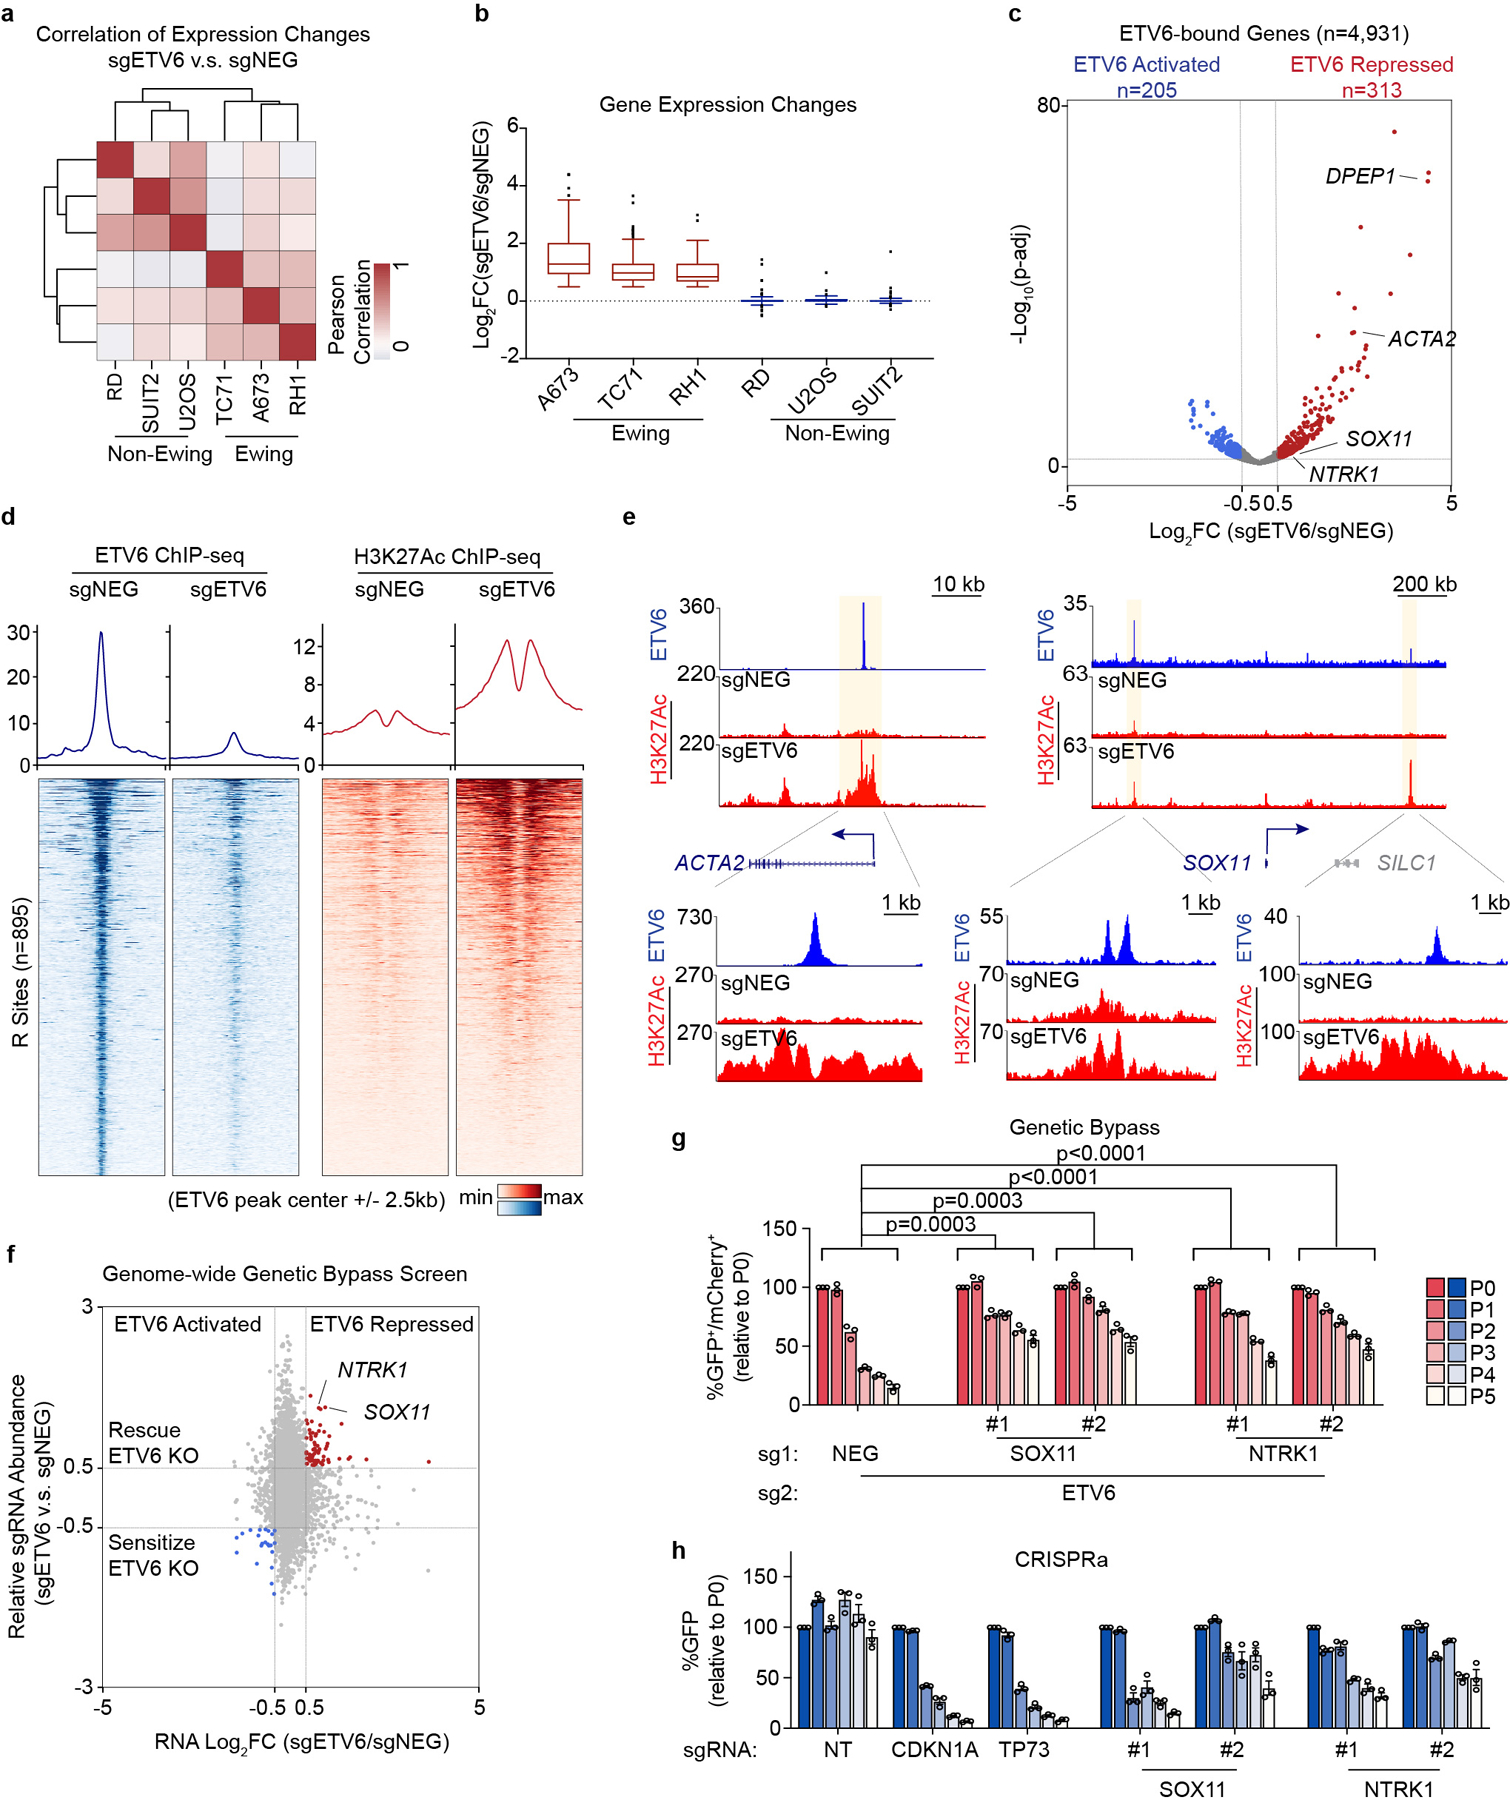
a, Heat map representation of unsupervised hierarchical clustering of six cancer cell lines based on all the gene changes upon ETV6 knockout assessed by RNA-seq. Colour coding indicates Pearson correlation coefficient. b, Box plot showing the gene expression changes of common upregulated genes (log2FC >0.5) in three Ewing sarcoma cell lines across six different cancer cell lines (n = 80 genes). Box plot with centre line represents the median; lower and upper hinges indicate 25th and 75th percentiles; whiskers extend to 1.5 times the IQR. c, Volcano plot showing the expression changes upon ETV6 knockout of all the ETV6-bound genes, which were defined by expressed genes (in either control or ETV6 knockout cells) with a ETV6 peak nearby in A673 cells. ETV6- repressed genes (log2FC >0.5, adjusted P value
We next sought to determine whether repression of R sites is relevant to the ETV6 dependency. To evaluate this, we performed a genetic bypass screen in which Cas9-expressing A673 cells were transduced with a genome-wide sgRNA library, followed by transduction with an ETV6 or control sgRNA (Extended Data Fig. 5b). We then evaluated for sgRNAs (knockouts) that underwent positive selection specifically in ETV6 knockout cells and compared the list of genes to those harboring R sites in their vicinity. This approach nominated SOX11 and NTRK1 as ETV6 repression targets that alleviate ETV6 dependency when genetically inactivated (Fig. 3f). We validated these findings using competition-based proliferation assays, in which sgRNAs that inactivate SOX11 or NTRK1 each resulted in a partial rescue of the cell fitness defects caused by ETV6 knockout both in vitro and in vivo, with more consistent effects being observed for SOX11 (Fig. 3g, Extended Data Fig. 5d-g). In addition, overexpression of SOX11 and NTRK1 using CRISPR-activation was found to be sufficient to suppress cell proliferation (Fig. 3h, Extended Data Fig. 6a-c). Notably, SOX11 and NTRK1 are both located near R sites (Supplementary Table 1), and the expression of each gene was unaffected by ETV6 knockout in non-Ewing cell lines (Extended Data Fig. 6d). These findings suggest that ETV6-mediated repression is essential in the context of Ewing sarcoma, with SOX11, and to a lesser extent NTRK1, being important targets contributing to this dependency.
ETV6 competes with EWS-FLI1 for binding to repeat sequences
As a powerful pioneer factor with chromatin opening capabilities15, we hypothesized that EWS-FLI1 was responsible for instructing ETV6 to occupy R sites in Ewing sarcoma. Using ChIP-seq, we observed an overlapping pattern of global EWS-FLI1 and ETV6 chromatin occupancy in Ewing sarcoma cells (Extended Data Fig. 7a), with 65% of R sites harboring occupancy of the EWS-FLI1 (Fig. 4a, 4b). This prompted us to evaluate how perturbation of EWS-FLI1 would influence the ETV6 cistrome. Using ChIP-seq, we found that ETV6 occupancy at R sites was significantly reduced in EWS-FLI1 knockout cells (Fig. 4c). In accord with these findings, an RNA-seq analysis comparing ETV6 knockout and ETV6/EWS-FLI1 double knockout A673 cells revealed that de-repression of R sites following ETV6 knockout required the presence of an intact EWS-FLI1 oncoprotein (Fig. 4d, Extended Data Fig. 7b). A prior study has shown that ectopic expression of EWS-FLI1 in the rhabdomyosarcoma cell line RD leads to the acquisition of a Ewing-like transcriptome45. We used this cell line system to evaluate how ectopic expression of EWS-FLI1 would influence endogenous ETV6 occupancy. Consistent with the loss-of-function experiments performed in A673 cells, we found that expressing EWS-FLI1 in RD cells was sufficient to redirect ETV6 to R sites (Fig. 4e). RNA-seq experiments validated that ETV6-mediated repression of R sites only occurred in RD cells if EWS-FLI1 was ectopically expressed (Fig. 4f, Extended Data Fig. 7c). Taken together, these experiments support that ETV6-mediated repression is instructed to R sites by the presence of EWS-FLI1.
Fig. 4 |. ETV6 antagonizes EWS-FLI1-mediated enhancer activation at select DNA elements.
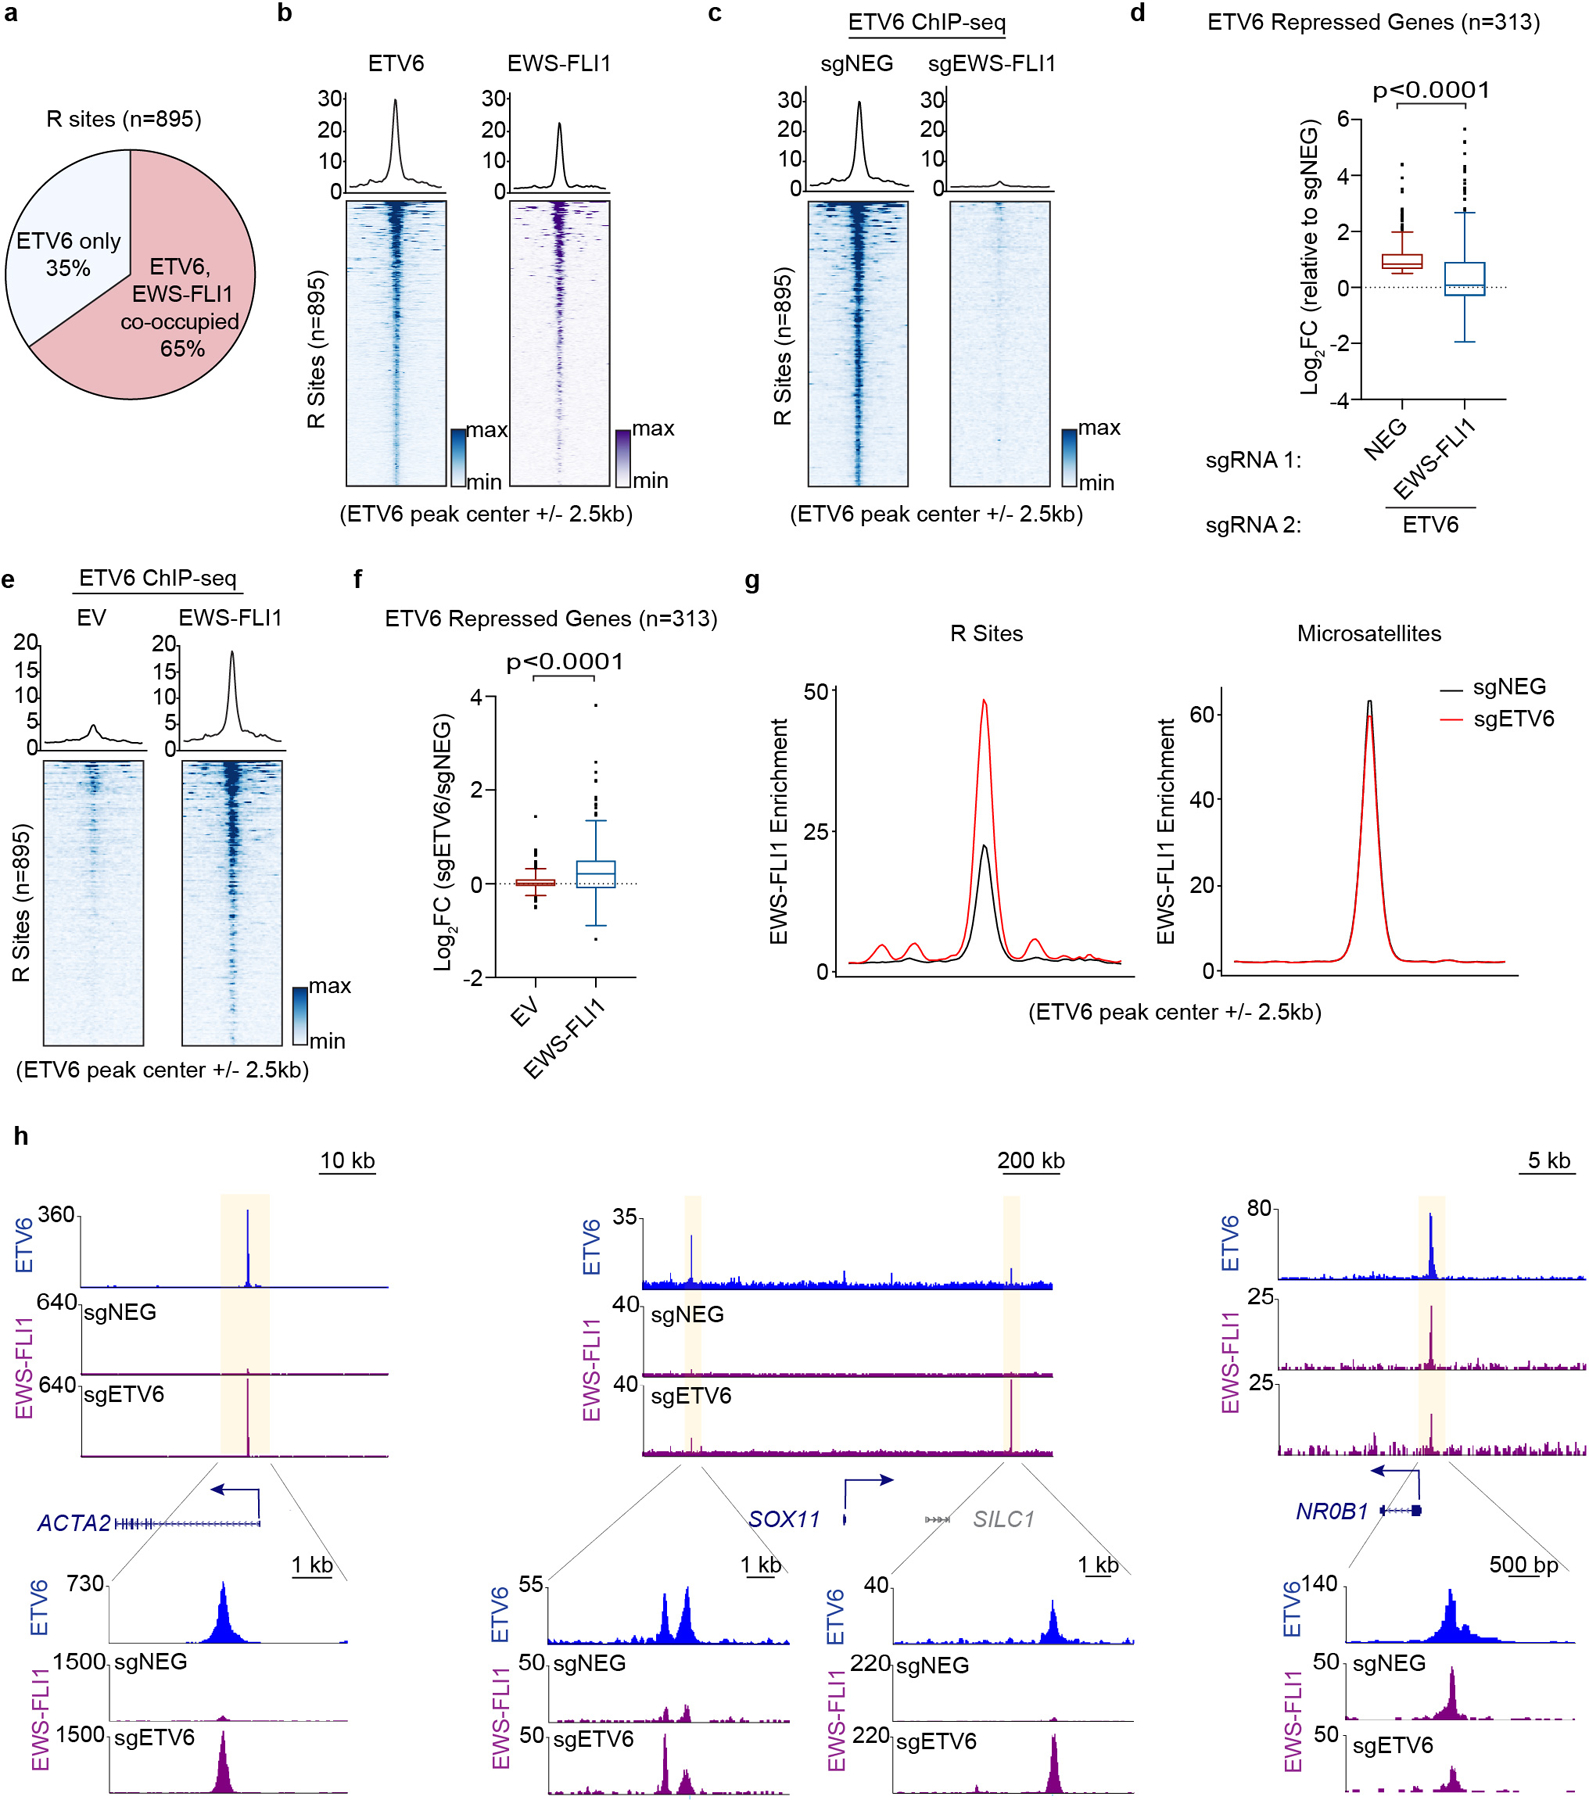
a, Pie chart showing the percentage of ETV6 only, and ETV6 and EWS-FLI1 co-occupied R sites. b, Bottom: density plot showing the occupancy of ETV6 (blue) and EWS-FLI1 (purple) 5 kb surrounding the summit of R sites in A673 cells. The peaks were ranked by mean intensity within each condition. Top: metagene plots indicate the mean of ChIP–seq signal at R sites in each group. c, Metagene and density plots of ETV6 occupancy 5 kb surrounding the summits R sites in A673 cells upon EWS-FLI1 knockout. d, Box plots showing the expression changes of all the ETV6-repressed genes upon ETV6 knockout in A673 cells with or without EWS-FLI1. Cas9-expressing A673 cells were infected with a dual-sgRNA expression vector. All the gene expression changes were normalized to cells expressing sgNEG-sgNEG#2. Box plot with centre line represents the median; lower and upper hinges indicate 25th and 75th percentiles; whiskers extend to 1.5 times the IQR. P value was calculated using two-tailed unpaired Student’s t-test. e, Metagene and density plots of ETV6 occupancy 5 kb surrounding the summits R sites in RD cells with or without EWS-FLI1 induction. f, Box plots showing the expression changes of ETV6-repressed genes upon ETV6 knockout in RD cells with or without EWS-FLI1 induction. Box plot and P value are as described in d. g, Metagene representation of mean EWS-FLI1 ChIP–seq signal changes 5 kb surrounding the summits of R sites and microsatellites in A673 cells upon ETV6 knockout. The microsatellites were annotated by ETV6 peaks with (GGAA)≥4. h, Gene tracks of ETV6 and EWS-FLI1 ChIP–seq occupancy upon ETV6 knockout at three gene loci in two different scales.
We noticed that the enrichment of EWS-FLI1 at R sites was significantly weaker than its enrichment at microsatellite elements (Extended Data Fig. 7d), where this oncoprotein performs a well-established activation function (e.g. at the NR0B1 locus)10,13. Since ETV6 is known to have repressive effects on chromatin23, we considered whether ETV6 functions as a barrier at R sites to prevent EWS-FLI1-mediated enhancer activation. To evaluate this, we performed EWS-FLI1 ChIP-seq following ETV6 knockout in A673 cells. Remarkably, we found that the knockout of ETV6 led to a marked increase in EWS-FLI1 occupancy at R sites (e.g., at the ACTA2 and SOX11 loci), whereas EWS-FLI1 occupancy was minimally affected at the majority of its binding sites across the genome (e.g., at the NR0B1 locus) (Fig. 4g, 4h, Extended Data Fig. 7e-j). These experiments reveal two levels of interaction between EWS-FLI1 and ETV6 at R sites: EWS-FLI1 functions as a pioneer factor that allows for ETV6 to gain access to these elements, and yet ETV6 functions as a barrier that prevents EWS-FLI1 from achieving full enhancer activation.
Since EWS-FLI1 and ETV6 DNA-binding domains both bind to GGAA (ETS) motifs, we considered the possibility that these two TFs bind to DNA in a competitive manner at specific sites in the genome. By visual inspection of several representative binding sites, we noticed that R sites tend to have shorter GGAA repeat lengths (e.g., ACTA2 and SOX11) when compared to the longer GGAA microsatellites seen at conventional EWS-FLI1 binding sites (e.g., at the NR0B1 locus) (Fig. 5a). To evaluate this in a systematic manner, we compared GGAA density and repeat lengths at all EWS-FLI1-occupied sites in the genome with those elements displaying evidence of competitive DNA binding with ETV6 (Fig. 5b). This confirmed that ETV6-competitive EWS-FLI1 binding sites have significantly shorter GGAA repeat lengths than conventional EWS-FLI1-occupied DNA element (Fig. 5c).
Fig. 5 |. ETV6 competes with EWS-FLI1 at short, interspersed GGAA repeats.
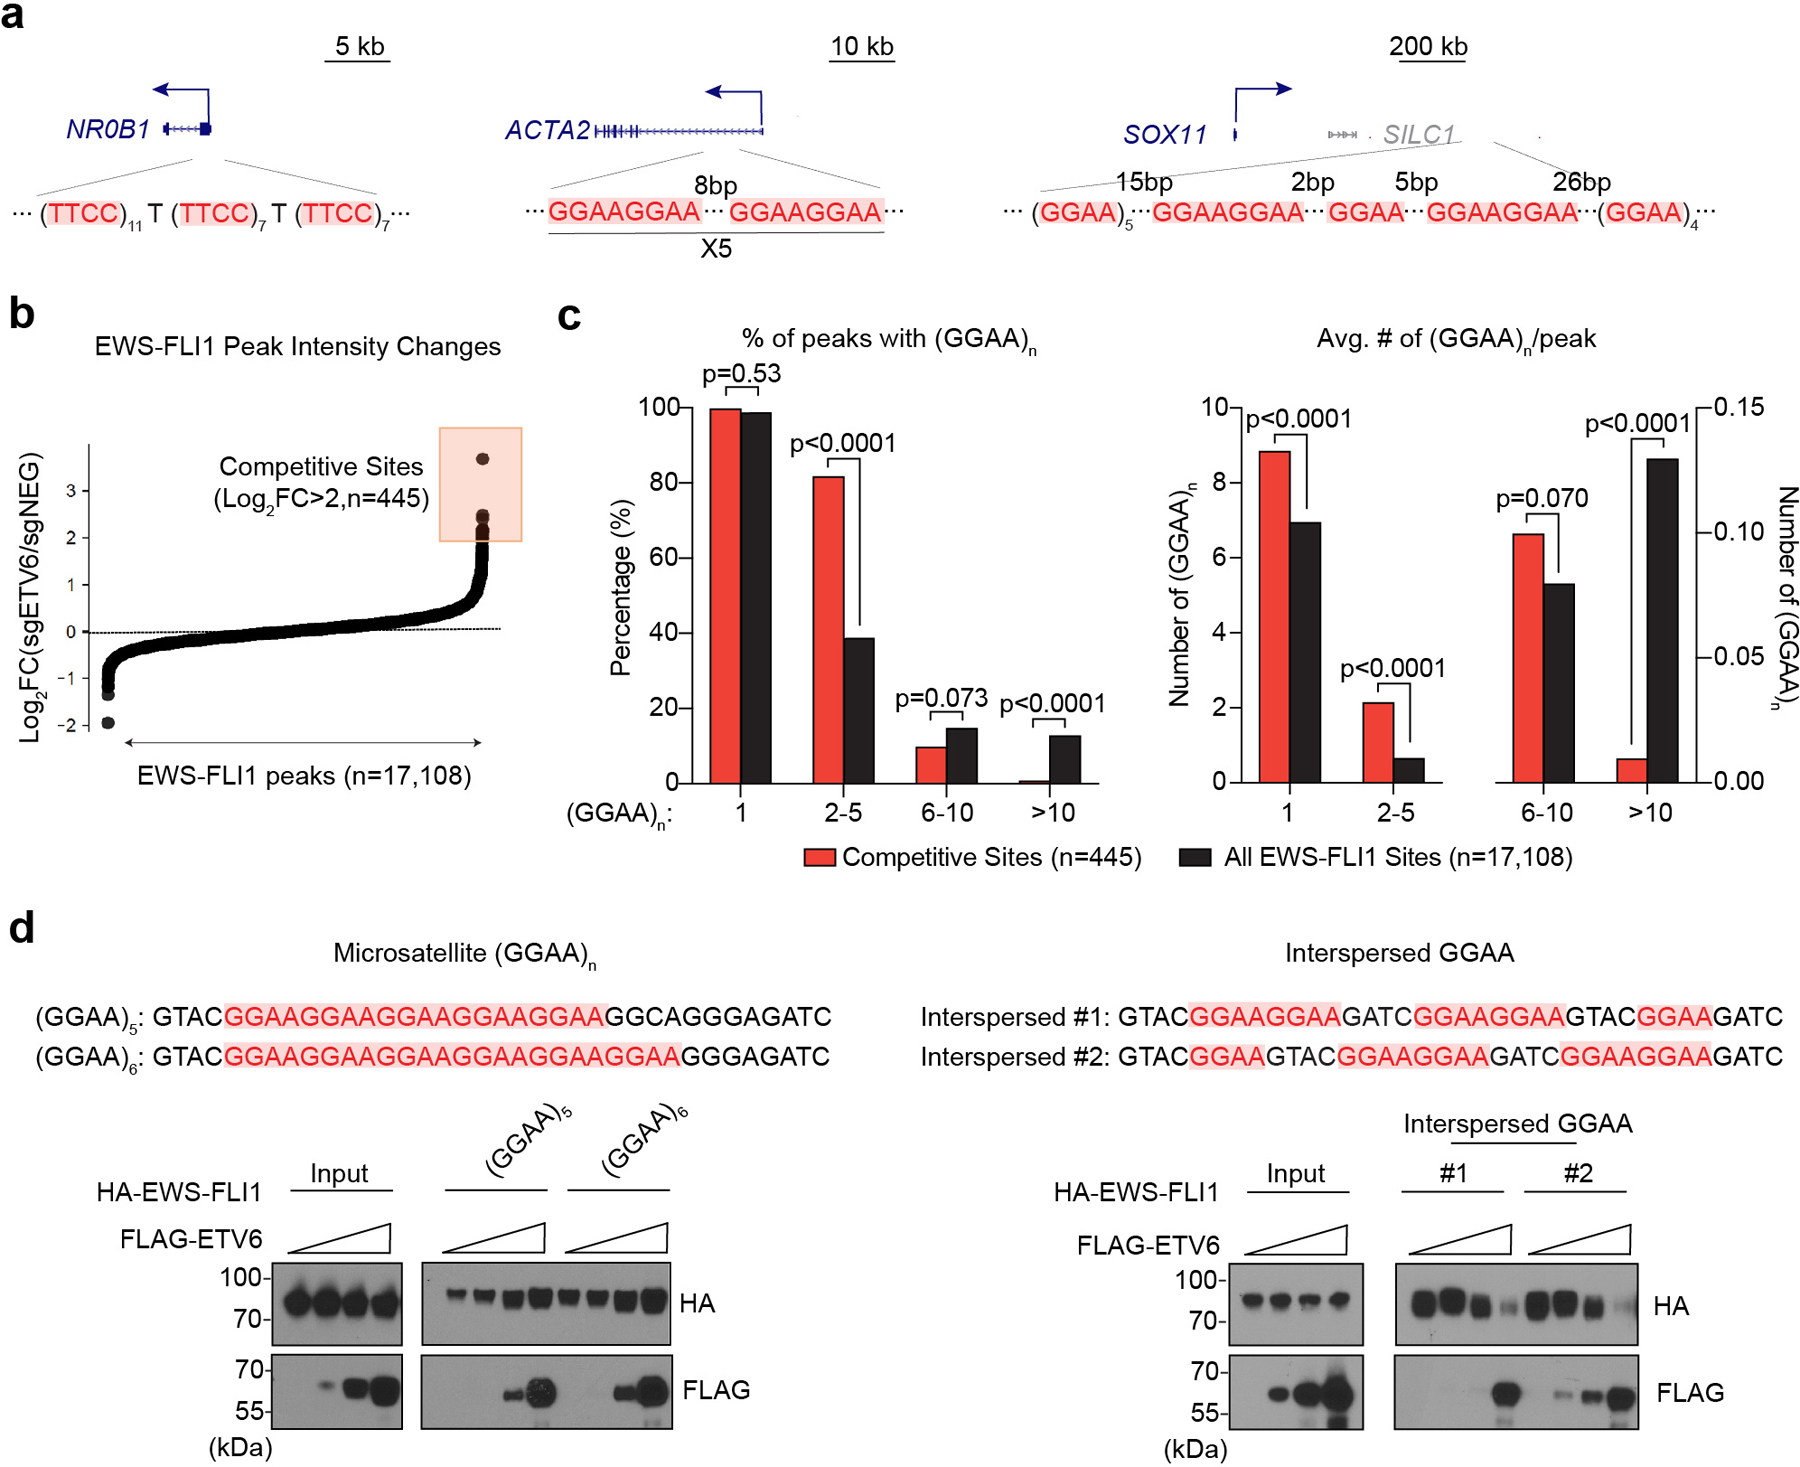
a, The underlying DNA sequences at EWS-FLI1 peak centre region near NR0B1, ACTA2 and SOX11. b, Scatter plot of all the EWS-FLI1 peaks ranked by the intensity changes upon ETV6 knockout in A673 cells. The competitive sites (n = 445) were defined by log2FC >2. c, The percentage of peaks with at least one (GGAA)n (left) and the average number of (GGAA)n per peak (right) were compared between competitive and all the EWS-FLI1 sites. Different lengths of GGAA repeat sequences were divided into four groups (n = 1, n = ~2–5, n = ~6–10 and n > 10). Fisher’s exact test was used to determine if there was a significant difference in the proportion of (GGAA)n between competitive and all groups. For the average number of (GGAA)n, P values were calculated using Mann–Whitney U test. d, Biotinylated DNA pulldown assay evaluating the competitive binding between ETV6 and EWS-FLI1 to different DNA probes. The same amount of HA-tagged EWS-FLI1 with increasing levels of FLAG-tagged ETV6 were incubated with microsatellites-like (left) or interspersed GGAA (right) DNA probes. The protein pulled down by each probe was evaluated using western blot.
These epigenomic observations led us to perform biochemical experiments to evaluate whether GGAA repeat length is a determinant of competitive DNA binding by ETV6 and EWS-FLI1. We immobilized biotinylated DNA as baits on streptavidin beads harboring either GGAA microsatellites or shorter GGAA repeats. As input for this pulldown, we prepared cell lysates containing HA-EWS-FLI1 together with titrated amounts of FLAG-ETV6 to evaluate for competitive DNA binding (Fig. 5d). In the setting of microsatellites, we found that ETV6 was unable to compete with EWS-FLI1 for DNA binding, and in fact we noted enhanced DNA occupancy upon coexpressing the two TFs (Fig. 5d). In contrast, when using shorter, interspersed GGAA repeat DNA baits, we found that ETV6 effectively displaced EWS-FLI1 from DNA in a concentration-dependent manner (Fig. 5d). In accord with prior evidence46, we found that ETV6 does not physically interact with EWS-FLI1, but can interact with wild-type FLI1 (Extended Data Fig. 8). Taken together, these findings are concordant with our epigenomic experiments, and suggest that GGAA repeat length is a determinant of competitive DNA binding by EWS-FLI1 and ETV6 to antagonistically regulate enhancer activity.
A dominant-interfering SAM peptide blocks ETV6 in vivo
Finally, we sought to evaluate the significance of oligomerization to the essential function of ETV6 in Ewing sarcoma (Fig. 6a). Prior studies have shown that a double point mutation of the SAM domain (A94D, V113E) prevents the formation of ETV6 head-to-tail oligomers in vitro25, a finding we confirmed using co-immunoprecipitation experiments (Fig. 6b). Using a gene complementation assay with a CRISPR-resistant cDNA, we found that this oligomerization mutant was unable to support Ewing sarcoma proliferation despite being expressed at a similar level to the wild-type ETV6 (Fig. 6c, Extended Data Fig. 9a). This observation led us to investigate whether the SAM domain could be adapted into a dominant-interfering peptide that alters endogenous ETV6 function through a squelching mechanism47. To this end, we verified that expressing an 85 amino acid SAM domain fragment was sufficient to bind full-length ETV6 (Extended Data Fig. 9b). Since this domain lacks a functional DNA-binding domain, we reasoned that this protein might form ineffectual oligomers that would be incapable of transcriptional repression (Fig. 6a). When we expressed this peptide in A673 cells we observed an arrest in cell proliferation, whereas expressing the SAM domain in RD cells led to no significant change in cell proliferation (Fig. 6d, 6e, Extended Data Fig. 9c). As a control, we verified that the mutant SAM domain incapable of oligomerization had no significant effect on cell growth (Fig. 6d). Using RNA-seq and ChIP-seq analyses, we found that expressing this peptide led to similar transcriptional changes as the ETV6 knockout: reduced ETV6 occupancy and the acquisition of EWS-FLI1 at R sites (Fig. 6f, 6g, Extended Data Fig. 9d, 9e). Finally, we used a doxycycline-inducible promoter to express this peptide in A673 xenografts, which we found suppressed tumor growth in vivo (Fig. 6h, 6i). These findings reveal a ligand-based targeting strategy that that reverses the repressive function of ETV6, reprograms EWS-FLI1 occupancy, and suppresses sarcomagenesis.
Fig. 6 |. Squelching of ETV6 with a SAM domain reprogrammes EWS-FLI1 occupancy and blocks Ewing sarcoma growth in vivo.
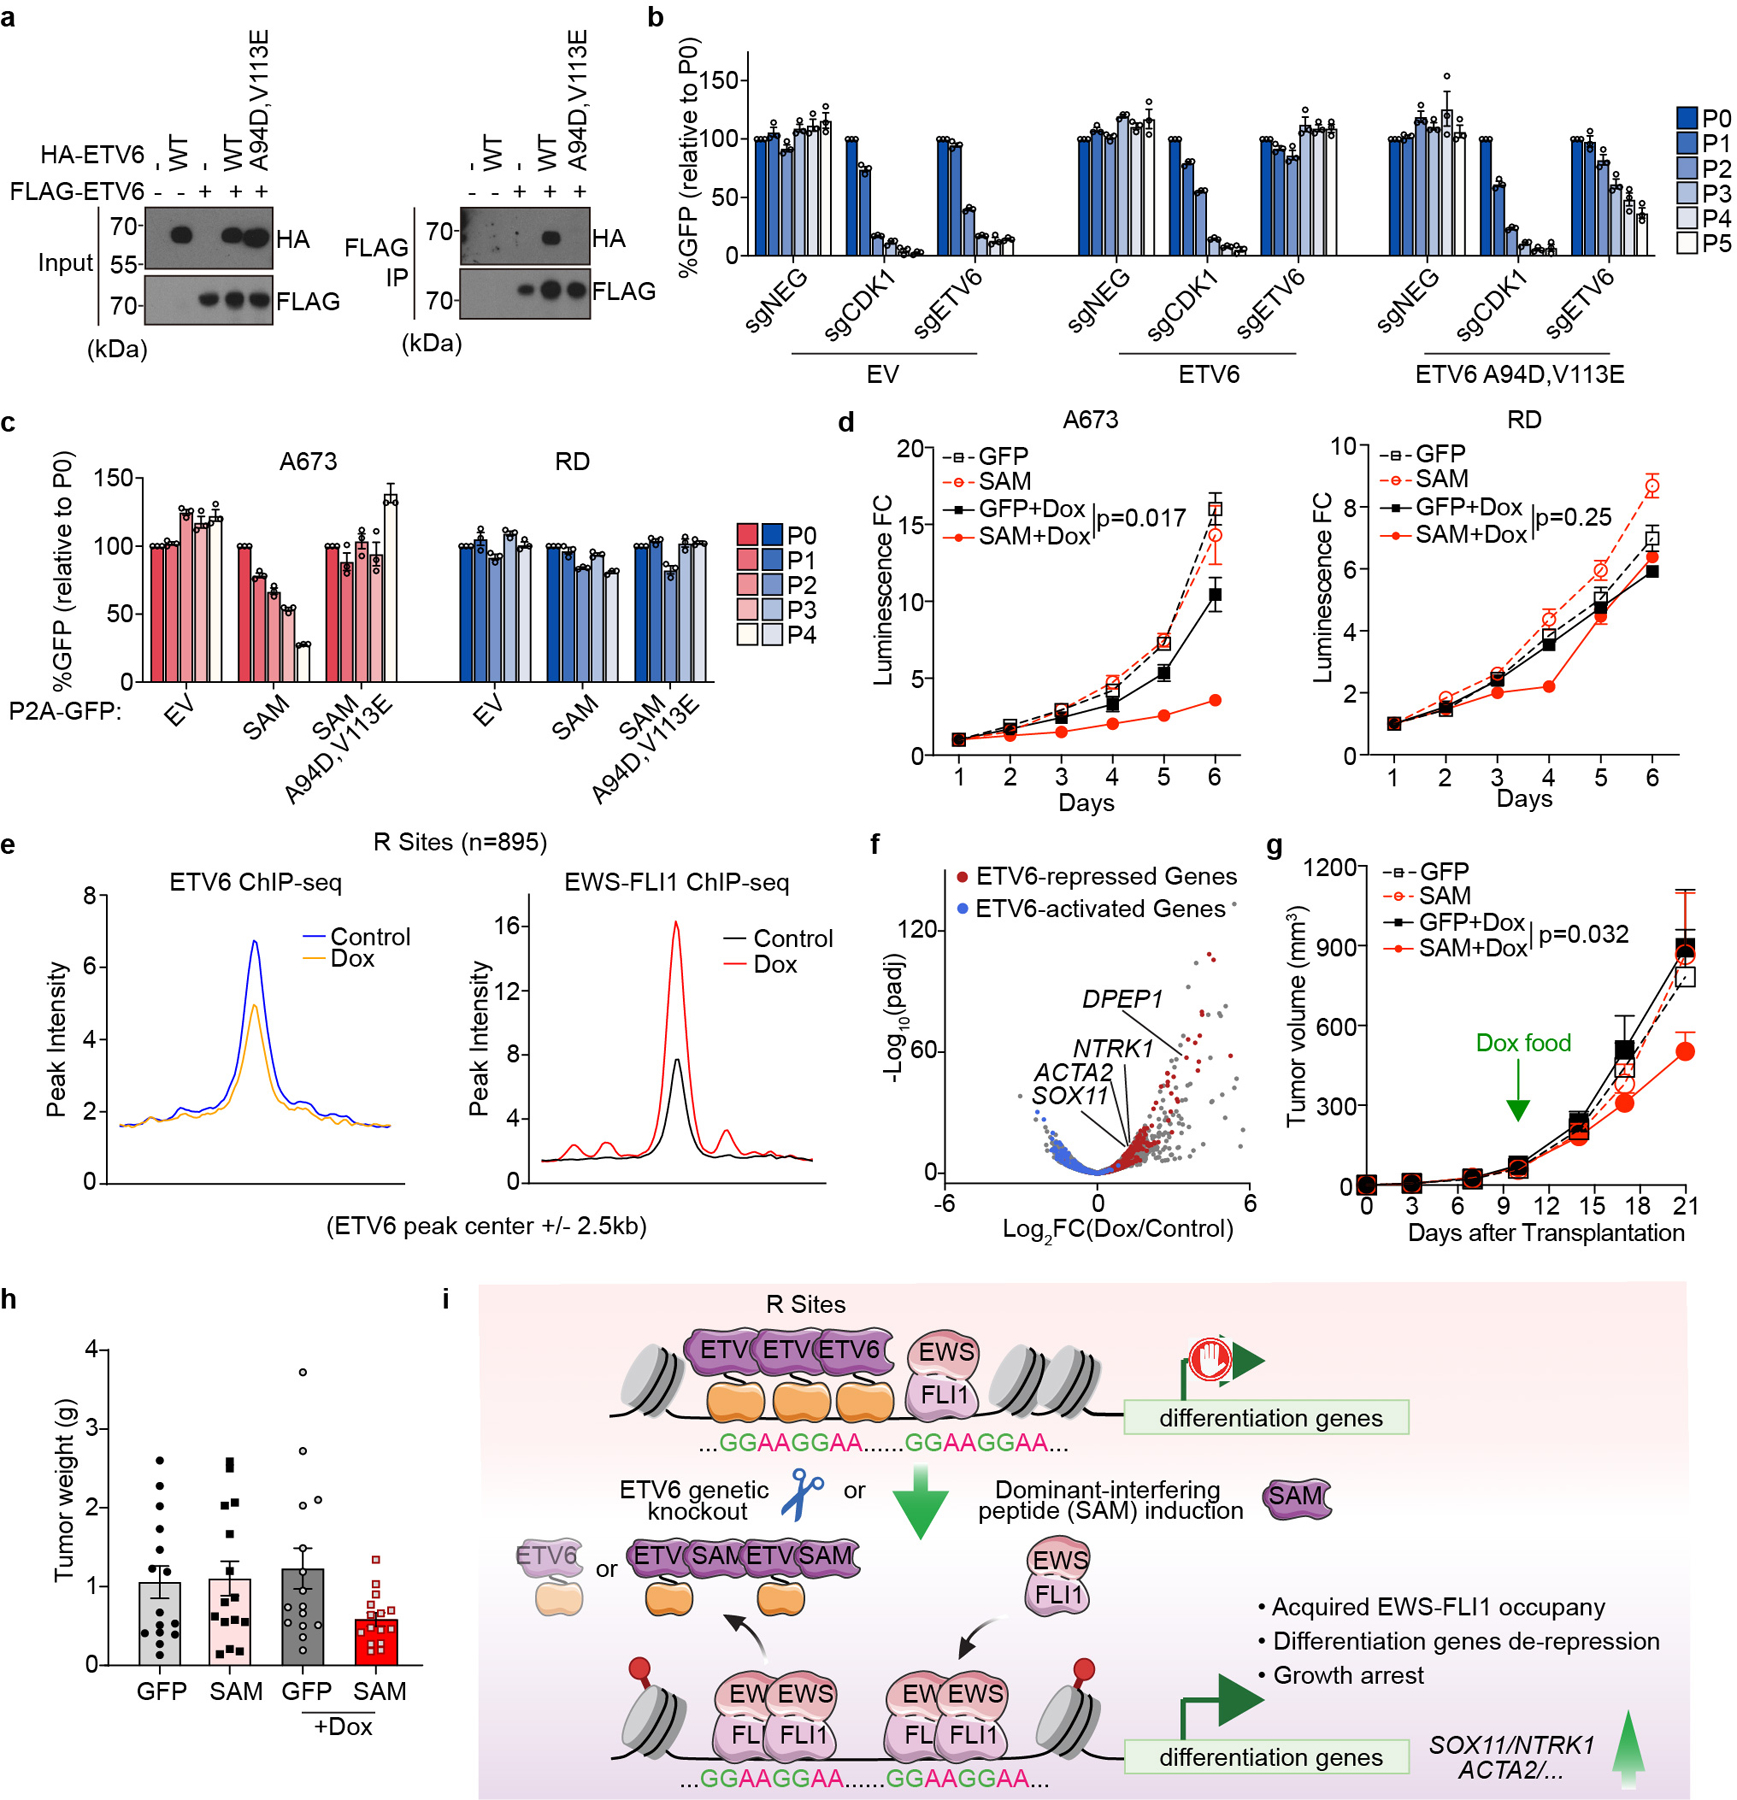
a, Immunoprecipitation assay showing ETV6 (A94D and V113E) mutant is defective for selfoligomerization. b, Competition-based proliferation assay in A673 cells harbouring empty vector, sgRNA-resistant 3× FLAG-tagged wild-type or (A94D and V113E) mutant ETV6 cDNA and infected with a control (sgNEG), CDK1 or ETV6 sgRNA. Data are mean ± s.e.m (n = 3 biological replicates). c, Competition-based proliferation assay evaluating the effects of different ETV6 fragments induction to cell fitness in A673 and RD cells. The expression of FLAG-tagged ETV6 SAM fragment is linked to a GFP reporter. Data are mean ± s.e.m. (n = 3 biological replicates). d, CellTiter-Glo assay evaluating the effects of SAM induction to A673 and RD cell proliferation in vitro. The relative luminescence FCs to day 1 were plotted. Data are mean ± s.e.m. P values were calculated using two-way ANOVA (n = 3 biological replicates). e, Metagene representation of the mean ETV6 and EWS-FLI1 signal changes upon ETV6 SAM induction across R sites. f, Volcano plot showing the gene expression changes upon ETV6 SAM induction in A673 cells. The ETV6 repressed (red) and activated (blue) genes were defined on the basis of the genetic knockout of ETV6 in the same cell line. g, Average growth curves of Dox-inducible GFP- or SAM-expressing A673 xenografts in immunodeficient mice. The mice in Dox groups were put on Dox food on day 10 post injection. Linear mixed-effects model with treatment, time and treatment by time interaction as fixed effects and sample specific random intercept was used to fit the longitudinal tumour volume data. Differences in tumour volume were examined using simultaneous tests for general linear hypotheses of contrasts of interest. Data are mean ± s.e.m. P values were adjusted for multiple comparisons using the Bonferroni–Holm’s method (n = 15 tumours). h, Weights of the resected tumours at the end point. Data are mean ± s.e.m (n = 15 tumours). i, Model of EWS-FLI1 imposed ETV6 dependency in Ewing sarcoma.
Discussion
Using a TF-focused genetic screen, we identified ETV6 as a co-dependency of EWS-FLI1 in Ewing sarcoma. Underlying this co-dependency is an antagonistic interplay between EWS-FLI1 and ETV6 within the enhancer landscape of this tumor. Consistent with its role as a pioneer factor10–12,15,16, we have discovered that EWS-FLI1 opens hundreds of R elements across the genome to enable occupancy of ETV6. Once ETV6 gains access to these sites, it functions as a barrier that prevents further increases in EWS-FLI1 occupancy, thereby blocking enhancer activation. In addition, our epigenomic and biochemical experiments reveal short, interspersed GGAA repeats as the sequence feature underlying ETV6-mediated antagonism of EWS-FLI1 (Fig. 7). The remarkable attribute of this mechanism is in demonstrating how inactivating ETV6 converts EWS-FLI1 from an oncoprotein into a tumor suppressor by reprogramming its genomic occupancy towards differentiation-promoting genes.
Genetic alterations of the ETS family of TFs are a common driver mechanism of human cancer48. All ETS TFs share a conserved winged helix-turn-helix DBD of ~85 amino acids, which bind to a consensus DNA sequence containing a core GGAA or GGAT motif9,49,50. Despite the similarity of their DNA binding domains, different flanking sequence preferences and protein cofactor binding affinities contribute to their site selection in vivo9,10. Owing to these similar biochemical features, however, a precedent exists for ETS proteins functioning cooperatively or competitively at distinct sites of the genome, which is often attributed to shared recognition of GGAA-containing cis elements10,46,51,52. In this study, we have shown how a gain-of-function alteration of one ETS protein (EWS-FLI1) can drive a dependency on another (ETV6) through their antagonistic effects on enhancer activity. The broader implication of this finding is in revealing a molecular vulnerability of ETS-deregulated cancers attributed to the competitive interplay among paralogous members of this TF family.
Taken together with prior studies, our work suggests broader relevance of ETS protein interactions during normal and malignant cellular processes. For example, FLI1 and ERG coregulate common target genes and are both required for normal HSC and megakaryocyte homeostasis, suggesting cooperativity between these two TFs51. In addition, it has been shown that competition between ETS TFs ERG and ERF at a common set of GGAA-containing elements can be imbalanced genetically (gain of function of ERG or loss of function of ERF) to promote the pathogenesis of prostate cancer53. In Ewing sarcoma, it has been shown previously that EWS-FLI1 can displace the ETS factor ELF1 from GGAA-containing enhancer elements to promote repression of nearby genes10. These finding reinforce how a perturbation of one ETS protein can lead to a cascade of secondary changes in other members of this TF family to promote cancer.
Emerging evidence indicates how discrete alterations of EWS-FLI1 output can lead to striking cellular phenotypes in Ewing sarcoma. For example, EWS-FLI1 expression is heterogeneous in Ewing tumors, with EWS-FLI1low being more metastatic than EWS-FLI1high cells43. Another recent study has shown how recurrent genetic inactivation of STAG2 attenuates EWS-FLI1 driven oncogenic programs, which likewise enhances metastatic potential of Ewing sarcoma cells54, in accord with STAG2-mutant Ewing sarcoma patients having a higher rate of metastatic disease and worse outcomes55. Moreover, heterogeneity in EWS-FLI1 transcription activity is also associated with the highly polymorphic feature of GGAA microsatellites, which potentially contributes to the differences in permissiveness to Ewing sarcoma within and between ethnically distinct population56–59. Our study calls attention to an inherent plasticity of the EWS-FLI1 cistrome, which might also be a source of biological variability in human tumors depending on the relative expression/function of other ETS proteins.
The net consequence of inactivating ETV6 is an attenuation of Ewing sarcomagenesis, an observation that might have therapeutic significance. Our genetic experiments implicate the SAM domain of ETV6 as a potential target for therapeutic intervention, which has a known molecular structure with defined surfaces for self-oligomerization25. Moreover, the ETV6-SAM domain has been shown to be fused with many partner proteins including more than 10 tyrosine kinase genes in multiple cancer contexts31. Thus, an important objective for future research would be to develop small-molecules that block ETV6 oligomerization as targeted therapy in Ewing sarcoma and for other tumors driven by ETV6-fusion oncoproteins.
Methods
Cells and Cell Culture
Ewing sarcoma cell line A673 (ATCC, CRL-1598), rhabdomyosarcoma cell line RD (ATCC, CCL-136), osteosarcoma cell line U2OS and HEK293T cells were cultured in DMEM supplemented with 10% FBS (Corning, 35–010-CV). Ewing sarcoma cell line TC71 (DSMZ, ACC-516) was cultured in Iscove’s MDM supplemented with 15% FBS. Ewing sarcoma cell line RH1 (DSMZ, ACC-493) and leukemia cell line HEL (ATCC, TIB-180) were cultured in RPMI 1640 supplemented with 10% FBS. The Ewing sarcoma patient-derived tumor cells PSaRC219 (harboring a type1 EWS-FLI1 fusion) and PSaRC31860 (harboring a type 3 EWS-FLI1 fusion) were maintained in the Iscove’s MDM supplemented with 15% FBS and 1X Insulin-Transferrin-Selenium (Gibco, 41400045), on fibronectin (Sigma, F0895) coated plates. Penicillin/Streptomycin was added to all media. All cell lines were cultured at 37 °C with 5% CO2 and periodically tested for mycoplasma infections. The Cas9 expressing cancer cell lines in this study were generated by the lentiviral transduction with a Cas9 expression vector EFS-Cas9-P2A-Puro (Addgene, 108100) or EFS-Cas9-P2A-Blast. The cDNA of dCas9-VPR (Addgene, 63798) was cloned into the EFS-cDNA-P2A-Blast vector for the transduction of cancer cell lines used in CRISPR activation experiments.
Plasmid Construction and sgRNA Cloning
The lentiviral sgRNA backbones used in competition assays, LRG2.1 (Addgene, 108098) and LRmCherry2.1 (Addgene, 108099) have been described previously61. For in vivo studies, the sgRNAs were cloned into LRG-Blast2.1. For the FACS-based cell cycle analysis and immunofluorescent staining experiments, LRNeo2.1 was used. In the genetic bypass screening, the human U6 promoter of LRNeo2.1 was replaced by a murine U6 promoter. Dual sgRNA vectors were constructed as described in a previous study13. DNA oligos of the sgRNAs were cloned into backbones using a BsmBI restriction site. A detailed list of sgRNAs used in this study is supplied as Supplementary Table 2.
The cDNA of human ETV6 (ORIGENE, SC118922) was cloned into lentiV-P2A-Neo for viral transduction of cancer cell lines and pcDNA3.1 for transient expression in HEK293T cells with a 3×FLAG tag at N-terminus. EWS-FLI1 cDNA (Addgene, 102813) was cloned into pcDNA3.1 with a N-terminal HA tag. In the RD reprogramming experiment, the GFP reporter in LRG2.1 sgRNA vector was replaced by the EWS-FLI1 cDNA, to achieve sgRNA and cDNA co-expression. For experiments involving doxycycline-inducible expression, GFP or FLAG tagged ETV6 fragment was cloned into TREtight-cDNA-EFS-rtTA-P2A-Puro.
Pooled CRISPR Screening and Data Analysis
The pooled TF DBD-focused negative selection screening was performed as described previously32,33. For the genetic bypass screening, Cas9-expressing A673 cells (Blasticidin resistant) were first infected with lentivirus of human GeCKO v2 library (Addgene, 1000000049, gRNA pooled library in LentiGuide-Puro) at low MOI (0.3~0.4) to ensure single sgRNA per cell. After puromycin selection, the cells were split into two groups and infected with either LRNeo-mU6-sgNEG or LRNeo-mU6-sgETV6 lentivirus at high MOI (>0.95). Three days post infection, cells were harvested as the reference time point (P0). The cells were kept with G418, and further cultured for 14 doublings for final time point (Pfinal). To maintain the representation of sgRNAs, the number of infected cells was kept at 1000 times the number of pooled sgRNAs in each condition throughout the screening. Genomic DNA extraction and sgRNA sequencing library construction were performed the same as previous studies32,33.
Xenograft Experiments
For in vivo experiments, Cas9 expressing A673 cells (puromycin resistant) were transduced with lentiviral sgRNA vectors LRG-blast2.1. Cells were pre-selected with Blasticidin for 48 hours before injection. 2×10⁶ cells were suspended in 100μL of 1:1 PBS/Matrigel (Corning, 356231) for each condition before subcutaneous injection into NSG mice(NOD.Cg-Prkdcscid Il2rgtm1Wjl/SzJ, male, 6 weeks, The Jackson Laboratory, 005557). Mice were monitored daily, and tumor size was measured by caliper twice weekly until the tumor in any group reached a maximal diameter of 2cm. Tumor volume was calculated as (length × width2)/2. Mice were either sacrificed at the endpoint, when tumors reached 20 mm or ulcerated (whichever came first). Experimental protocols involving mice were approved by the institutional animal care and use committees (IACUC) at Cold Spring Harbor Laboratory and were conducted in accordance with the National Institutes of Health Guide for the Care and Use of Laboratory Animals.
Immunofluorescent Staining
Cells grown on coverslips were washed briefly with PBS followed by fixation with 3% paraformaldehyde at room temperature for 10 minutes. Cells were permeabilized with 0.5% Triton X-100 in PBS (PBS-T) for 5 minutes at room temperature and then blocked with 10% normal goat serum (Thermo Fisher, 50062Z) for 1 hour. Primary antibodies with appropriate dilutions were added (anti-Collagen I, Ab34710, 1:500; anti-ETV6, Ab185816, 1:500; Alexa Fluor 488 conjugated anti-alpha smooth muscle actin (α-SMA), ab184675, 1:200) and incubated at 4oC overnight. Cells were then washed three times with PBST and probed with Alexa Fluor 488 or 568-conjugated secondary antibodies, if necessary, at room temperature for 1 hour. For cytoskeleton labeling, Alexa Fluor 647 Phalloidin (1:1000, Thermo Fisher, A22287) was added together with secondary antibodies. Cells were again washed 3 times with PBST and DNA was counterstained with DAPI (5 mg/ml, Thermo Fisher, D1306). Coverslips were mounted with ProLong Gold Antifade Mountant (Thermo Fisher, P36930). Images were collected at 40× magnification using a Leica TCS SP8 confocal and were processed with Leica LAS X software. Quantification of F-actin-stained area was analyzed by ImageJ software.
Freshly isolated tumor tissues were fixed in 4% of paraformaldehyde (PFA) at 4°C overnight, washed three times with PBS, and incubated in 30% sucrose in PBS overnight at 4°C. Tissue was mounted in OCT embedding compound and cut (10 µm) using a cryostat. For fluorescent staining on tumor sections, frozen sections were first washed in PBS and then incubated with 1× blocking buffer (5% goat serum, 2.5% bovine serum albumin in PBS) for 1 h followed by incubation in Fc receptor blocker (Innovex Biosciences, NB309) for 30 minutes. Sections were incubated with primary antibody (anti-Collagen I, Ab34710, 1:200, anti-PCNA, Cell signaling, #2586, 1:200, anti-Cleaved caspase 3, Cell signaling, #9579, 1:200) in 0.5× blocking buffer at 4°C overnight. After rinsing twice with PBS, tissue sections were incubated with secondary antibodies (goat anti-rabbit Alexa568 and goat anti-mouse Alexa647; 1:400 dilution; Life Technologies) for 2h at room temperature. Nuclei were counterstained with DAPI (1:1000 dilution; Life Technologies). Fluorescent images were collected at 40x magnification using a Leica TCS SP8 confocal microscope and were processed with Leica LAS X software. Quantification of PCNA and cleaved caspase3-expressing cells in tumor section was done by calculating PCNA and cleaved caspase3-positive cells divided by all DAPI cells using ImageJ (average of 5 mice). Quantification of the area of collagen staining was done by ImageJ (average of 5 mice).
Cell Cycle Analysis
BrdU incorporation assay was performed according to the manufacturer’s protocol (BD, FITC BrdU Flow Kit, 559619), with cells pulsed with 10 μM BrdU for 1 hour at 37 °C. Cells were then co-stained with 7-AAD for total DNA content and run on MACSQuant flow cytometer. Data was analyzed with FlowJo software (Version 10; BD Biosciences).
RNA Isolation and RT-qPCR Analysis
Total RNA was isolated using TRIzol (Thermo Fisher, 15596026) according to the manufacturer’s instructions. 2 μg of total RNA was reverse transcribed into cDNA using qScript cDNA SuperMix (QuantaBio, 95048), followed by qPCR analysis with SYBR green PCR master mix (Thermo Fisher, A25742) on a QuantStudio 7 Flex Real-Time PCR System. GAPDH was used as a referenc. Primers used for qPCR analysis were listed in Supplementary Table 2.
RNA-seq and Data Analysis
For RNA-seq analysis, total RNA was extracted as described above. 2 μg of total RNA was used to construct RNA-seq library using the Illumina TruSeq RNA library prep kit v2 (Illumina, RS-122–2001) following manufacturer’s instructions. Briefly, RNA was polyA enriched and enzymatically fragmented. cDNA was synthesized using Super Script II reverse transcriptase (Thermo Fisher, 18064014), followed by end repair, A-tailing, barcoded adaptor ligation and PCR amplification. The library was single end sequenced for 76bp using an Illumina NextSeq platform. Sequencing reads were mapped to reference genome hg38 using RNA STAR with default parameters62. Read count tables were created using FeatureCounts63 with a custom GTF file containing protein coding genes only. Differentially expressed genes were analyzed using DESeq2 with two independent replicates using default parameters64.
Chromatin Immunoprecipitation-Deep Sequencing (ChIP-seq) and Data Analysis
ChIP experiments were performed as described in previous study with minor modifications32. Briefly, 1.2×10⁸ cells (or 5×10⁶ cells for H3K27Ac ChIP) were cross-linked with 1% formaldehyde for 10 minutes, quenched with 125 mM glycine for 5 minutes at room temperature and washed twice with cold TBS. Pelleted cells were suspended in the lysis buffer (10 mM Tris, pH8.0, 10 mM NaCl, 0.2% NP-40 and protease inhibitor cocktail (Sigma, P8340)) and incubated on ice for 15 minutes. After centrifugation at 4000 rpm for 5 minutes, pellets were re-suspended in the nuclear lysis buffer (50 mM Tris, pH 8.0, 10 mM EDTA, 1% SDS, protease inhibitor cocktail). The lysates were then sonicated for 15 minutes (30 seconds on/ 30 seconds off) with a Bioruptor Pico sonication device (Diagenode, B01060010) and centrifuged at top speed for 10 minutes. Supernatants containing the chromatin were diluted 8 times with IP dilution buffer (20 mM Tris, pH 8.0, 2 mM EDTA, 150 mM NaCl, 1% Triton X-100, 0.01% SDS).
Sheep anti-rabbit IgG Dynabeads (Thermo Fisher, 11203D) were pre-coated by rocking with 5 μg of antibody (ETV6, Bethyl, A303–674A; FLI1, Abcam, ab15289; H3K27Ac, Abcam, Ab4729) in 0.5% BSA for 4 hours at 4°C. The bead-antibody complexes were added to the chromatin and incubated overnight at 4°C. The beads were then washed twice with ChIP buffer (50 mM Tris-HCl, pH8.0, 10 mM EDTA, 100 mM NaCl, 1% Triton X-100, 0.1% sodium deoxycholate), high salt buffer (ChIP buffer with 500 mM NaCl), LiCl buffer (10 mM Tris-HCl, pH8.0, 0.25 M LiCl, 0.5% NP-40, 0.5% sodium deoxycholate, 1 mM EDTA), and TE buffer. Bound chromatin was eluted and reverse-crosslinked at 65°C overnight. DNA was purified using MinElute PCR purification kit (Qiagen, 28004) after the treatment of RNase A and proteinase K.
The ChIP-seq library was constructed using Illumina TruSeq ChIP library prep kit (Illumina, IP-202–1012) according to the manufacturer’s instructions. Briefly, 50 μL ChIP DNA was first end-repaired, A-tailed and adaptor ligated to different barcodes. Agarose-gel purification was used to size-select (200 – 500 bp) adaptor-ligated ChIP-DNA, and followed by 15 cycles of PCR amplification. AMPure XP beads (Beckman Coulter, A63881) were used to cleanup amplified DNA. The quality of the ChIP-seq library was checked on Bioanalyzer using the High Sensitivity chip (Agilent, 5067–4626). Libraries were single end sequenced for 76bp using an Illumina NextSeq platform.
Raw reads from ChIP-seq were aligned to the reference genome hg38 using Bowtie265,66 with sensitive end-to-end setting. After removal of PCR duplication reads by SAMtools67, peaks were identified using MACS268,69, with the “narrow peak” option for TFs and the “broad peak” option for H3K27Ac. Genome-wide read coverage was calculated by deepTools70 with a bin size of 50 bp. Heatmap density plots and metagene plots were generated using ±2.5 kb around the peak center. To compare the peak intensity changes upon treatment, peaks from different conditions were first combined using BEDTools71, and all the possible peaks were centered ±2.5 kb around the peak summit to calculate the mean density changes. The AnnotatePeaks tool from HOMER72 was used to annotate peaks with a customized GTF file containing all the expressed genes, which were defined by at least 5 counts in either control or ETV6 knockout A673 cells.
CellTiter-Glo Assay
To test the cell proliferation rate upon induction of SAM domain in vitro, 2,000 cells were plated in each well of an opaque walled 96-well plate with or without doxycycline (1μg/mL). The viable cells were measured every 24 hours using CellTiter-Glo luminescent cell viability assay kit (Promega, G7572) with a SpectraMax plate reader (Molecular Devices) following the manufacturer’s instructions.
Competition-based Growth Assay
To measure the effect of sgRNA on cell fitness, Cas9-expressing cancer cell lines were transduced with the LRG2.1 sgRNA vector to achieve between 30% and 60% GFP-positive cells. The percentage of GFP-positive cells was first measured 3 days post lentiviral infection (P0), and then measured at each passage till passage 4 or 5, using a Guava Easycyte HT instrument (Millipore). The percentage of GFP positive cells at each time point was normalized to P0. In the experiment of assessing the effects of SAM domain induction to cell proliferation, the vector LentiV-cDNA-P2A-GFP vector was used to transduce the cells, followed by the same procedure described above.
Biotinylated DNA Pulldown
HEK293T cells were transfected with pcDNA3.1 FLAG-ETV6 or HA-EWS-FLI1 using PEI. 48 hours post transient expression, about 1×10⁷ cells were suspended in 1 mL of NETN buffer (20 mM Tris, pH7.5, 150 mM NaCl, 1 mM EDTA, 0.5% lgepal CA-630), incubated on ice for 15 minutes and dounced for 30 times using a tissue grinder (Sigma, D8938). After clarification by centrifugation at top speed for 10 minutes, equal amounts of HA-EWS-FLI1 containing cell lysates were mixed with increasing amounts of FLAG-ETV6 lysate as inputs.
The biotinylated DNA probes were generated by annealing a 5’ biotin-modified (IDT) forward strand to its unmodified reverse-complement oligonucleotide. For each pulldown reaction, 50 μL T1 streptavidin Dynabeads (Thermo Fisher, 65602) were washed once with 500 μL beads washing buffer (1 M NaCl, 0.02%Triton X-100, 1 mM EDTA, 10 mM Tris-Cl, pH 7.5), followed by one wash with 500 μL PBS. 5 pmol of annealed biotinylated DNA probe was bound to the streptavidin beads in 150 μL PBS by rotation for 1 hour at 4°C. Bead-immobilized DNA was then washed as above (once with beads washing buffer and once with PBS), with the final PBS removed. The DNA-bead complexes were added to the cell lysates and reactions were incubated with rotation at 4°C for 2 hours. The beads were washed using ice-cold buffers (two washes in NETN, followed by one wash in PBS), then re-suspended in 100 μL Laemmli sample buffer (BIO-RAD, 1610737) after removing thefinal PBS and boiled for 10 minutes.
Western Blotting
For cancer cell lines, cells were counted before lysis with the Laemmli sample buffer (BIO-RAD, 1610737) containing 2-mercaptoethanol. 1 million cells were suspended in 200 μL sample buffer after brief PBS washing and boiled for 10 minutes. For tumors, the samples were first homogenized in RIPA buffer (Thermo Fisher, 89901) with protease inhibitors. After incubating on ice for 15 min, the lysate was centrifuged for 10 minutes at top speed. The supernatants were then quantified using a BCA protein assay kit (Thermo Fisher, 23225), and adjusted to the same protein level. Equal volumes of samples were loaded on SDS-PAGE gel followed by transfer to nitrocellulose membrane and immunoblotting. Primary antibodies used in this study included ETV6 (Bethyl, A303–674A), FLI1 (Abcam, ab15289), SOX11 (Sigma, HPA000536), HRP-conjugated beta-ACTIN (Sigma, A3854), HA (Sigma, 12013819001), FLAG (Sigma, A8592).
Transwell migration and invasion assays
For the migration assay, Ewing sarcoma cells (A673, RH1 and TC71) were seeded (30,000 cells) in serum-free media onto 24-well cell culture insert membrane with 8.0 μm pores (Corning, CLS3422). The inserts were then placed in a 24-well plate of media supplemented with 10% FBS, and the cells were allowed to migrate for 24 hours. Non-migratory cells were scraped off the top chamber, and the migratory cells on the bottom surface were fixed using cold methanol and stained with crystal violet. Invasion assay was performed using Biocoat Matrigel transwell invasion chamber with 8.0 μm pores (Corning, 354481) in 6-well plate with 120, 000 cells seeded (performed as described above in the migration assay).
GGAA Motif Quantification
To quantify the GGAA composition in each EWS-FLI1 peak, a range of 500bp around the peak summit was used to extract the genomic DNA sequences (hg38). The number of (GGAA)n or (TTCC)n (n=1, 2~5, 6~10 and >10) in each 500bp range was counted with a custom Python script. The percentage of peaks with at least one (GGAA)n or (TTCC)n and the average number of (GGAA)n or (TTCC)n in each peak were compared between the Competitive (Log2FoldChange>2) and All EWS-FLI1 sites.
Molecular models
Molecular models were generated using PyMOL73. The SAM domain filament was assembled based on the structure of the wild-type TEL-SAM polymer (PDB: 1LKY)74. The complex of ETV6 with DNA is from PDB: 4MHG75.
Statistics
Error bars represent the mean plus or minus standard error of the mean, and n refers to the number of biological repeats. Statistical significance was evaluated by p value using GraphPad Prism software as indicated in the figure legends. For GGAA motif quantification, Fisher’s exact test was used to identify the difference in the proportion of (GGAA)n or (TTCC)n between the Competitive group and All group using R software (R Foundation for Statistical Computing, Vienna, Austria).
Extended Data
Extended Data Fig. 1 |. ETV6 is a dependency in Ewing sarcoma cell lines.
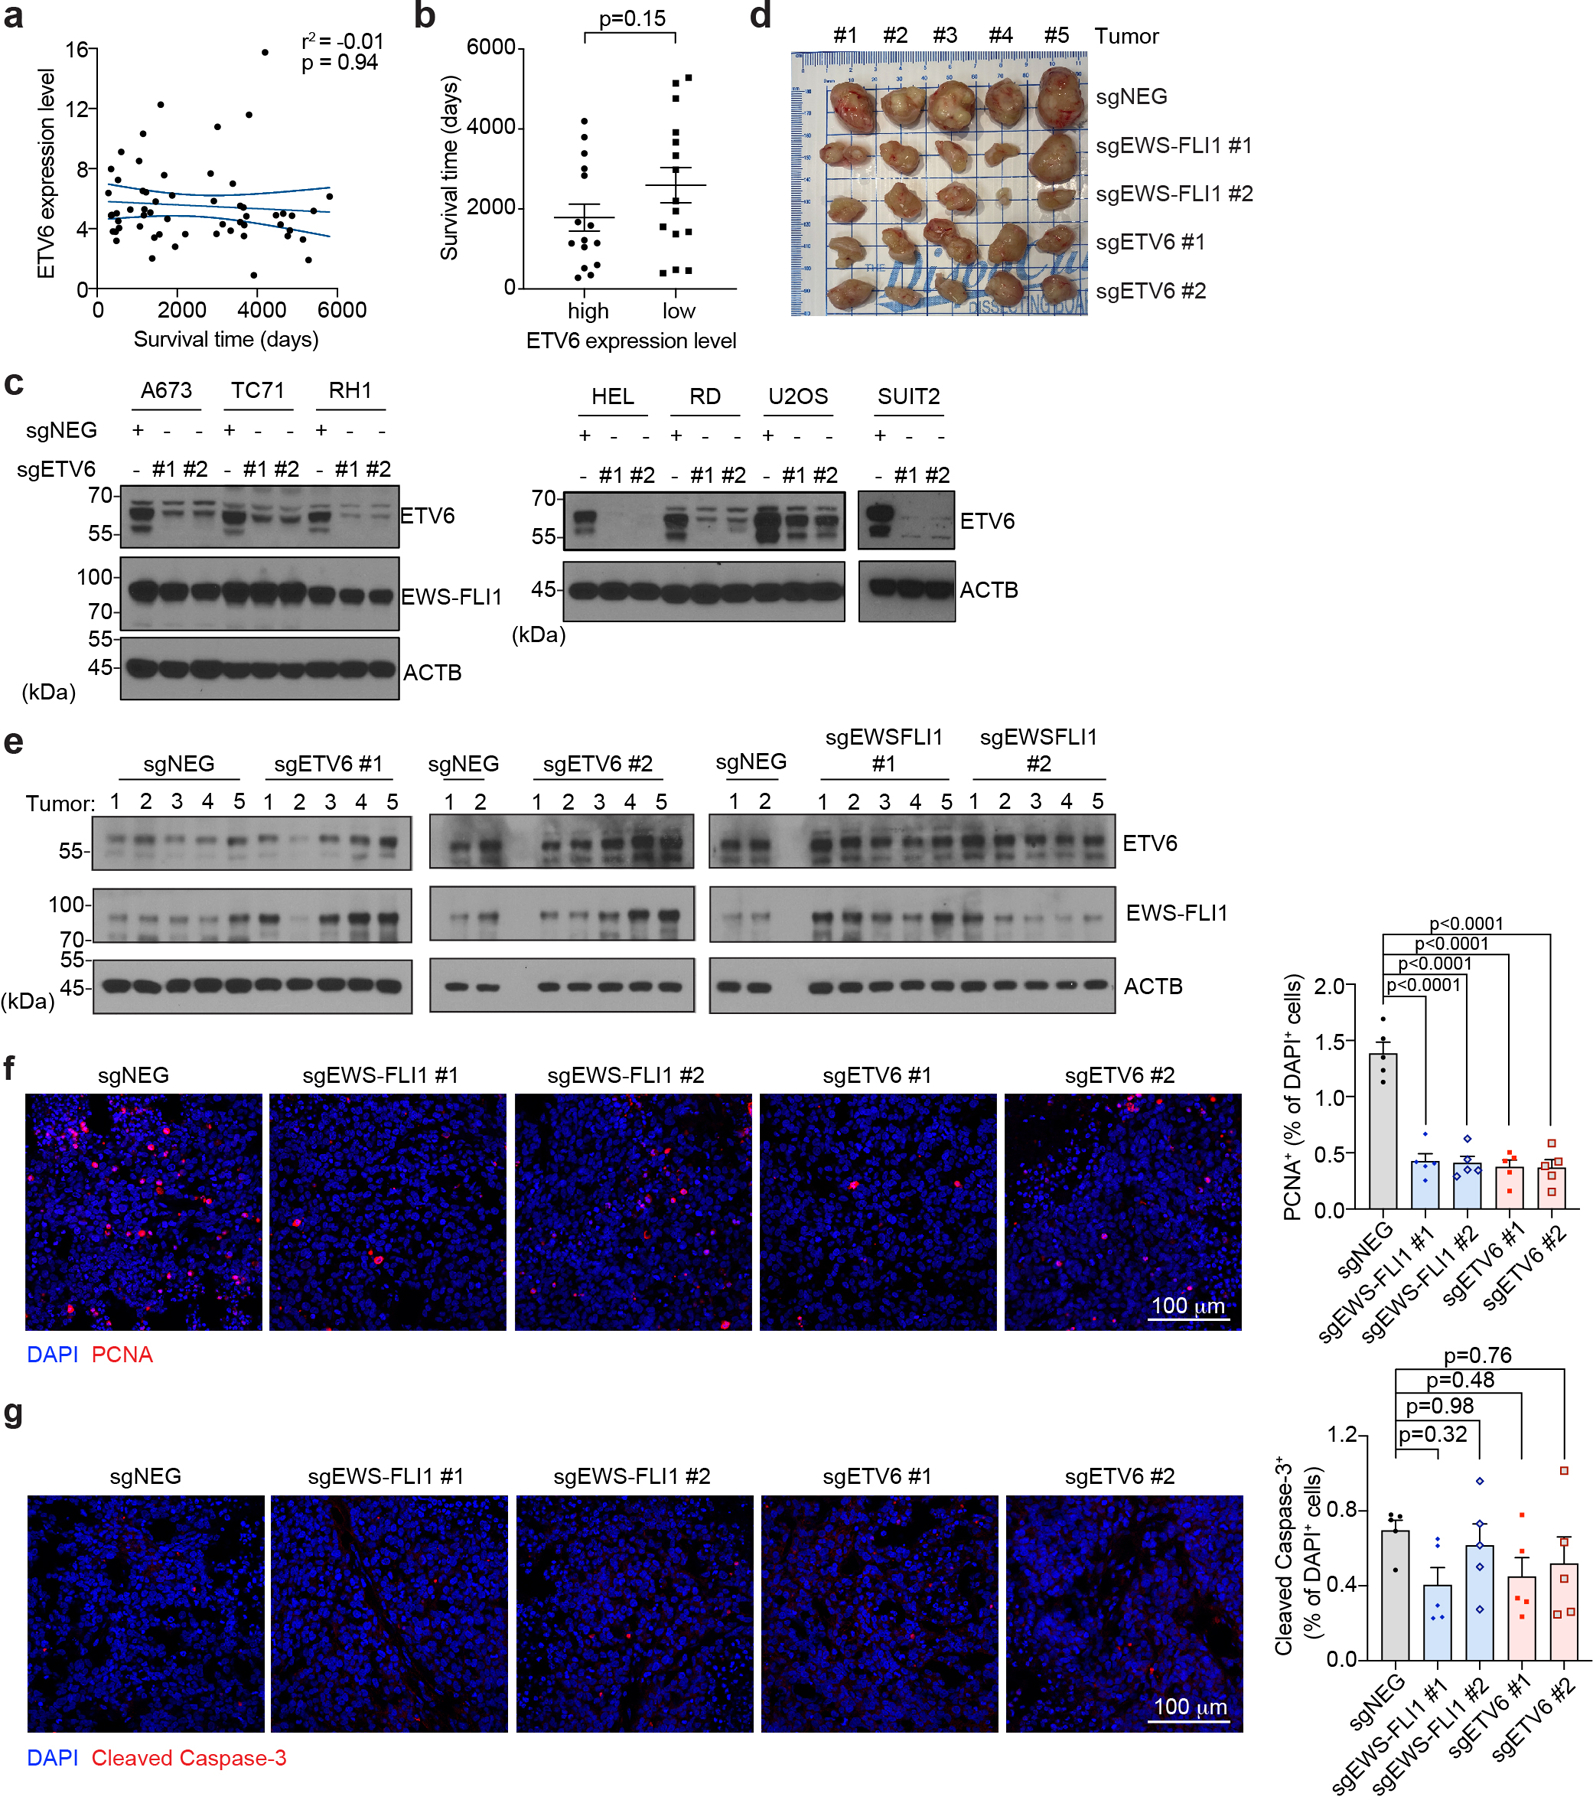
(a) Scatterplot showing the correlation between patient survival time and ETV6 expression level in primary tumours from the ICGC BOCA-FR dataset containing 57 Ewing sarcoma patients. Blue lines mark the mean with 95% confidence interval. (b) Comparison of patient survival time between ETV6-high (Top 25%, n = 15) and ETV6-low patients (Bottom 25%, n = 15). Data are mean ± SEM. P value was calculated using two-tailed unpaired Student’s t-test. (c) Western blot of ETV6 and EWS-FLI1 levels confirming the knockout of ETV6 in different cancer cell lines. Beta-ACTIN (ACTB) was used as a loading control. (d) Photographs of collected tumours at end time point. (e) Western blot indicates that the resulting tumours from A673 xenograft experiments maintain similar levels of ETV6 and EWS-FLI1. ACTB was used as a loading control. (f) Representative images of immunofluorescence staining for PCNA (red) in the resulting tumours from A673 xenograft experiments (left panel). Percentage of PCNA-positive over DAPIpositive cells was quantified in the right panel. Data are mean ± SEM. P values were calculated using one-way ANOVA, Tukey’s multiple comparison tests. (n = 5 tumours) (g) Representative images of immunofluorescence staining for Cleaved Caspase-3 (red) in the resulting tumours from A673 xenografts (left panel). Percentage of Cleaved Caspase-3 positive over DAPI stained cells was quantified in the right panel. Data are mean ± SEM. P values were calculated using one-way ANOVA, Tukey’s multiple comparison tests. (n = 5 tumours).
Extended Data Fig. 2 |. ETV6 knockout in Ewing sarcoma drives mesenchymal differentiation.
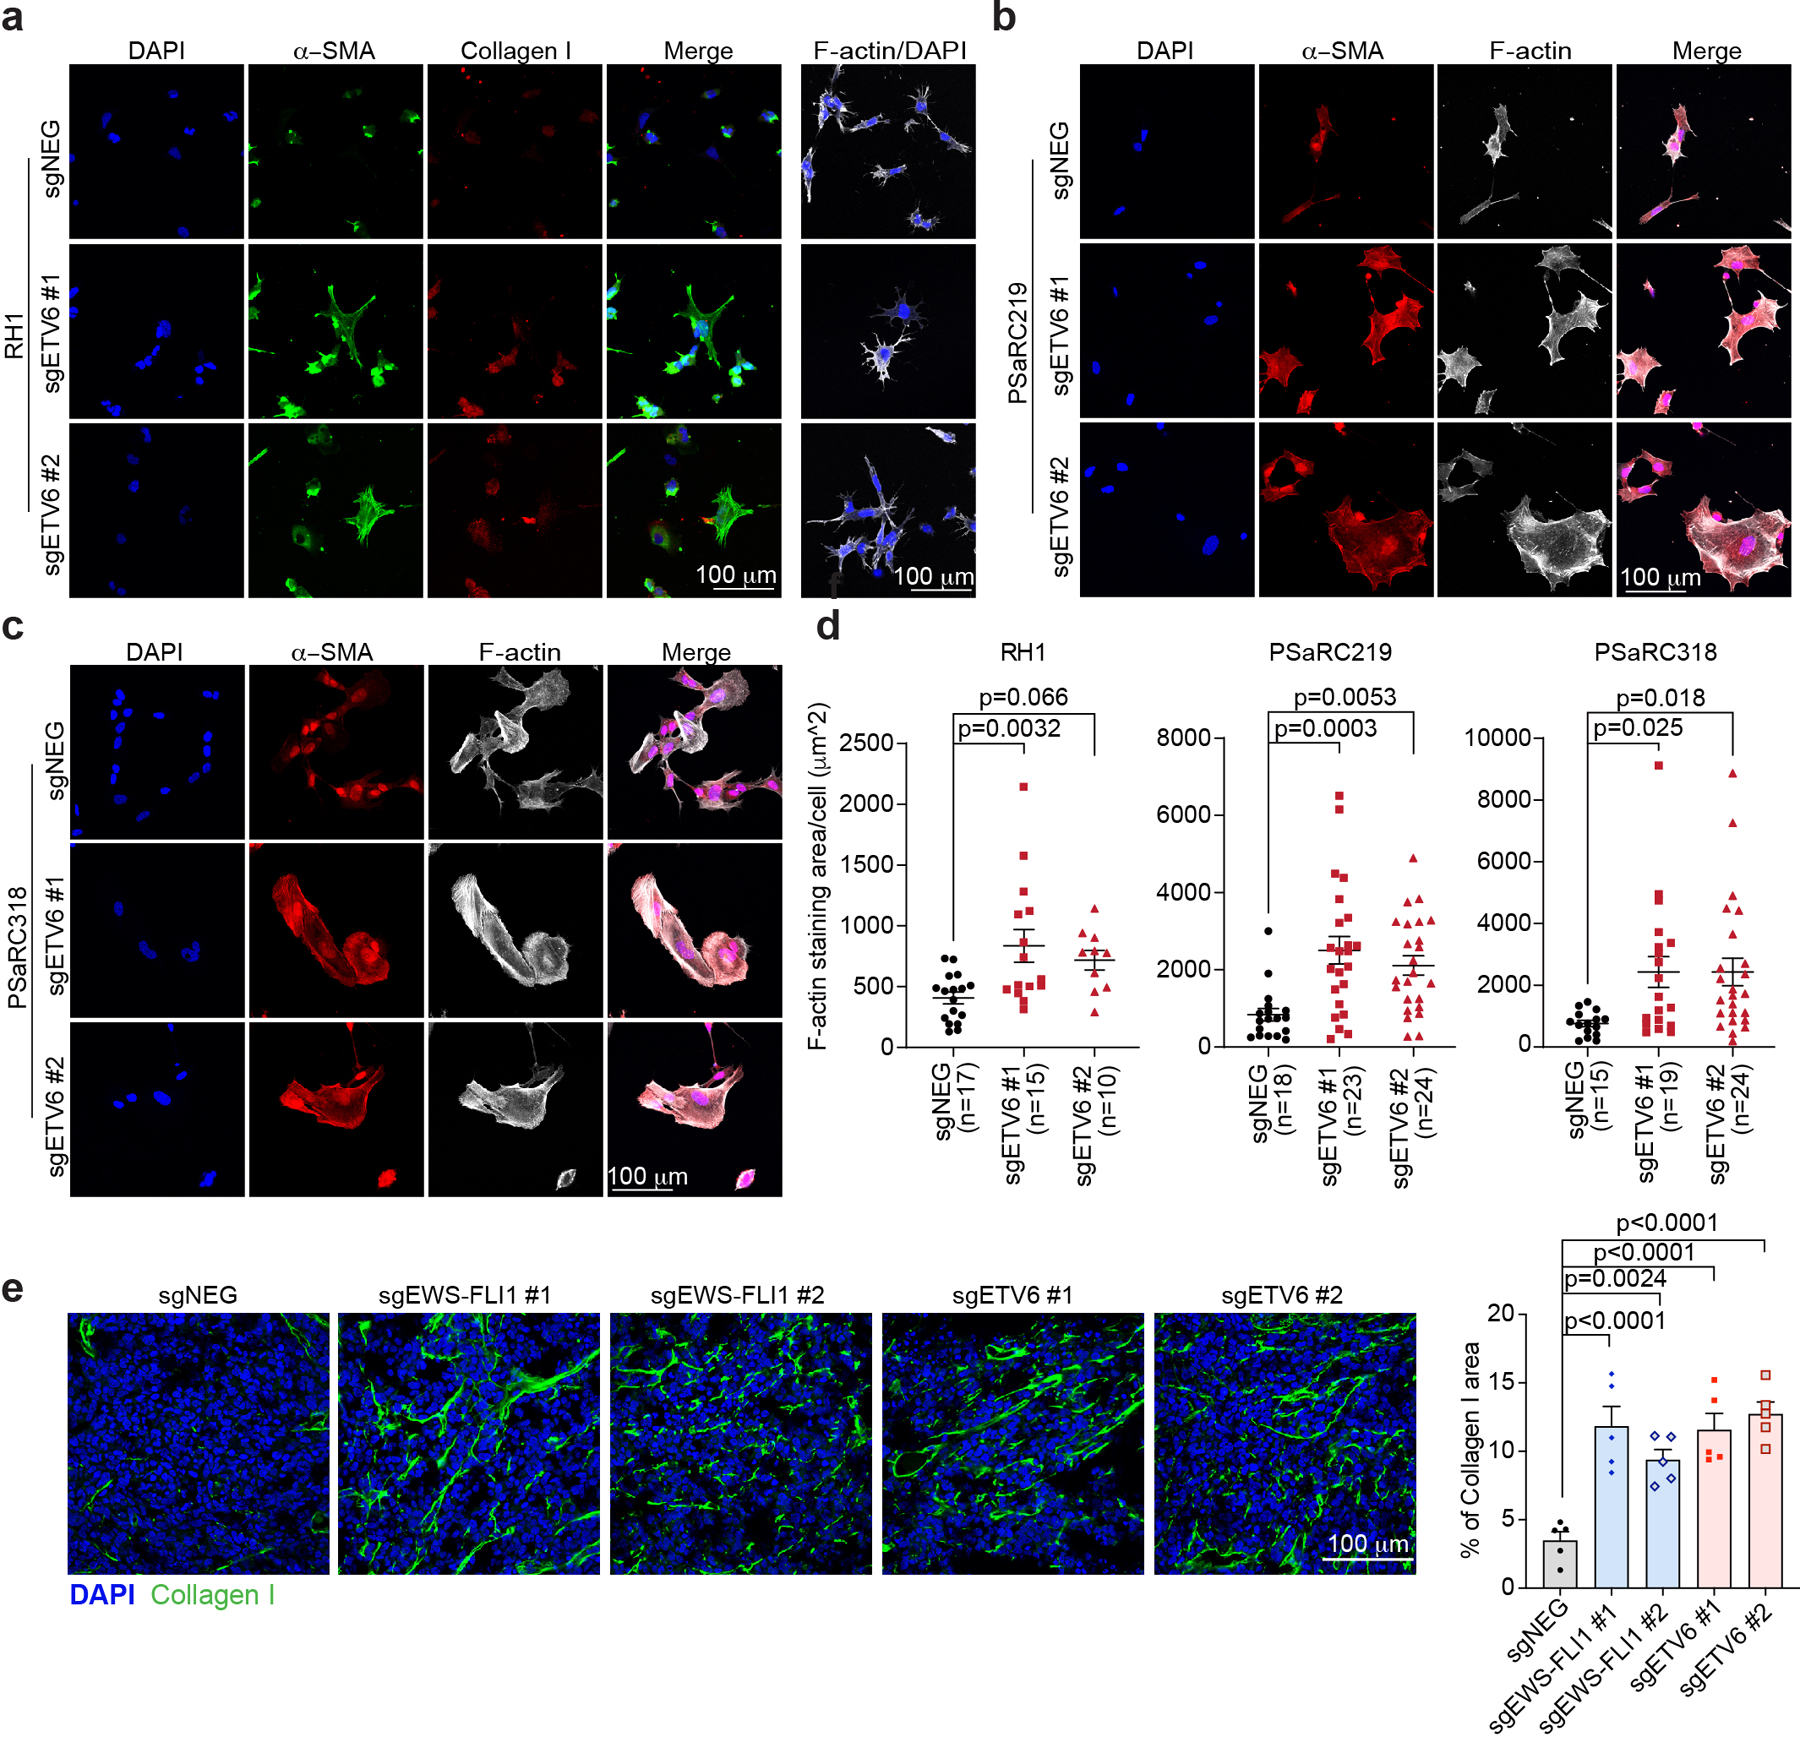
(a) Representative images of immunofluorescence staining for collagen I (red), alpha smooth muscle actin (α-SMA, green) and the cytoskeleton component F-actin (white) in RH1 cells infected with indicated sgRNAs. (b, c) Representative images of immunofluorescence staining for alpha smooth muscle actin (α-SMA, red) and the cytoskeleton component F-actin (white) in two independent patient-derived Ewing sarcoma tumour cells PSaRC219 (b) and PSaRC318 (c) infected with indicated sgRNAs. (d) Quantification of cell size based on F-actin staining (μm2 ) in RH1, PSaRC219 and PSaRC318 cells. Data are mean ± SEM. P values were calculated using one-way ANOVA, Dunnett’s multiple comparison tests. (e) Representative images of immunofluorescence staining for collagen I (green) in the resulting tumours from A673 xenografts (left). Percentage of Collagen I stained area was quantified (right). (n = 5 tumours) Data are mean ± SEM. P values were calculated using one-way ANOVA, Dunnett’s multiple comparison tests
Extended Data Fig. 3 |. ETV6 knockout up-regulates mesenchymal differentiation program in Ewing sarcoma cells, but not in non-Ewing cancer cell lines.
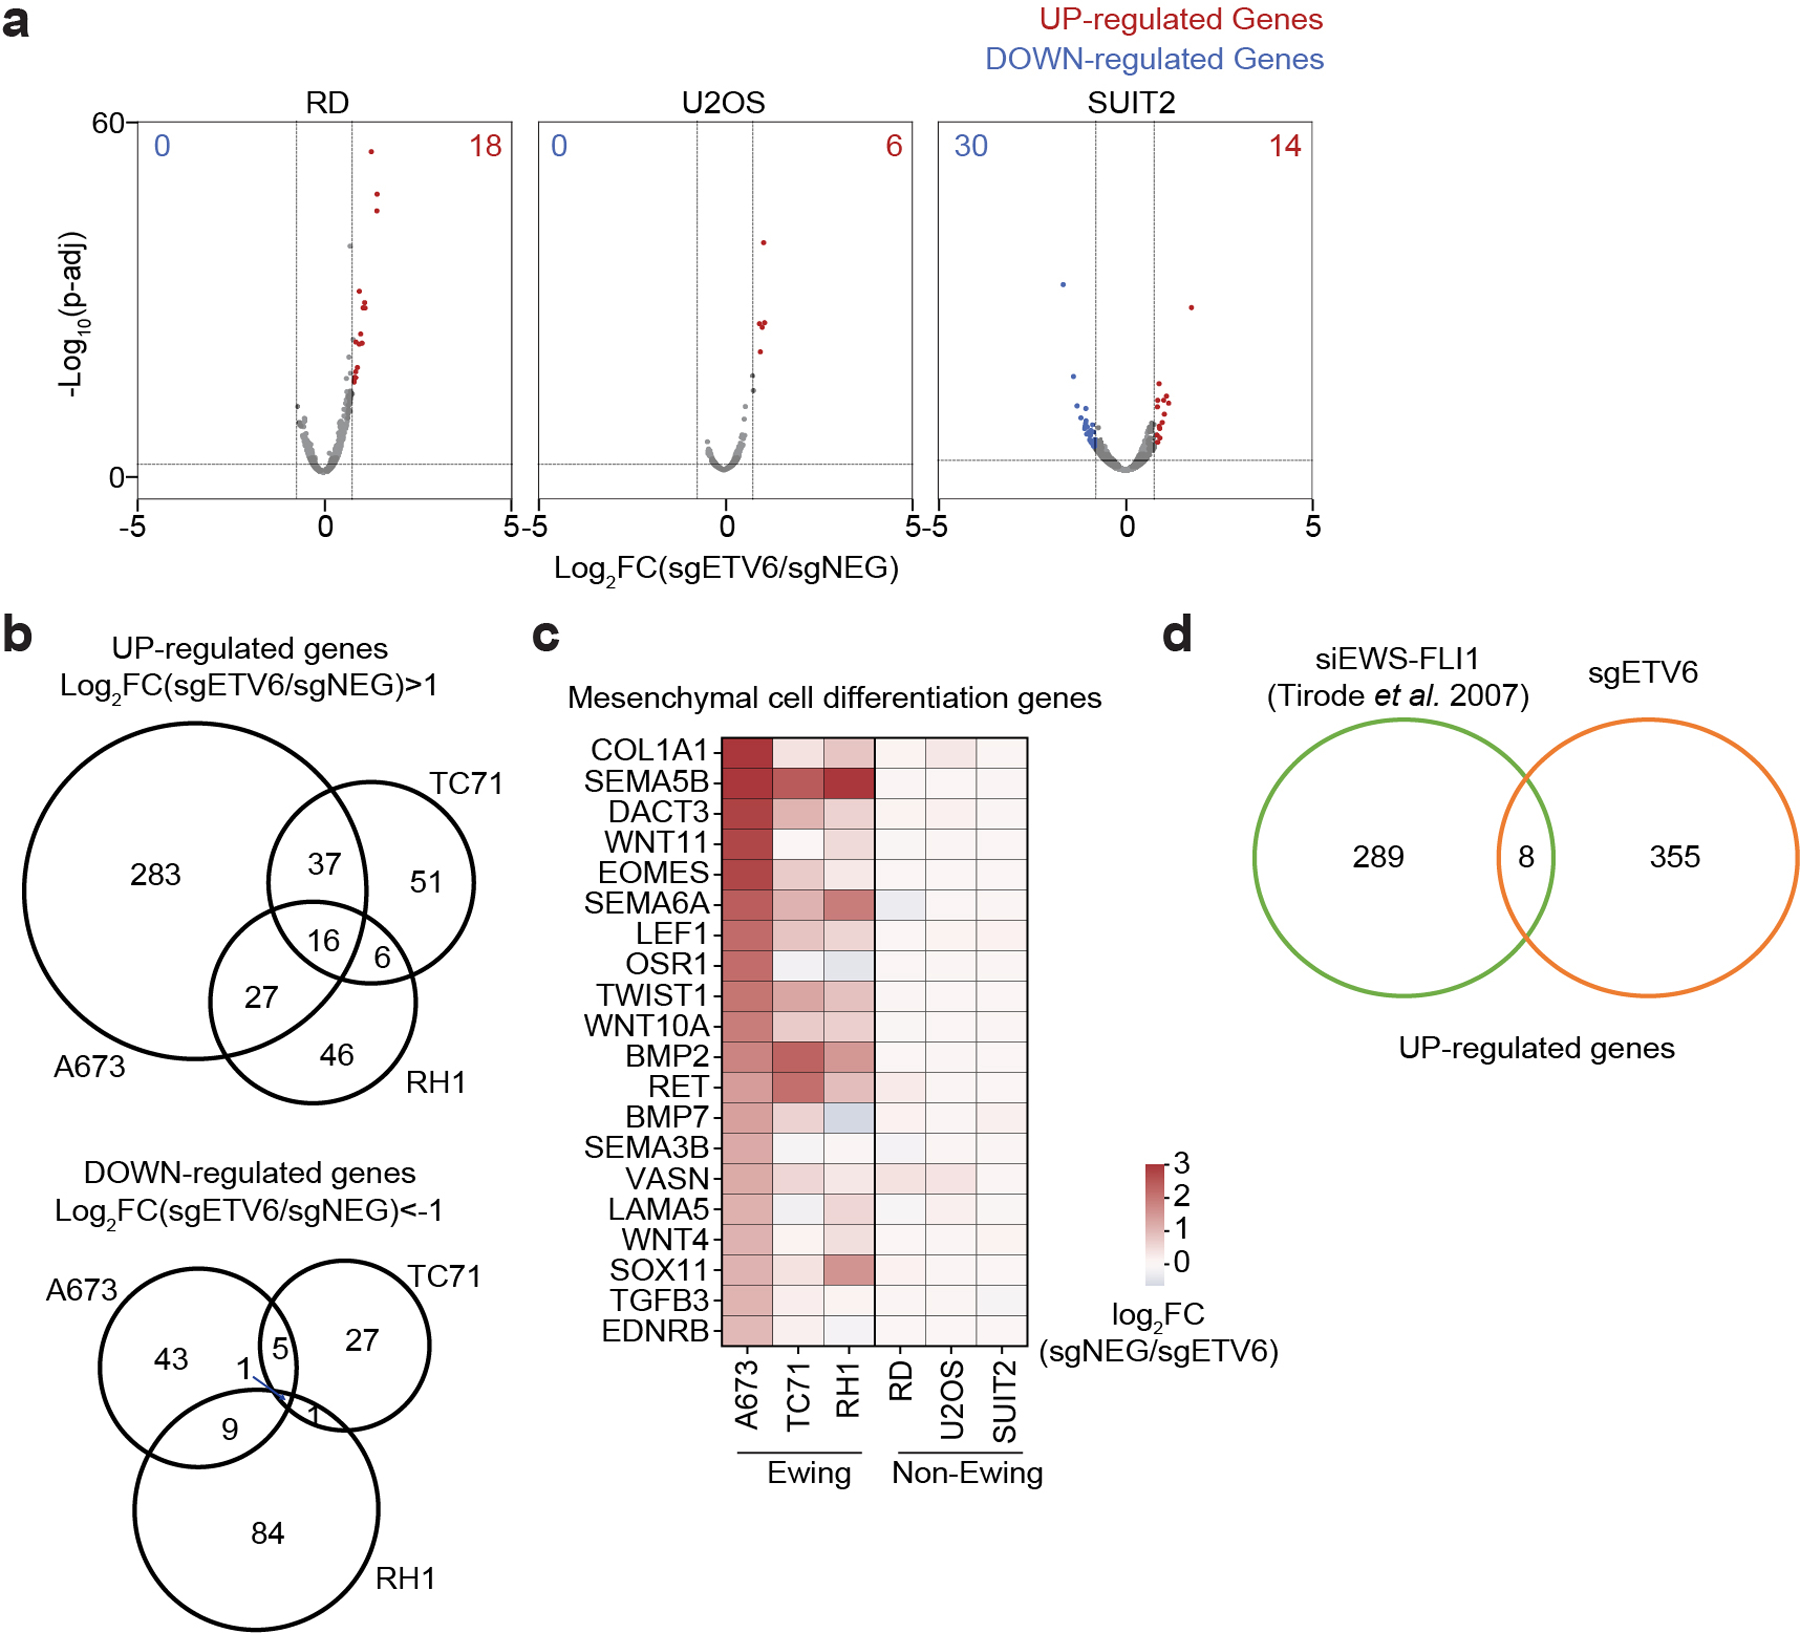
(a) Volcano plots showing the gene expression changes upon ETV6 knockout in 3 different non-Ewing cancer cell lines (RD, U2OS and SUIT2) assessed by RNA-seq. UP-regulated Genes (Log2FC > 0.5, p-adj 1) and down-regulated (Log2FC 1, P value 1, P value<0.01) from our study in A673 cells.
Extended Data Fig. 4 |. ETV6 knockout does not enhance Ewing sarcoma cell migration or invasion phenotype.
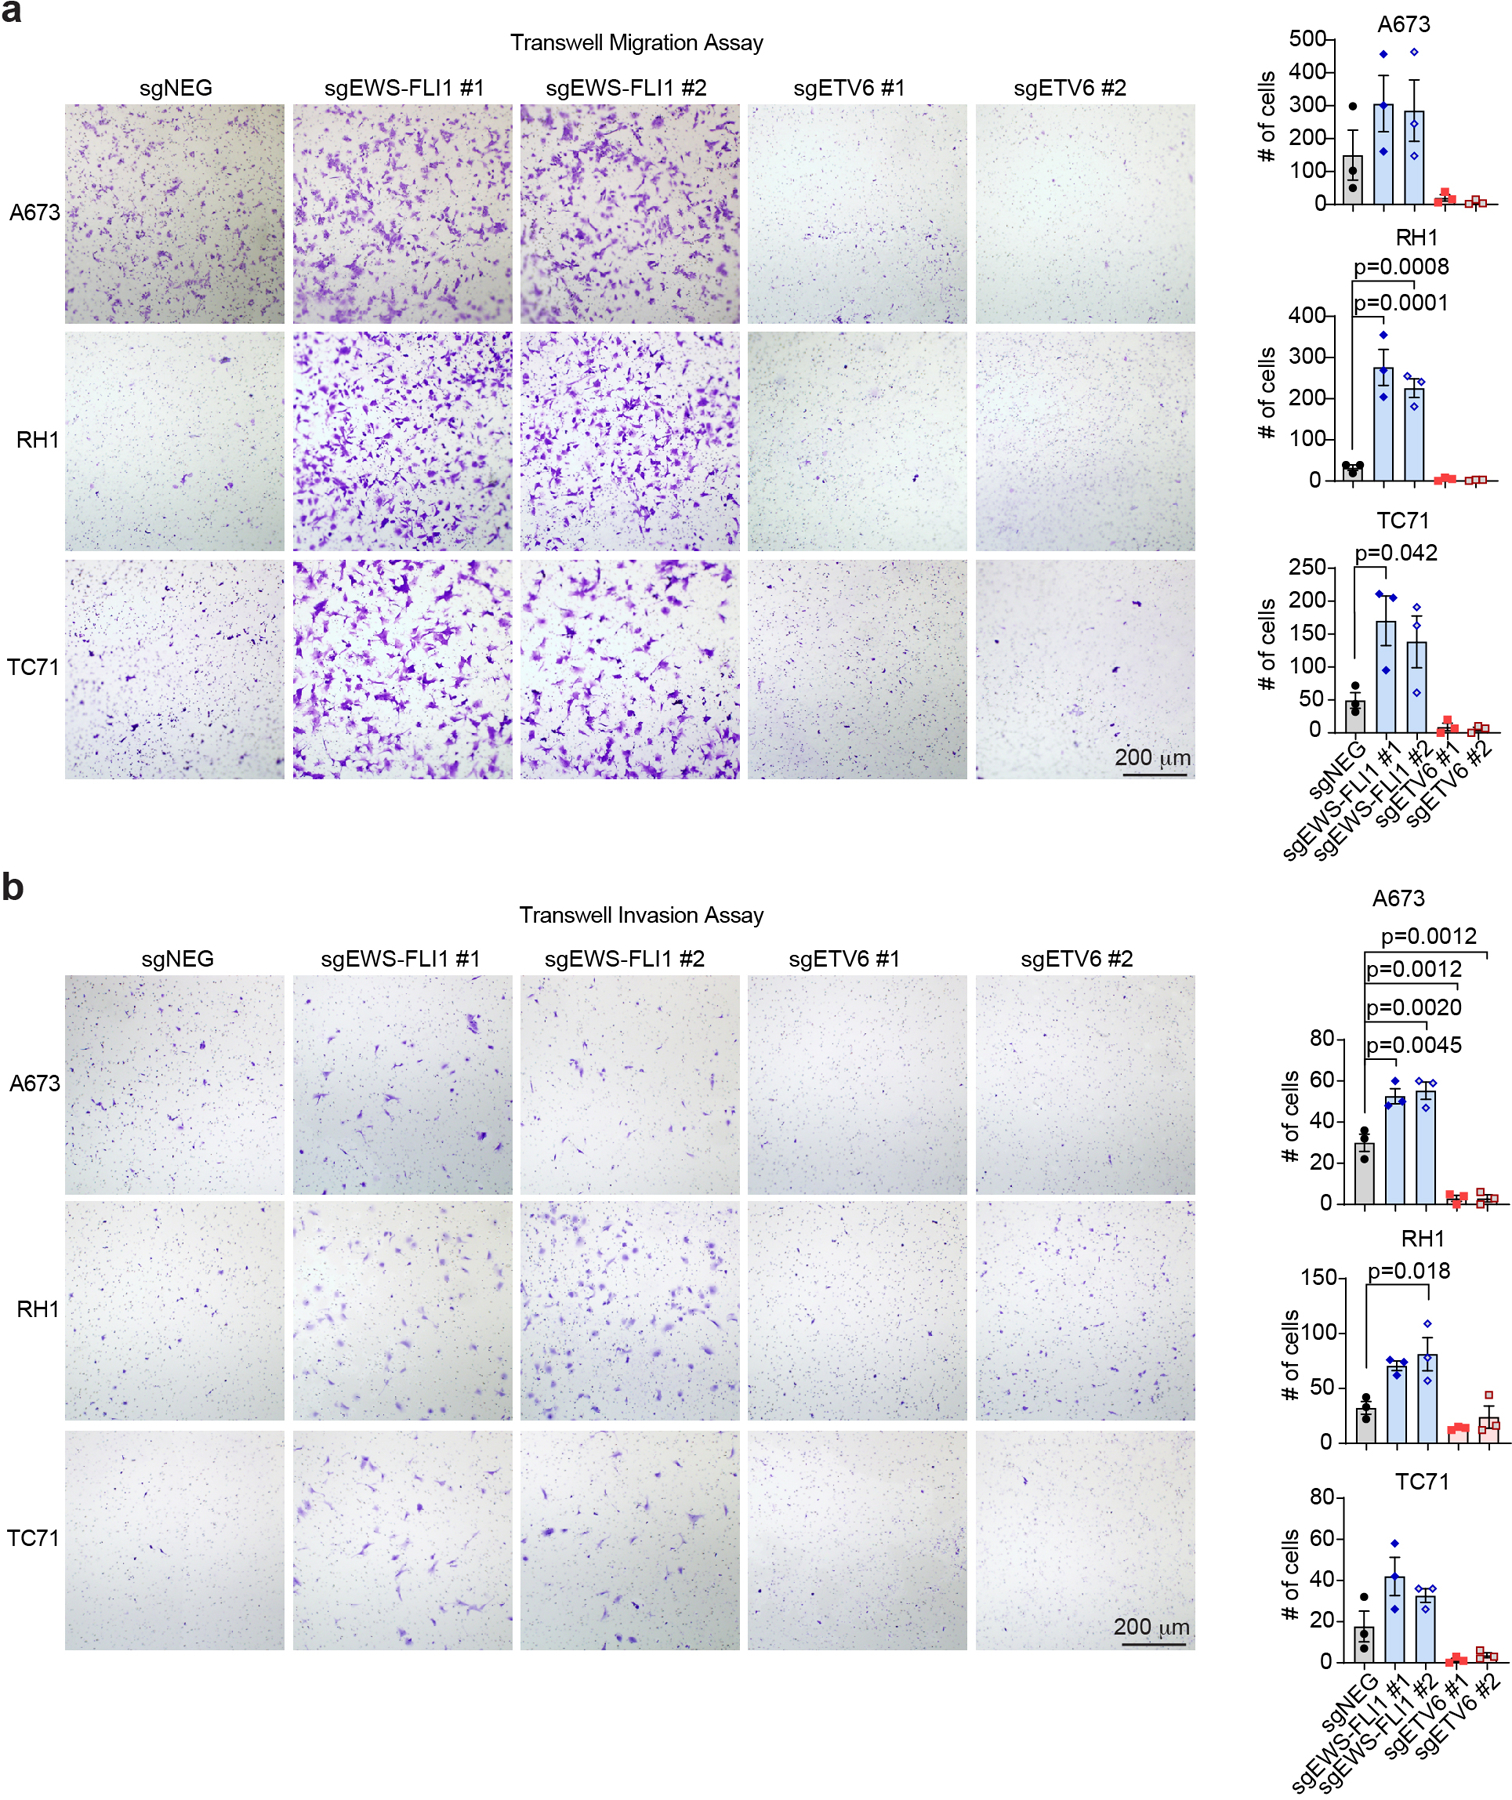
(a) Representative images of migrated cells toward a high serum environment after 24 hours seeded in serum-free media in three Ewing sarcoma cell lines (A673, RH1 and TC71) (left). Comparison of the cell counts that migrate through the pores. Data are mean ± SEM. P values were calculated using one-way ANOVA, Tukey’s multiple comparison tests. (n = 3 biological replicates) (b) Representative images (left) and quantification (right) of trans-well invasion assay measuring the number of cells invade through a Matrigel matrix (24 hours). Data are mean ± SEM. P values were calculated using one-way ANOVA, Tukey’s multiple comparison tests. (n = 3 biological replicates).
Extended Data Fig. 5 |. ETV6 represses a unique set of genes that contributes to the dependency in Ewing sarcoma cells.
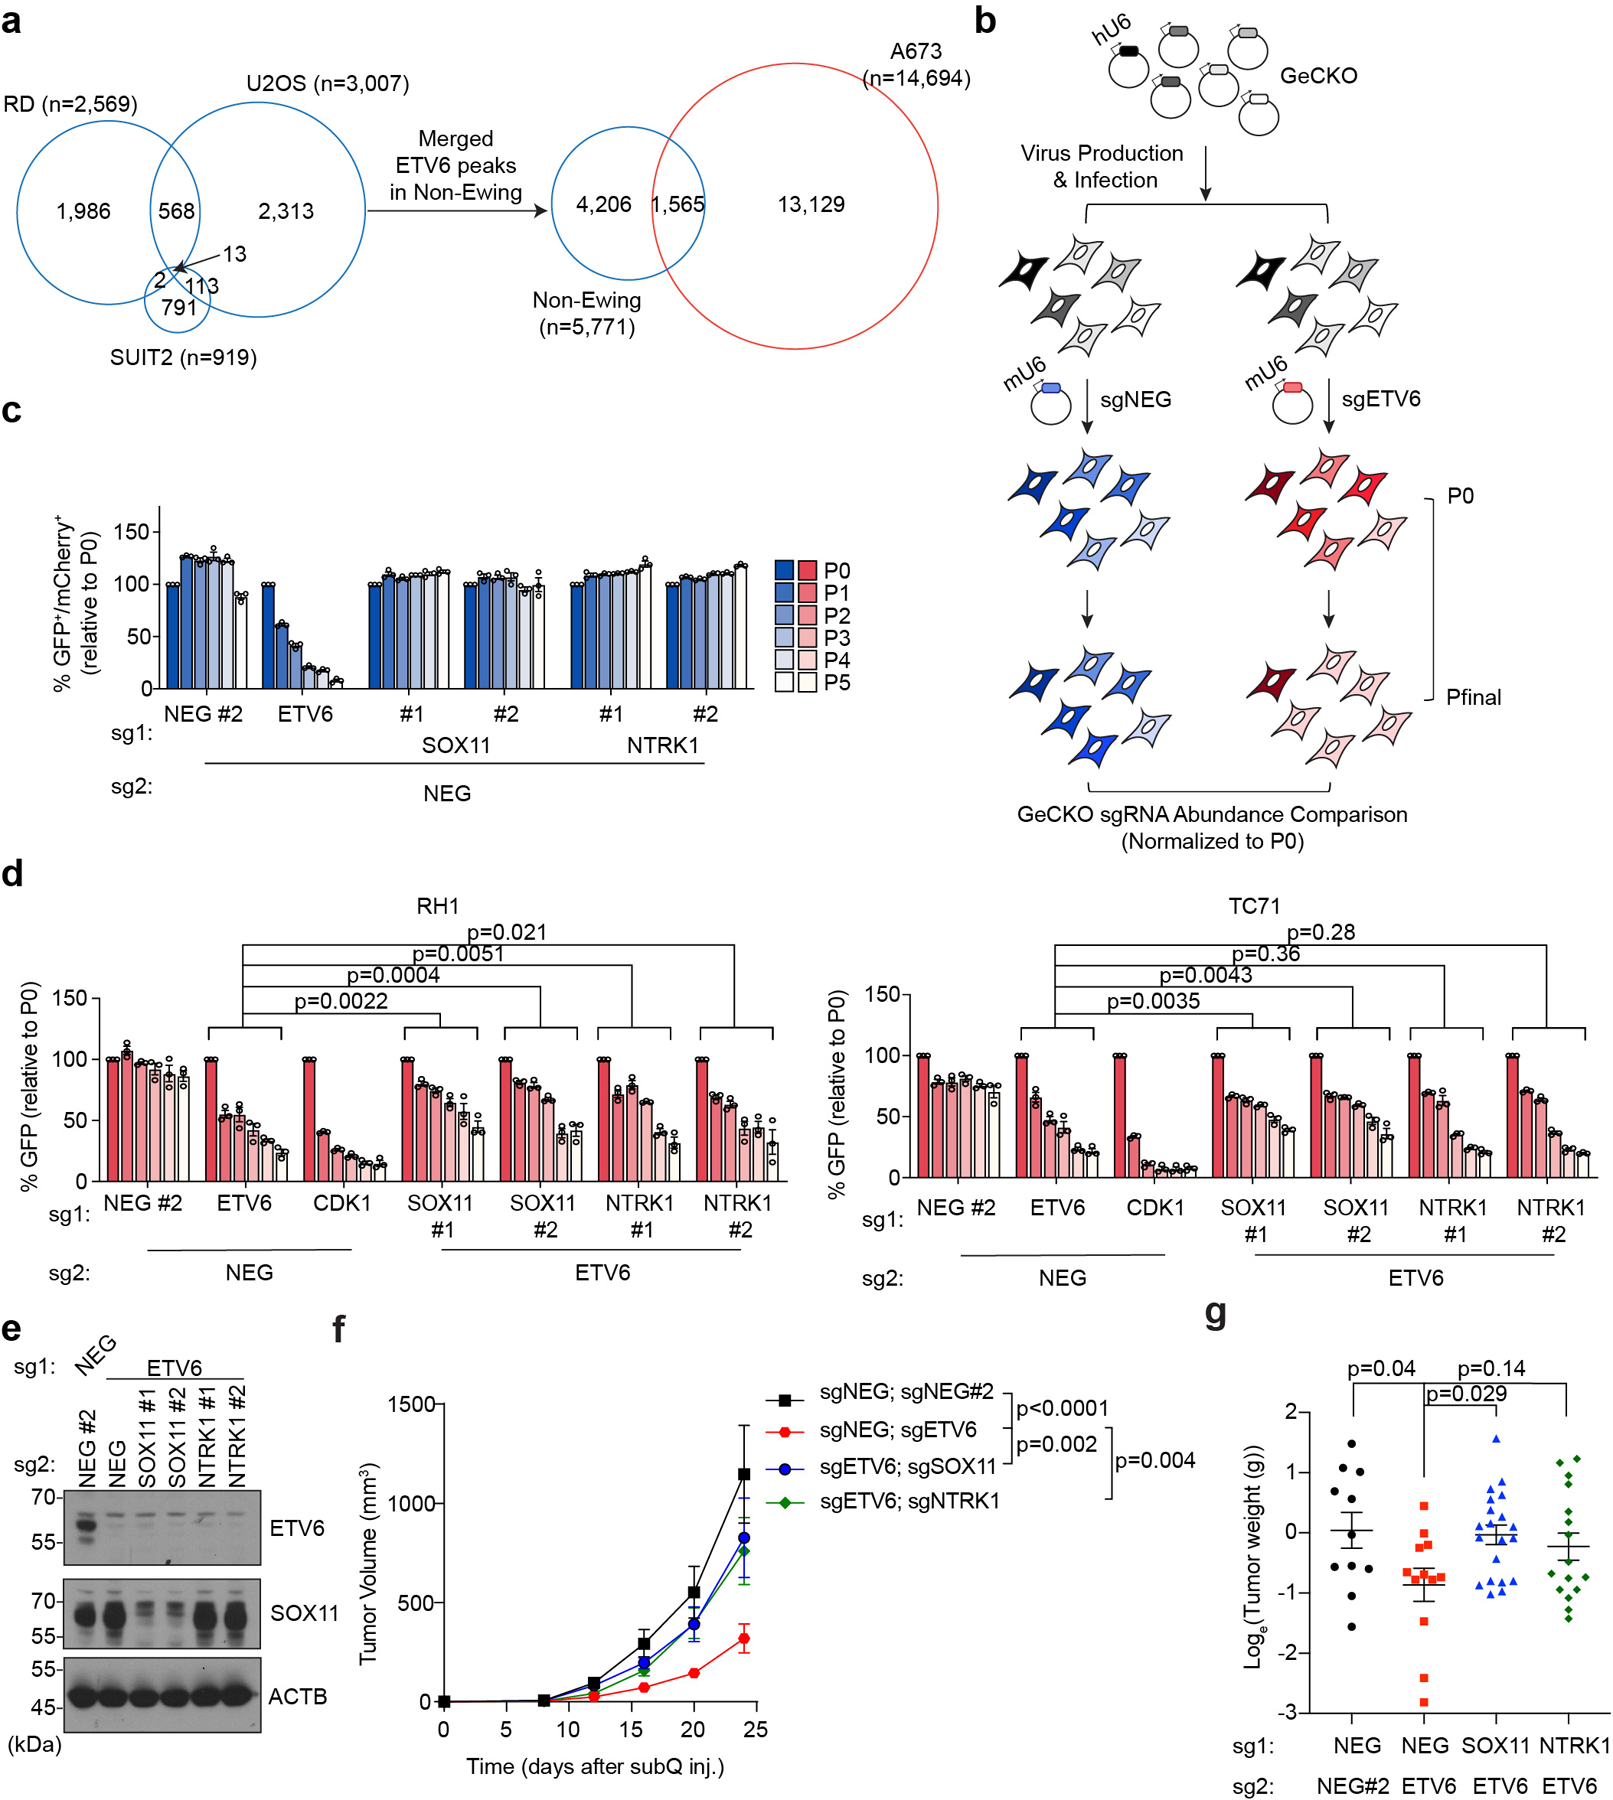
(a) Venn diagram showing the overlap of ETV6 ChIP-seq peaks between Ewing (A673) and non-Ewing cell lines. The ETV6 peaks in non-Ewing cells were annotated by merging ETV6 peaks from 3 different non-Ewing cancer cell lines. (b) The schematic diagram of genetic bypass screening. (c) Competition-based proliferation assay to validate the genetic bypass screening results using single sgRNAs. The sgNEG-mCherry control related to Fig. 3g. Data are mean ± SEM. (n = 3 biological replicates) (d) Competitionbased proliferation assay to validate the genetic bypass screening results in two additional Ewing sarcoma cell lines (TC71 and RH1). Cells were infected with a dual-sgRNA linked to a GFP reporter. The percentage of cells that are positive for GFP were monitored during culturing. Data are mean ± SEM. P values were calculated using two-way ANOVA. (n = 3 biological replicates) (e)Western blot confirming the knockout of ETV6 and SOX11 in A673 cells prior to subcutaneous injections. ACTB was used as a loading control. (f) Average growth curves of ETV6 or/and SOX11, NTRK1 knockout A673 xenografts in immunodeficient mice. Data are mean ± SEM. Linear mixed-effects model with sgRNA, time and sgRNA by time interaction as fixed effects and sample specific random intercept was used to fit the longitudinal tumour volume data. Differences in tumour volume were examined using simultaneous tests for general linear hypotheses of contrasts of interest. P values were adjusted for multiple comparisons using the BonferroniHolm method. (sgNEG;sgNEG#2 (n = 11), sgNEG;sgETV6 (n = 12), sgETV6;sgSOX11 (n = 20), sgETV6;sgNTRK1 (n = 16)). (g) Weight of the resected tumours at the end point. Data are mean ± SEM. Log-transformed tumour weight in different groups were compared using Welch’s ANOVA test followed by Dunnett’s T3 multiple-comparison tests. (sgNEG;sgNEG#2 (n = 11), sgNEG;sgETV6 (n = 12), sgETV6;sgSOX11 (n = 20), sgETV6;sgNTRK1 (n = 16)).
Extended Data Fig. 6 |. Activation of ETV6 target genes specifically impairs Ewing sarcoma cell growth.
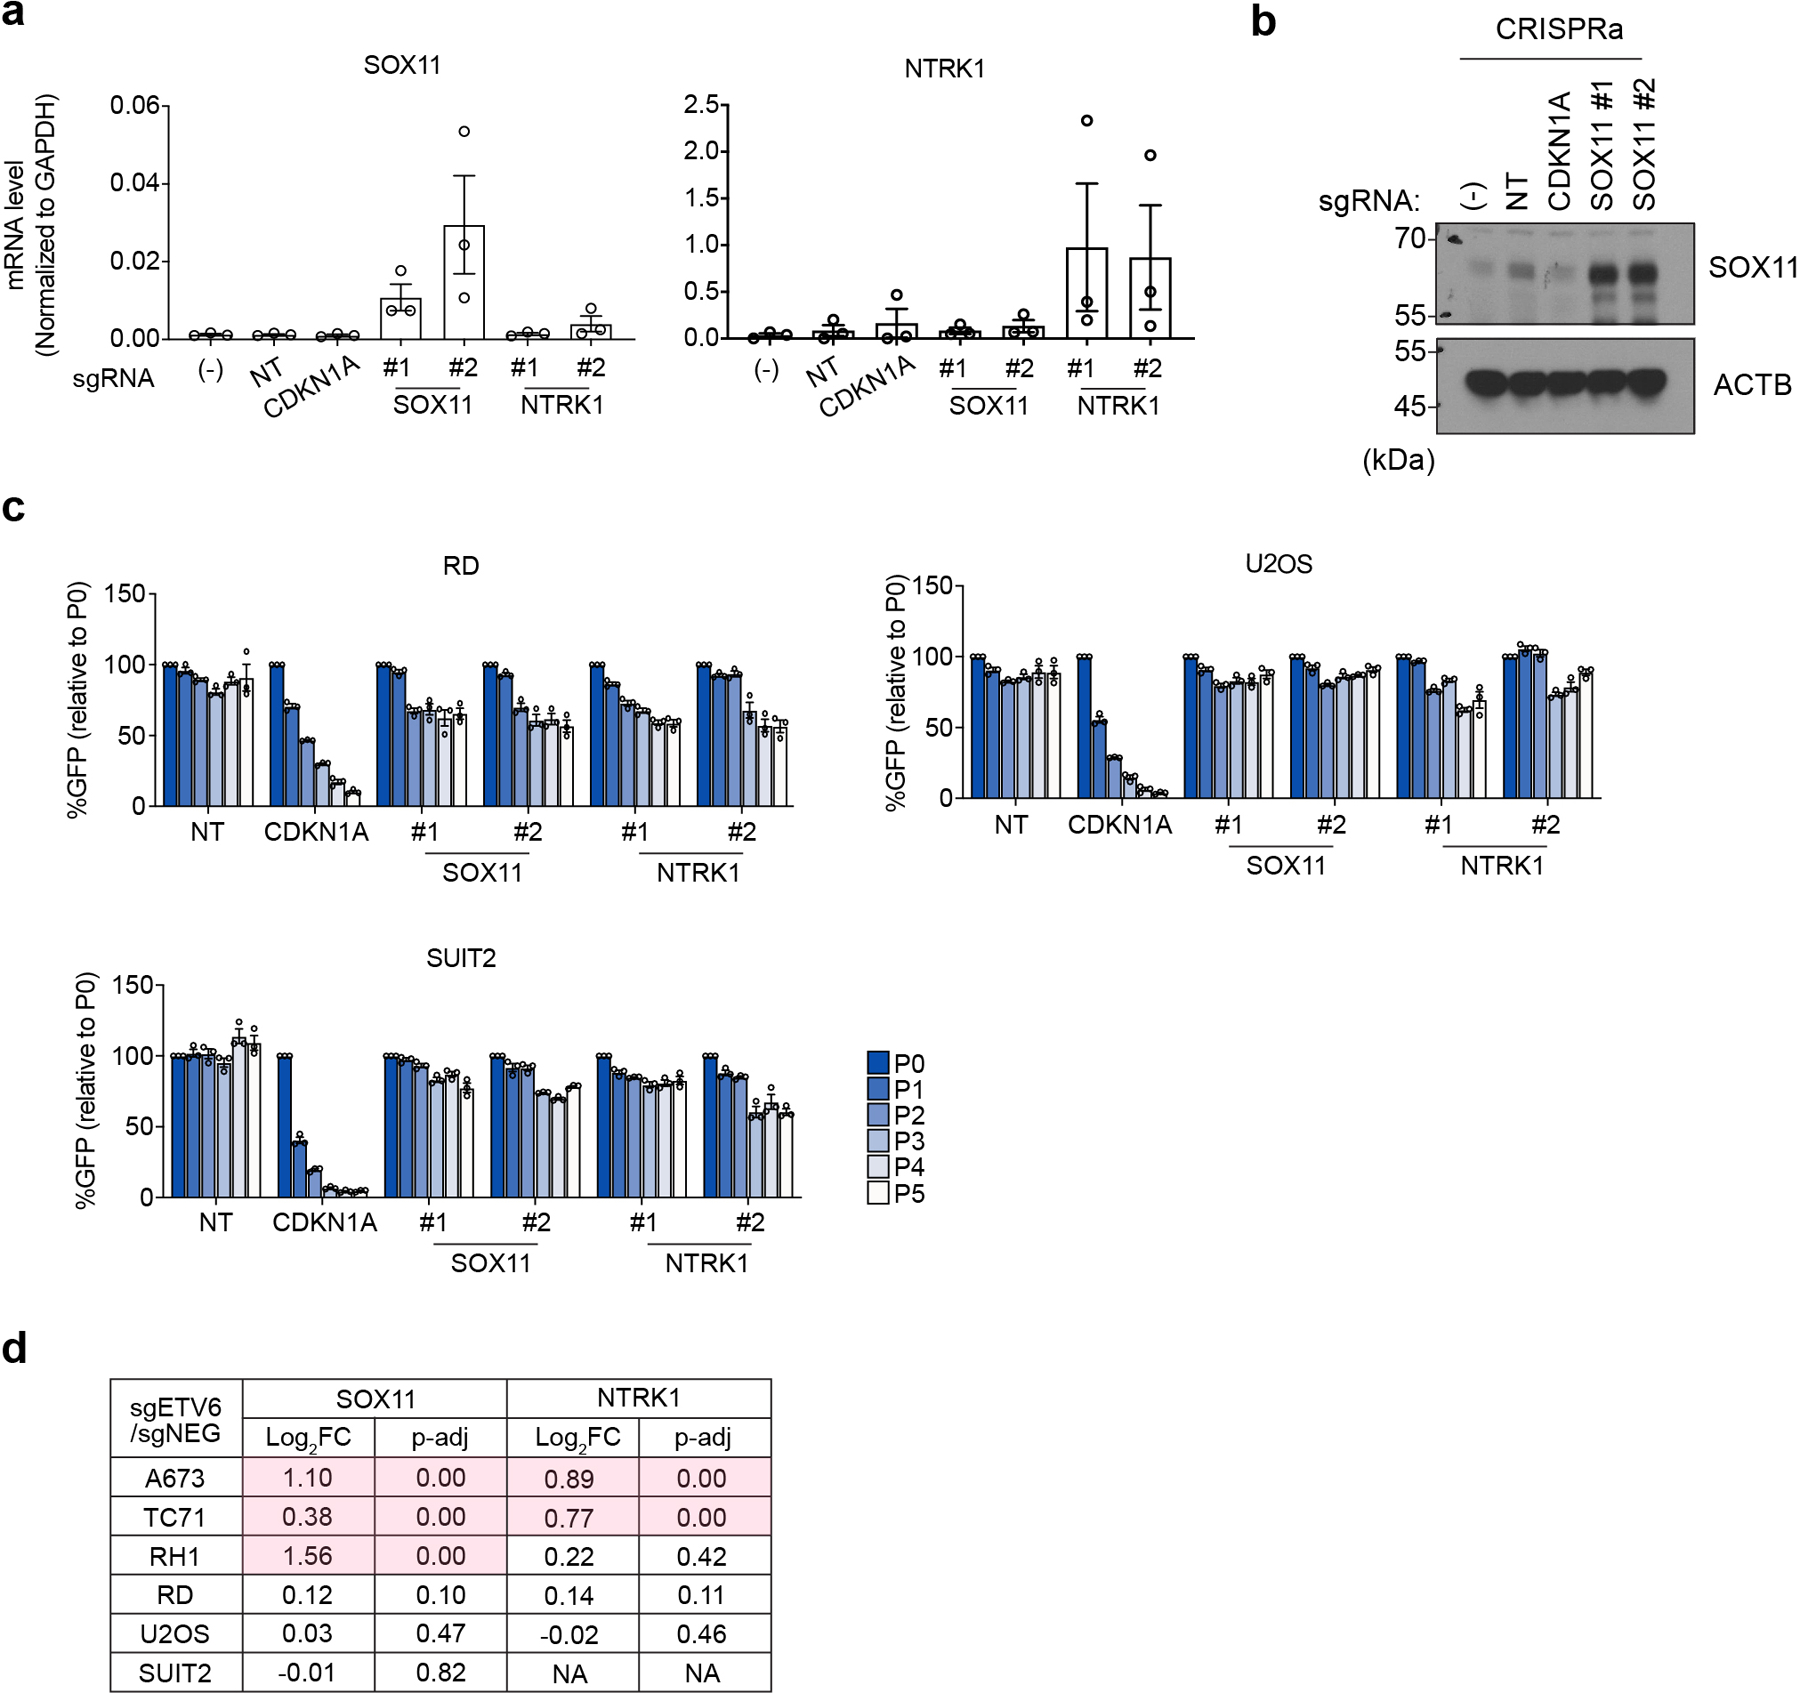
(a) RT-PCR analysis of SOX11 and NTRK1 levels in the CRISPR activation experiments. (−), no virus infection control. NT, non-targeting sgRNA control. Data are mean ± SEM. (n = 3 biological replicates) (b) Western blot confirming the elevation of SOX11 level upon CRISPR activation. ACTB was used as a loading control. (c) Competition-based proliferation assay evaluating the effects of candidate gene activation, using CRISPR activation (CRISPRa), to cell fitness in non-Ewing cancer cell lines (RD, U2OS and SUIT2). The percentage of GFP positive cells was monitored during culturing. Data are mean ± SEM. (n = 3 biological replicates) (d) Gene expression changes of SOX11 and NTRK1 in different cell lines assessed by RNA-seq. The significant expression changes (p
Extended Data Fig. 7 |. ETV6 antagonizes EWS-FLI1 function at select DNA elements.
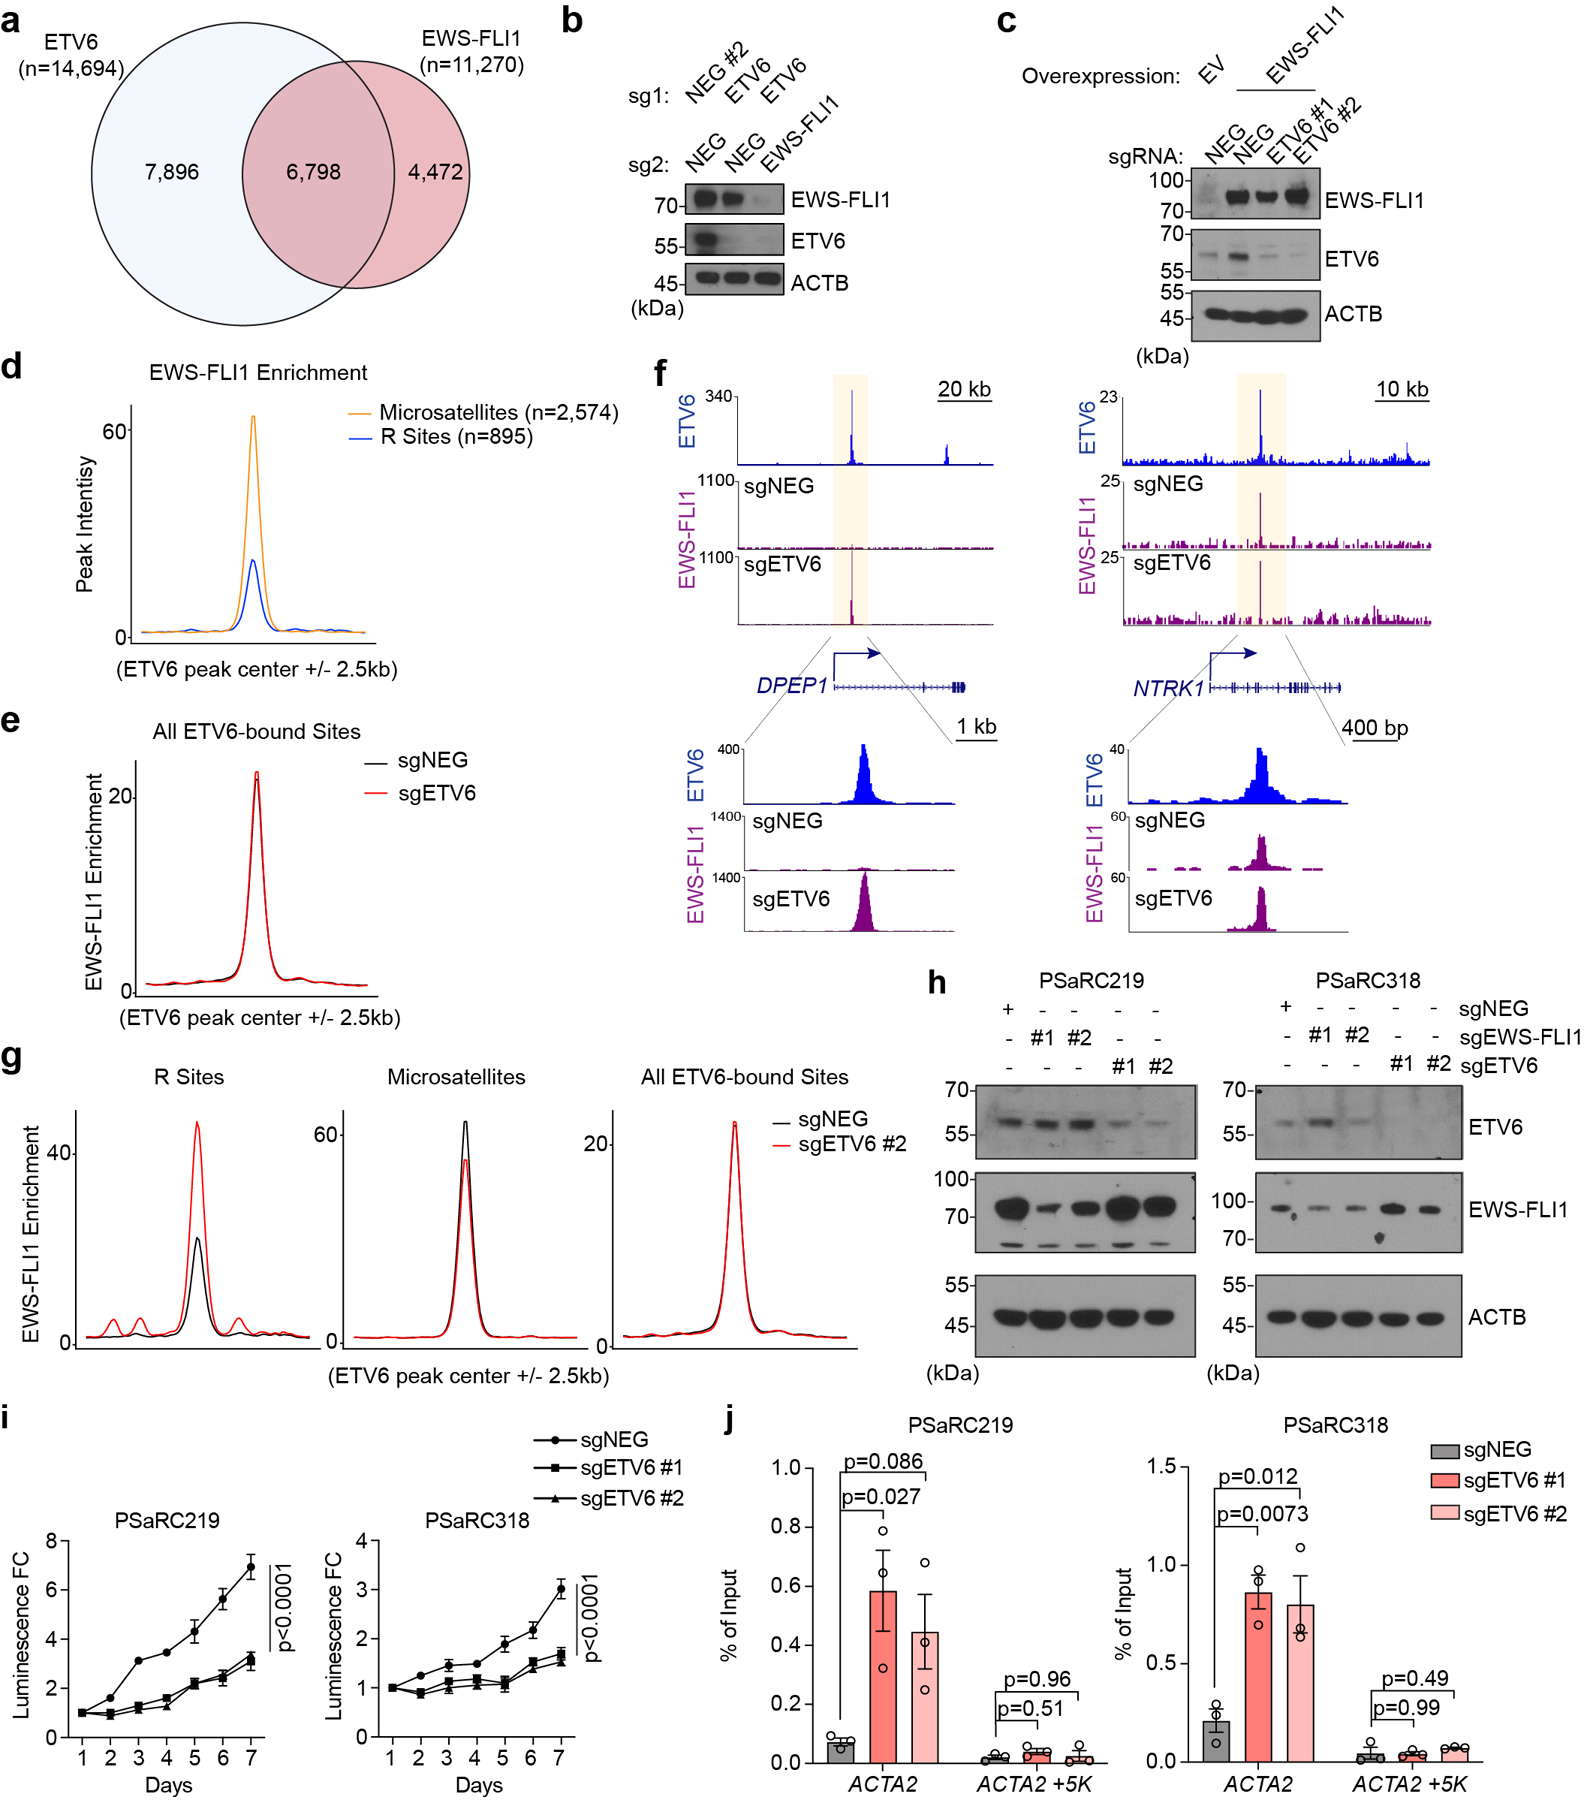
(a) Venn diagram showing the overlap between ETV6 and EWS-FLI1 peaks in A673 cells. (b)Western blot assessing EWS-FLI1 and ETV6 levels in A673 cells transduced with indicated dual-sgRNA constructs. (c)Western blot of EWSFLI1 and ETV6 in EWS-FLI1 reprogrammed RD cells. RD cells were transduced with EV (empty vector) control or EWS-FLI1 linked to indicated sgRNAs. (d) Metagene representation of the mean EWS-FLI1 signal differences at R sites versus microsatellites. (e) Metagene representation of the mean EWS-FLI1 signal differences at all ETV6 binding sites in A673 cells upon targeting ETV6. (f) Gene tracks of ETV6 and EWS-FLI1 ChIP-seq occupancy upon ETV6 knockout at DPEP1 and NTRK1 sites at two different scales. (g) Metagene representation of mean EWS-FLI1 ChIP-seq signal changes across R sites, microsatellites and all ETV6 binding regions in A673 cells upon targeting ETV6 using sgETV6 #2. (h) Western blot of ETV6 and EWS-FLI1 levels in patient-derived tumour cells (PSaRC219, left; PSaRC318, right) infected with indicated sgRNAs. ACTB was used as a loading control. (i) CellTiter Glo assay evaluating the effects of ETV6 knockout to proliferation in the patient-derived tumour cells (PSaRC219, left; PSaRC318, right). The relative luminescence fold changes (FC) to day 1 were plotted. Data are mean ± SEM. P values were calculated using two-way ANOVA. (n = 4 biological replicates) (j) EWS-FLI1 ChIP-qPCR analysis assessing the EWS-FLI1 occupancy changes at the ACTA2 site in the patient-derived Ewing tumour cells (PSaRC219 and PSaRC318) upon ETV6 knockout. A site 5 kb downstream of the ACTA2 site was used as a negative control. Data are mean ± SEM. P values were calculated using one-way ANOVA, Dunnett’s multiple comparison tests. (n = 3 biological replicates).
Extended Data Fig. 8 |. EWS-FLI1 does not bind to ETV6.
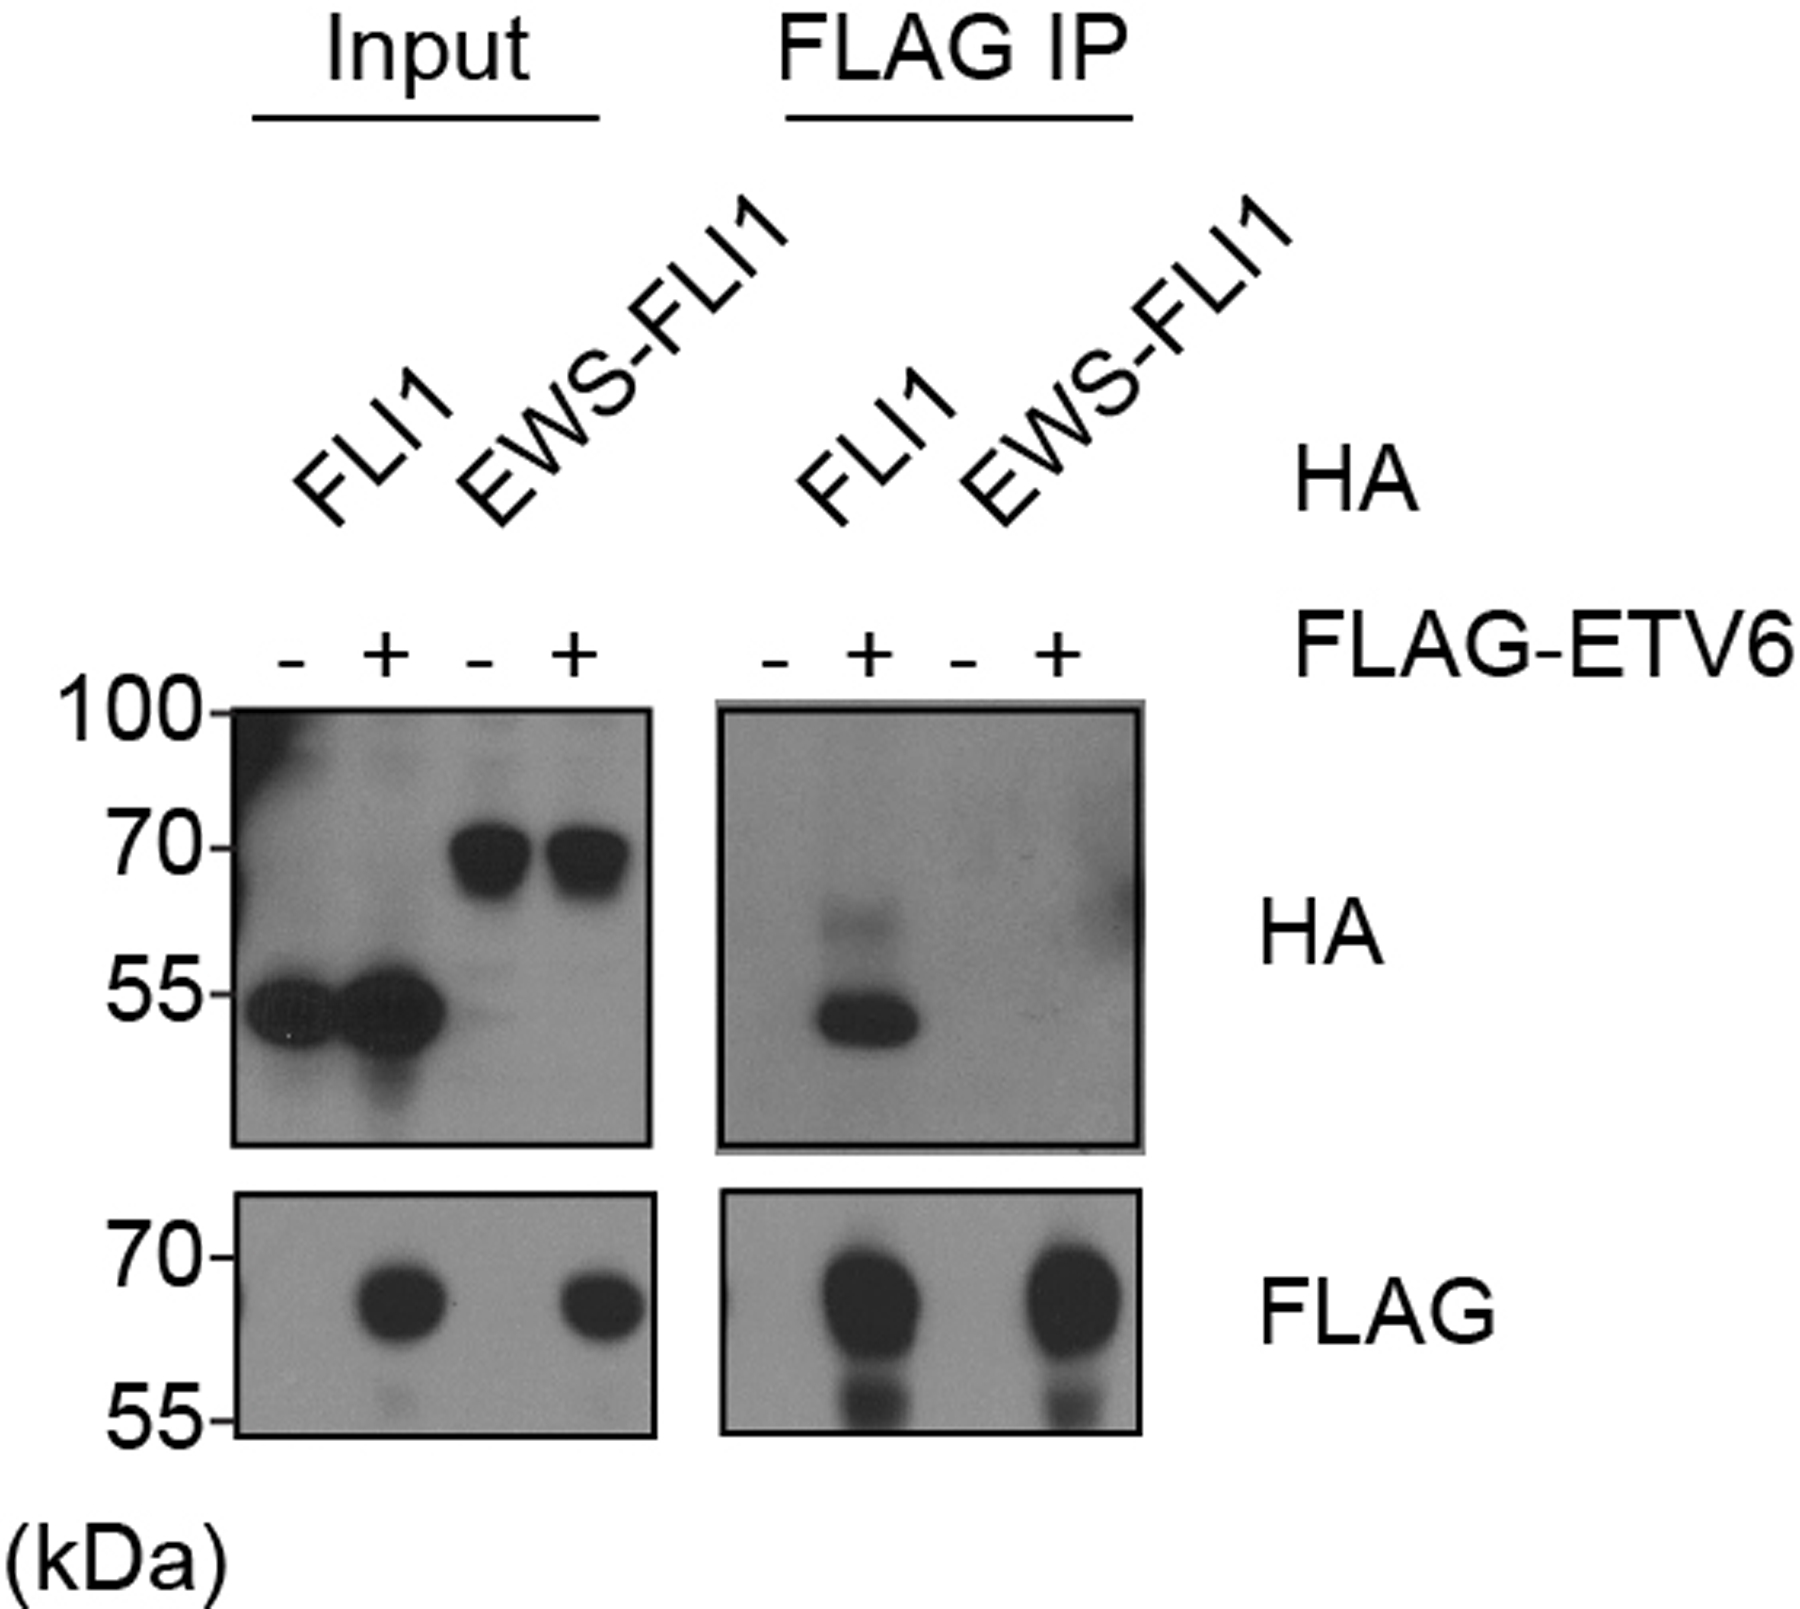
Immunoprecipitation assay showing ETV6 interacts with wild-type FLI1, but not EWS-FLI1 fusion. HEK293T cells were co-transfected with FLAG tagged ETV6 and HA tagged FLI1 or EWS-FLI1. FLAG IP was performed.
Extended Data Fig. 9 |. ETV6 oligomerization is essential in Ewing sarcoma.
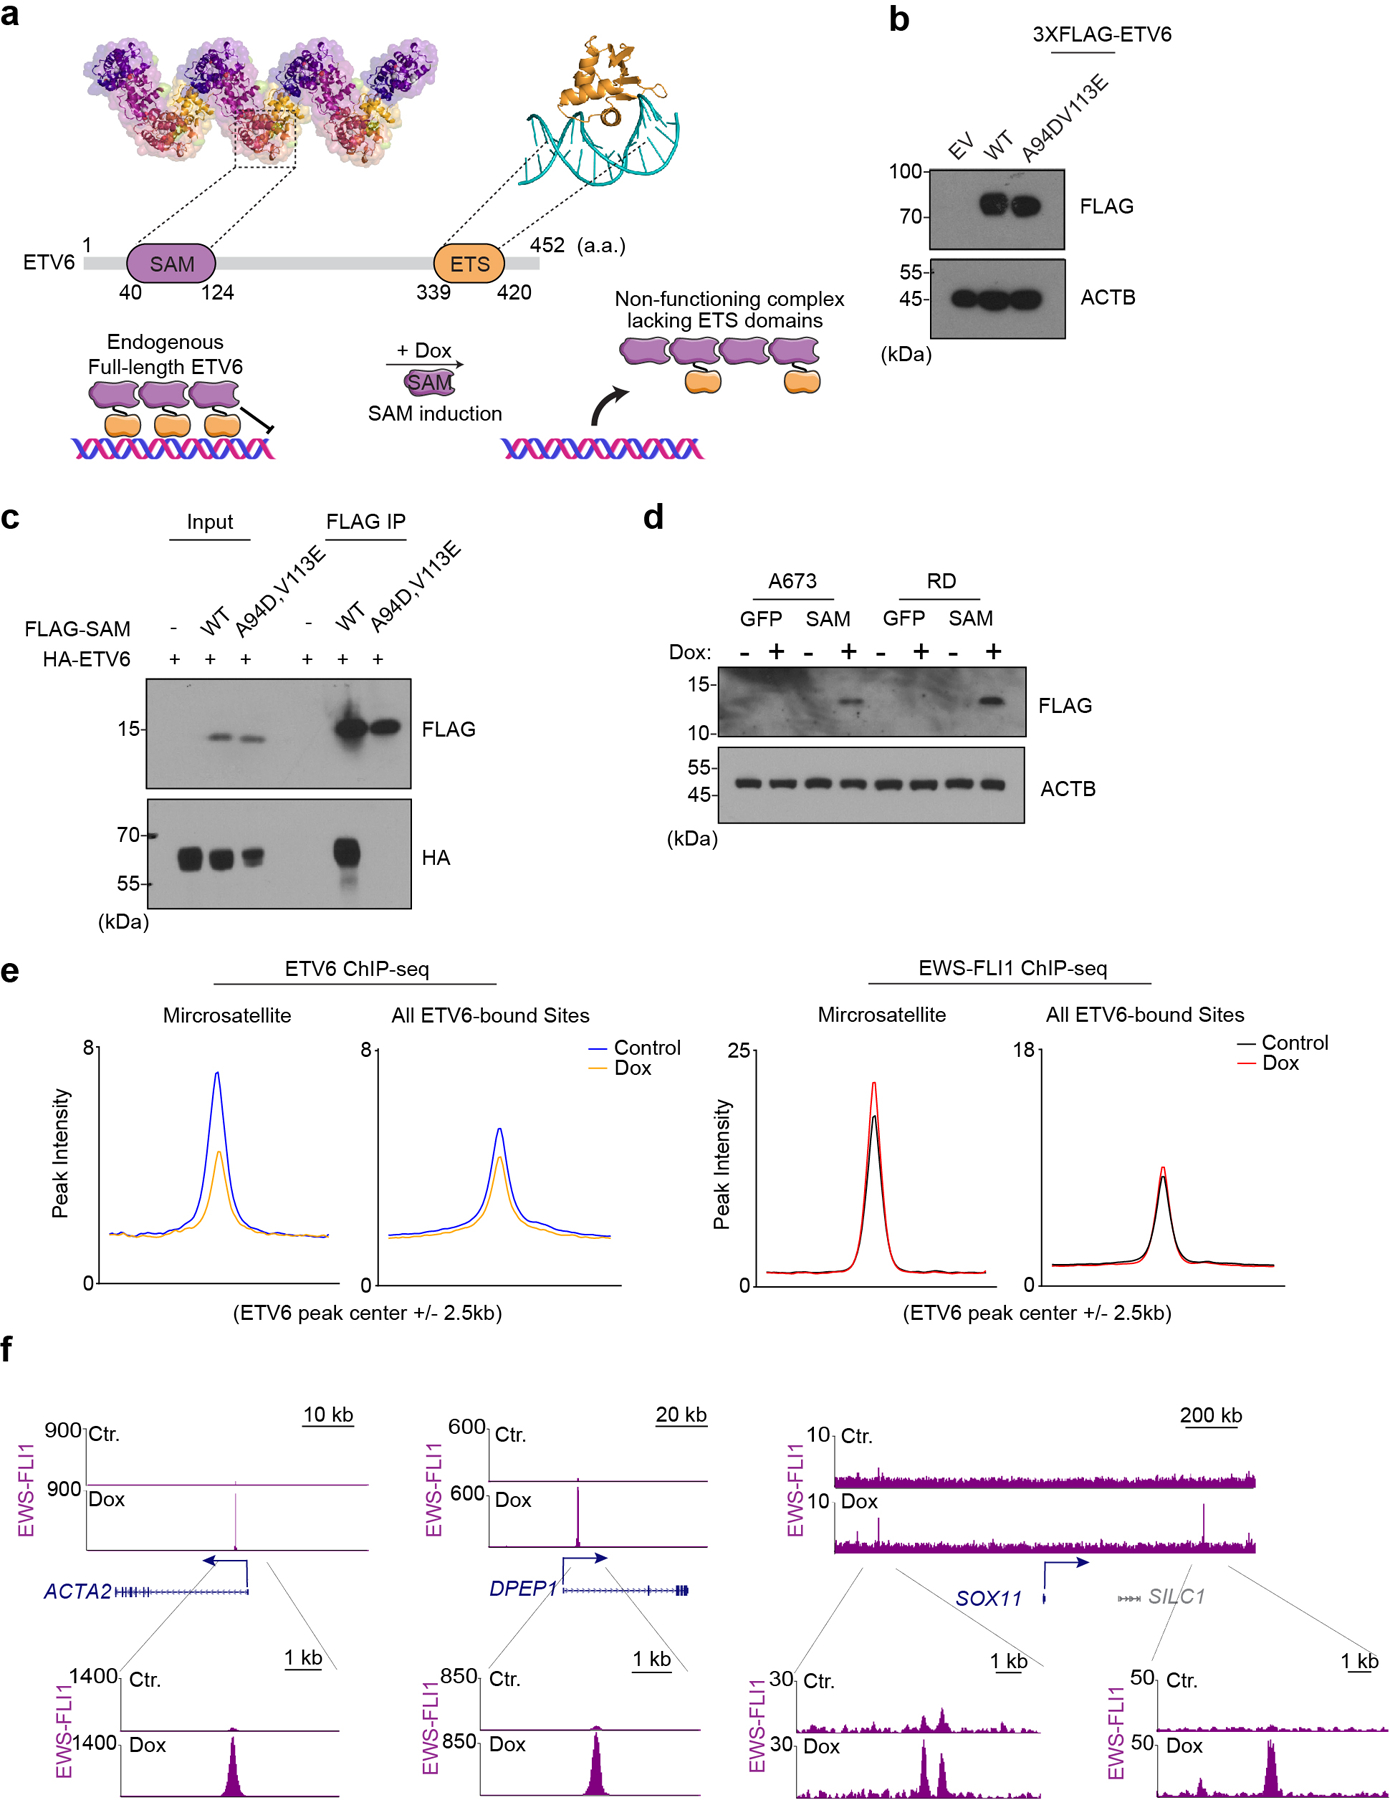
(a) Illustration of ETV6 domain structure and SAM induction altering endogenous ETV6 function. (a.a: amino acid) (b) Western blot of A673 cells transduced with EV (empty vector), 3×FLAG tagged sgRNA resistant wild-type or (A94D, V113E) mutant ETV6 cDNA. Beta-ACTIN was used as a loading control. (c) Immunoprecipitation assay showing wild-type, but not (A94D, V113E) mutant SAM domain is able to associate with full-length ETV6. HEK293T cells were co-transfected with HA tagged ETV6 and FLAG tagged wild-type or (A94D, V113E) mutant SAM domain. FLAG IP was performed. (d) Western blot of A673 and RD cells transduced with Dox-inducible GFP or FLAG tagged SAM fragment. The samples were collected 48 hours after control or doxycycline treatment (1 μg/mL). ACTB was used as a loading control. (e) Metagene representation of the mean ETV6 and EWS-FLI1 signal changes upon SAM induction across microsatellites and all ETV6 binding sites. (f) Gene tracks of EWS-FLI1 ChIP-seq occupancy upon doxycycline treatment at ACTA2, DPEP1 and SOX11 sites in two different scales.
Supplementary Material
Acknowledgements
This work was supported by Cold Spring Harbor Laboratory NCI Cancer Center Support grants P30-CA045508 and 5P01CA013106–49. Additional funding was provided to C.R.V. by the Pershing Square Sohn Cancer Research Alliance, National Institutes of Health grants CA013106 and CA245859, Friends of T.J. Foundation, Christina Renna Foundation, Michelle Paternoster Foundation, and the William J. Riley Foundation; to M.E. by the National Institutes of Health (NIH) (5R01CA237413). K.M.B. is supported by the NCI award (K08CA252178). L.J. is an investigator of the Howard Hughes Medical Institute. X.Y.H is supported by the 2021 AACR-AstraZeneca Breast Cancer Research Fellowship (grant number 21–40-12-HE).
Footnotes
Ethics declarations
Competing interests
C.R.V. has received consulting fees from Flare Therapeutics, Roivant Sciences and C4 Therapeutics; has served on the advisory boards of KSQ Therapeutics, Syros Pharmaceuticals and Treeline Biosciences; has received research funding from Boehringer-Ingelheim and Treeline Biosciences; and owns a stock option from Treeline Biosciences. M.E. is a member of the research advisory board for brensocatib for Insmed, Inc.; a member of the scientific advisory board for Vividion Therapeutics, Inc.; a consultant for Protalix, Inc.; and holds shares in Agios Pharmaceuticals, Inc.
Data availability
All the raw sequencing and related processed data are deposited in and publicly available from the GEO under the accession number GSE189418. These data include processed data such as peak region sets, ChIP signal and RNA-seq quantification. The cancer dependency dataset was obtained online (https://depmap.org/portal/download/, DepMap Public 21Q1). The Ewing sarcoma patient survival time and ETV6 expression level in the primary tumor were obtained from ICGC BOCA-FR dataset (https://dcc.icgc.org/projects/BOCA-FR, EXP-S). Numerical source data for Fig. 1–6, Extended Data Fig. 1-7 and Extended Data Fig.9 are provided along with the unprocessed images of immunoblots for Fig. 1, Fig. 5–6, Extended Data Fig.1 and Extended Data Fig.5-9 in the supplementary information.
References
- 1.Ewing J Diffuse endothelioma of bone. Ca Cancer J Clin 22, 95–98 (1972). [DOI] [PubMed] [Google Scholar]
- 2.Grünewald TGP et al. Ewing sarcoma. Nat Rev Dis Primers 4, 5 (2018). [DOI] [PubMed] [Google Scholar]
- 3.Stahl M et al. Risk of recurrence and survival after relapse in patients with Ewing sarcoma. Pediatr Blood Cancer 57, 549–553 (2011). [DOI] [PubMed] [Google Scholar]
- 4.Gaspar N et al. Ewing Sarcoma: Current Management and Future Approaches Through Collaboration. J Clin Oncol 33, 3036–3046 (2015). [DOI] [PubMed] [Google Scholar]
- 5.Zucman J et al. Cloning and characterization of the Ewing’s sarcoma and peripheral neuroepithelioma t(11;22) translocation breakpoints. Genes Chromosomes Cancer 5, 271–277 (1992). [DOI] [PubMed] [Google Scholar]
- 6.Delattre O et al. Gene fusion with an ETS DNA-binding domain caused by chromosome translocation in human tumours. Nature 359, 162–165 (1992). [DOI] [PubMed] [Google Scholar]
- 7.Wasylyk B, Hahn SL & Giovane A The Ets family of transcription factors. EJB Reviews 7–18 (1993) doi: 10.1007/978-3-642-78757-7_2. [DOI] [PubMed]
- 8.Wilson NK et al. Combinatorial Transcriptional Control In Blood Stem/Progenitor Cells: Genome-wide Analysis of Ten Major Transcriptional Regulators. Cell Stem Cell 7, 532–544 (2010). [DOI] [PubMed] [Google Scholar]
- 9.Wei G et al. Genome‐wide analysis of ETS‐family DNA‐binding in vitro and in vivo. Embo J 29, 2147–2160 (2010). [DOI] [PMC free article] [PubMed] [Google Scholar]
- 10.Riggi N et al. EWS-FLI1 Utilizes Divergent Chromatin Remodeling Mechanisms to Directly Activate or Repress Enhancer Elements in Ewing Sarcoma. Cancer Cell 26, 668–681 (2014). [DOI] [PMC free article] [PubMed] [Google Scholar]
- 11.Gangwal K & Lessnick SL Microsatellites are EWS/FLI response elements: Genomic “junk” is EWS/FLI’s treasure. Cell Cycle 7, 3127–3132 (2008). [DOI] [PubMed] [Google Scholar]
- 12.Gangwal K et al. Microsatellites as EWS/FLI response elements in Ewing’s sarcoma. Proc National Acad Sci 105, 10149–10154 (2008). [DOI] [PMC free article] [PubMed] [Google Scholar]
- 13.García-Aragoncillo E et al. DAX1, a direct target of EWS/FLI1 oncoprotein, is a principal regulator of cell-cycle progression in Ewing’s tumor cells. Oncogene 27, 6034–6043 (2008). [DOI] [PubMed] [Google Scholar]
- 14.Guillon N et al. The Oncogenic EWS-FLI1 Protein Binds In Vivo GGAA Microsatellite Sequences with Potential Transcriptional Activation Function. Plos One 4, e4932 (2009). [DOI] [PMC free article] [PubMed] [Google Scholar]
- 15.Boulay G et al. Cancer-Specific Retargeting of BAF Complexes by a Prion-like Domain. Cell 171, 163–178.e19 (2017). [DOI] [PMC free article] [PubMed] [Google Scholar]
- 16.Gangwal K, Close D, Enriquez CA, Hill CP & Lessnick SL Emergent Properties of EWS/FLI Regulation via GGAA Microsatellites in Ewing’s Sarcoma. Genes Cancer 1, 177–187 (2010). [DOI] [PMC free article] [PubMed] [Google Scholar]
- 17.Patel M et al. Tumor-specific retargeting of an oncogenic transcription factor chimera results in dysregulation of chromatin and transcription. Genome Res 22, 259–270 (2012). [DOI] [PMC free article] [PubMed] [Google Scholar]
- 18.Johnson KM, Taslim C, Saund RS & Lessnick SL Identification of two types of GGAA-microsatellites and their roles in EWS/FLI binding and gene regulation in Ewing sarcoma. Plos One 12, e0186275 (2017). [DOI] [PMC free article] [PubMed] [Google Scholar]
- 19.Ramakrishnan R et al. Role of protein–protein interactions in the antiapoptotic function of EWS-Fli-1. Oncogene 23, 7087–7094 (2004). [DOI] [PubMed] [Google Scholar]
- 20.Nakatani F et al. Identification of p21 WAF1/CIP1 as a Direct Target of EWS-Fli1 Oncogenic Fusion Protein*. J Biol Chem 278, 15105–15115 (2003). [DOI] [PubMed] [Google Scholar]
- 21.Torchia EC, Jaishankar S & Baker SJ Ewing tumor fusion proteins block the differentiation of pluripotent marrow stromal cells. Cancer Res 63, 3464–8 (2003). [PubMed] [Google Scholar]
- 22.Tirode F et al. Mesenchymal Stem Cell Features of Ewing Tumors. Cancer Cell 11, 421–429 (2007). [DOI] [PubMed] [Google Scholar]
- 23.Lopez RG et al. TEL Is a Sequence-specific Transcriptional Repressor*. J Biol Chem 274, 30132–30138 (1999). [DOI] [PubMed] [Google Scholar]
- 24.Poirel H et al. The TEL gene products: nuclear phosphoproteins with DNA binding properties. Oncogene 14, 349–357 (1997). [DOI] [PubMed] [Google Scholar]
- 25.Kim CA et al. Polymerization of the SAM domain of TEL in leukemogenesis and transcriptional repression. Embo J 20, 4173–4182 (2001). [DOI] [PMC free article] [PubMed] [Google Scholar]
- 26.Green SM, Coyne HJ, McIntosh LP & Graves BJ DNA Binding by the ETS Protein TEL (ETV6) Is Regulated by Autoinhibition and Self-association*. J Biol Chem 285, 18496–18504 (2010). [DOI] [PMC free article] [PubMed] [Google Scholar]
- 27.Wang LC et al. Yolk sac angiogenic defect and intra‐embryonic apoptosis in mice lacking the Ets‐related factor TEL. Embo J 16, 4374–4383 (1997). [DOI] [PMC free article] [PubMed] [Google Scholar]
- 28.Wang LC et al. The TEL/ETV6 gene is required specifically for hematopoiesis in the bone marrow. Gene Dev 12, 2392–2402 (1998). [DOI] [PMC free article] [PubMed] [Google Scholar]
- 29.Feurstein S & Godley LA Germline ETV6 mutations and predisposition to hematological malignancies. Int J Hematol 106, 189–195 (2017). [DOI] [PubMed] [Google Scholar]
- 30.Biswas A, Rajesh Y, Mitra P & Mandal M ETV6 gene aberrations in non-haematological malignancies: A review highlighting ETV6 associated fusion genes in solid tumors. Biochimica Et Biophysica Acta Bba - Rev Cancer 1874, 188389 (2020). [DOI] [PubMed] [Google Scholar]
- 31.Braekeleer ED et al. ETV6 fusion genes in hematological malignancies: A review. Leukemia Res 36, 945–961 (2012). [DOI] [PubMed] [Google Scholar]
- 32.Lu B et al. A Transcription Factor Addiction in Leukemia Imposed by the MLL Promoter Sequence. Cancer Cell 34, 970–981.e8 (2018). [DOI] [PMC free article] [PubMed] [Google Scholar]
- 33.Huang Y-H et al. POU2F3 is a master regulator of a tuft cell-like variant of small cell lung cancer. Gene Dev 32, 915–928 (2018). [DOI] [PMC free article] [PubMed] [Google Scholar]
- 34.Gryder BE et al. Histone hyperacetylation disrupts core gene regulatory architecture in rhabdomyosarcoma. Nat Genet 51, 1714–1722 (2019). [DOI] [PMC free article] [PubMed] [Google Scholar]
- 35.Dempster JM et al. Extracting Biological Insights from the Project Achilles Genome-Scale CRISPR Screens in Cancer Cell Lines. Biorxiv 720243 (2019) doi: 10.1101/720243. [DOI] [Google Scholar]
- 36.Meyers RM et al. Computational correction of copy number effect improves specificity of CRISPR–Cas9 essentiality screens in cancer cells. Nat Genet 49, 1779–1784 (2017). [DOI] [PMC free article] [PubMed] [Google Scholar]
- 37.Tamir A et al. Fli-1, an Ets-Related Transcription Factor, Regulates Erythropoietin-Induced Erythroid Proliferation and Differentiation: Evidence for Direct Transcriptional Repression of the Rb Gene during Differentiation. Mol Cell Biol 19, 4452–4464 (1999). [DOI] [PMC free article] [PubMed] [Google Scholar]
- 38.Pereira R et al. FLI-1 inhibits differentiation and induces proliferation of primary erythroblasts. Oncogene 18, 1597–1608 (1999). [DOI] [PubMed] [Google Scholar]
- 39.Athanasiou M, Mavrothalassitis G, Sun-Hoffman L & Blair D FLI-1 is a suppressor of erythroid differentiation in human hematopoietic cells. Leukemia 14, 439–445 (2000). [DOI] [PubMed] [Google Scholar]
- 40.Potikyan G et al. Genetically defined EWS/FLI1 model system suggests mesenchymal origin of Ewing’s family tumors. Lab Invest 88, 1291–1302 (2008). [DOI] [PubMed] [Google Scholar]
- 41.Eliazer S, Spencer J, Ye D, Olson E & Ilaria RL Alteration of Mesodermal Cell Differentiation by EWS/FLI-1, the Oncogene Implicated in Ewing’s Sarcoma. Mol Cell Biol 23, 482–492 (2003). [DOI] [PMC free article] [PubMed] [Google Scholar]
- 42.Chia W, Liu J, Huang Y-G & Zhang C A circular RNA derived from DAB1 promotes cell proliferation and osteogenic differentiation of BMSCs via RBPJ/DAB1 axis. Cell Death Dis 11, 372 (2020). [DOI] [PMC free article] [PubMed] [Google Scholar]
- 43.Franzetti G-A et al. Cell-to-cell heterogeneity of EWSR1-FLI1 activity determines proliferation/migration choices in Ewing sarcoma cells. Oncogene 36, 3505–3514 (2017). [DOI] [PMC free article] [PubMed] [Google Scholar]
- 44.Chaturvedi A, Hoffman LM, Welm AL, Lessnick SL & Beckerle MC The EWS/FLI Oncogene Drives Changes in Cellular Morphology, Adhesion, and Migration in Ewing Sarcoma. Genes Cancer 3, 102–116 (2012). [DOI] [PMC free article] [PubMed] [Google Scholar]
- 45.Hu-Lieskovan S et al. EWS-FLI1 Fusion Protein Up-regulates Critical Genes in Neural Crest Development and Is Responsible for the Observed Phenotype of Ewing’s Family of Tumors. Cancer Res 65, 4633–4644 (2005). [DOI] [PubMed] [Google Scholar]
- 46.Kwiatkowski BA et al. The ets Family Member Tel Binds to the Fli-1 Oncoprotein and Inhibits Its Transcriptional Activity*. J Biol Chem 273, 17525–17530 (1998). [DOI] [PubMed] [Google Scholar]
- 47.Gill G & Ptashne M Negative effect of the transcriptional activator GAL4. Nature 334, 721–724 (1988). [DOI] [PubMed] [Google Scholar]
- 48.Sizemore GM, Pitarresi JR, Balakrishnan S & Ostrowski MC The ETS family of oncogenic transcription factors in solid tumours. Nat Rev Cancer 17, 337–351 (2017). [DOI] [PubMed] [Google Scholar]
- 49.Karim FD et al. The ETS-domain: a new DNA-binding motif that recognizes a purine-rich core DNA sequence. Gene Dev 4, 1451–1453 (1990). [DOI] [PubMed] [Google Scholar]
- 50.Nye JA, Petersen JM, Gunther CV, Jonsen MD & Graves BJ Interaction of murine ets-1 with GGA-binding sites establishes the ETS domain as a new DNA-binding motif. Gene Dev 6, 975–990 (1992). [DOI] [PubMed] [Google Scholar]
- 51.Kruse EA et al. Dual requirement for the ETS transcription factors Fli-1 and Erg in hematopoietic stem cells and the megakaryocyte lineage. Proc National Acad Sci 106, 13814–13819 (2009). [DOI] [PMC free article] [PubMed] [Google Scholar]
- 52.Kwiatkowski BA, Zielinska-Kwiatkowska AG, Bauer TR & Hickstein DD The ETS Family Member Tel Antagonizes the Fli-1 Phenotype in Hematopoietic Cells. Blood Cells Mol Dis 26, 84–90 (2000). [DOI] [PubMed] [Google Scholar]
- 53.Bose R et al. ERF mutations reveal a balance of ETS factors controlling prostate oncogenesis. Nature 546, 671–675 (2017). [DOI] [PMC free article] [PubMed] [Google Scholar]
- 54.Adane B et al. STAG2 loss rewires oncogenic and developmental programs to promote metastasis in Ewing sarcoma. Cancer Cell 39, 827–844.e10 (2021). [DOI] [PMC free article] [PubMed] [Google Scholar]
- 55.Crompton BD et al. The Genomic Landscape of Pediatric Ewing Sarcoma. Cancer Discov 4, 1326–1341 (2014). [DOI] [PubMed] [Google Scholar]
- 56.Eckert KA & Hile SE Every microsatellite is different: Intrinsic DNA features dictate mutagenesis of common microsatellites present in the human genome. Mol Carcinogen 48, 379–388 (2009). [DOI] [PMC free article] [PubMed] [Google Scholar]
- 57.Jawad MU et al. Ewing sarcoma demonstrates racial disparities in incidence‐related and sex‐related differences in outcome. Cancer 115, 3526–3536 (2009). [DOI] [PubMed] [Google Scholar]
- 58.Monument MJ et al. Clinical and Biochemical Function of Polymorphic NR0B1 GGAA-Microsatellites in Ewing Sarcoma: A Report from the Children’s Oncology Group. Plos One 9, e104378 (2014). [DOI] [PMC free article] [PubMed] [Google Scholar]
- 59.Monument MJ et al. Microsatellites with Macro-Influence in Ewing Sarcoma. Genes-basel 3, 444–460 (2012). [DOI] [PMC free article] [PubMed] [Google Scholar]
- 60.Maurer LM et al. BRCA1-Associated RING Domain-1 (BARD1) Loss and GBP1 Expression Enhance Sensitivity to DNA Damage in Ewing Sarcoma. Cancer Res Commun 2, 220–232 (2022). [DOI] [PMC free article] [PubMed] [Google Scholar]
- 61.Tarumoto Y et al. LKB1, Salt-Inducible Kinases, and MEF2C Are Linked Dependencies in Acute Myeloid Leukemia. Mol Cell 69, 1017–1027.e6 (2018). [DOI] [PMC free article] [PubMed] [Google Scholar]
- 62.Dobin A et al. STAR: ultrafast universal RNA-seq aligner. Bioinformatics 29, 15–21 (2013). [DOI] [PMC free article] [PubMed] [Google Scholar]
- 63.Liao Y, Smyth GK & Shi W featureCounts: an efficient general purpose program for assigning sequence reads to genomic features. Bioinformatics 30, 923–930 (2014). [DOI] [PubMed] [Google Scholar]
- 64.Love MI, Huber W & Anders S Moderated estimation of fold change and dispersion for RNA-seq data with DESeq2. Genome Biol 15, 550 (2014). [DOI] [PMC free article] [PubMed] [Google Scholar]
- 65.Langmead B & Salzberg SL Fast gapped-read alignment with Bowtie 2. Nat Methods 9, 357–359 (2012). [DOI] [PMC free article] [PubMed] [Google Scholar]
- 66.Langmead B, Trapnell C, Pop M & Salzberg SL Ultrafast and memory-efficient alignment of short DNA sequences to the human genome. Genome Biol 10, R25 (2009). [DOI] [PMC free article] [PubMed] [Google Scholar]
- 67.Li H et al. The Sequence Alignment/Map format and SAMtools. Bioinformatics 25, 2078–2079 (2009). [DOI] [PMC free article] [PubMed] [Google Scholar]
- 68.Feng J, Liu T, Qin B, Zhang Y & Liu XS Identifying ChIP-seq enrichment using MACS. Nat Protoc 7, 1728–1740 (2012). [DOI] [PMC free article] [PubMed] [Google Scholar]
- 69.Zhang Y et al. Model-based Analysis of ChIP-Seq (MACS). Genome Biol 9, R137 (2008). [DOI] [PMC free article] [PubMed] [Google Scholar]
- 70.Ramírez F et al. deepTools2: a next generation web server for deep-sequencing data analysis. Nucleic Acids Res 44, W160–W165 (2016). [DOI] [PMC free article] [PubMed] [Google Scholar]
- 71.Quinlan AR & Hall IM BEDTools: a flexible suite of utilities for comparing genomic features. Bioinformatics 26, 841–842 (2010). [DOI] [PMC free article] [PubMed] [Google Scholar]
- 72.Heinz S et al. Simple Combinations of Lineage-Determining Transcription Factors Prime cis-Regulatory Elements Required for Macrophage and B Cell Identities. Mol Cell 38, 576–589 (2010). [DOI] [PMC free article] [PubMed] [Google Scholar]
- 73.Schrödinger L The PyMOL Molecular Graphics System, Version 2.0 (2019).
- 74.Tran HH, Kim CA, Faham S, Siddall M-C & Bowie JU Native interface of the SAM domain polymer of TEL. Bmc Struct Biol 2, 5 (2002). [DOI] [PMC free article] [PubMed] [Google Scholar]
- 75.De S et al. Steric Mechanism of Auto-Inhibitory Regulation of Specific and Non-Specific DNA Binding by the ETS Transcriptional Repressor ETV6. J Mol Biol 426, 1390–1406 (2014). [DOI] [PMC free article] [PubMed] [Google Scholar]
Associated Data
This section collects any data citations, data availability statements, or supplementary materials included in this article.
Supplementary Materials
Data Availability Statement
All the raw sequencing and related processed data are deposited in and publicly available from the GEO under the accession number GSE189418. These data include processed data such as peak region sets, ChIP signal and RNA-seq quantification. The cancer dependency dataset was obtained online (https://depmap.org/portal/download/, DepMap Public 21Q1). The Ewing sarcoma patient survival time and ETV6 expression level in the primary tumor were obtained from ICGC BOCA-FR dataset (https://dcc.icgc.org/projects/BOCA-FR, EXP-S). Numerical source data for Fig. 1–6, Extended Data Fig. 1-7 and Extended Data Fig.9 are provided along with the unprocessed images of immunoblots for Fig. 1, Fig. 5–6, Extended Data Fig.1 and Extended Data Fig.5-9 in the supplementary information.


