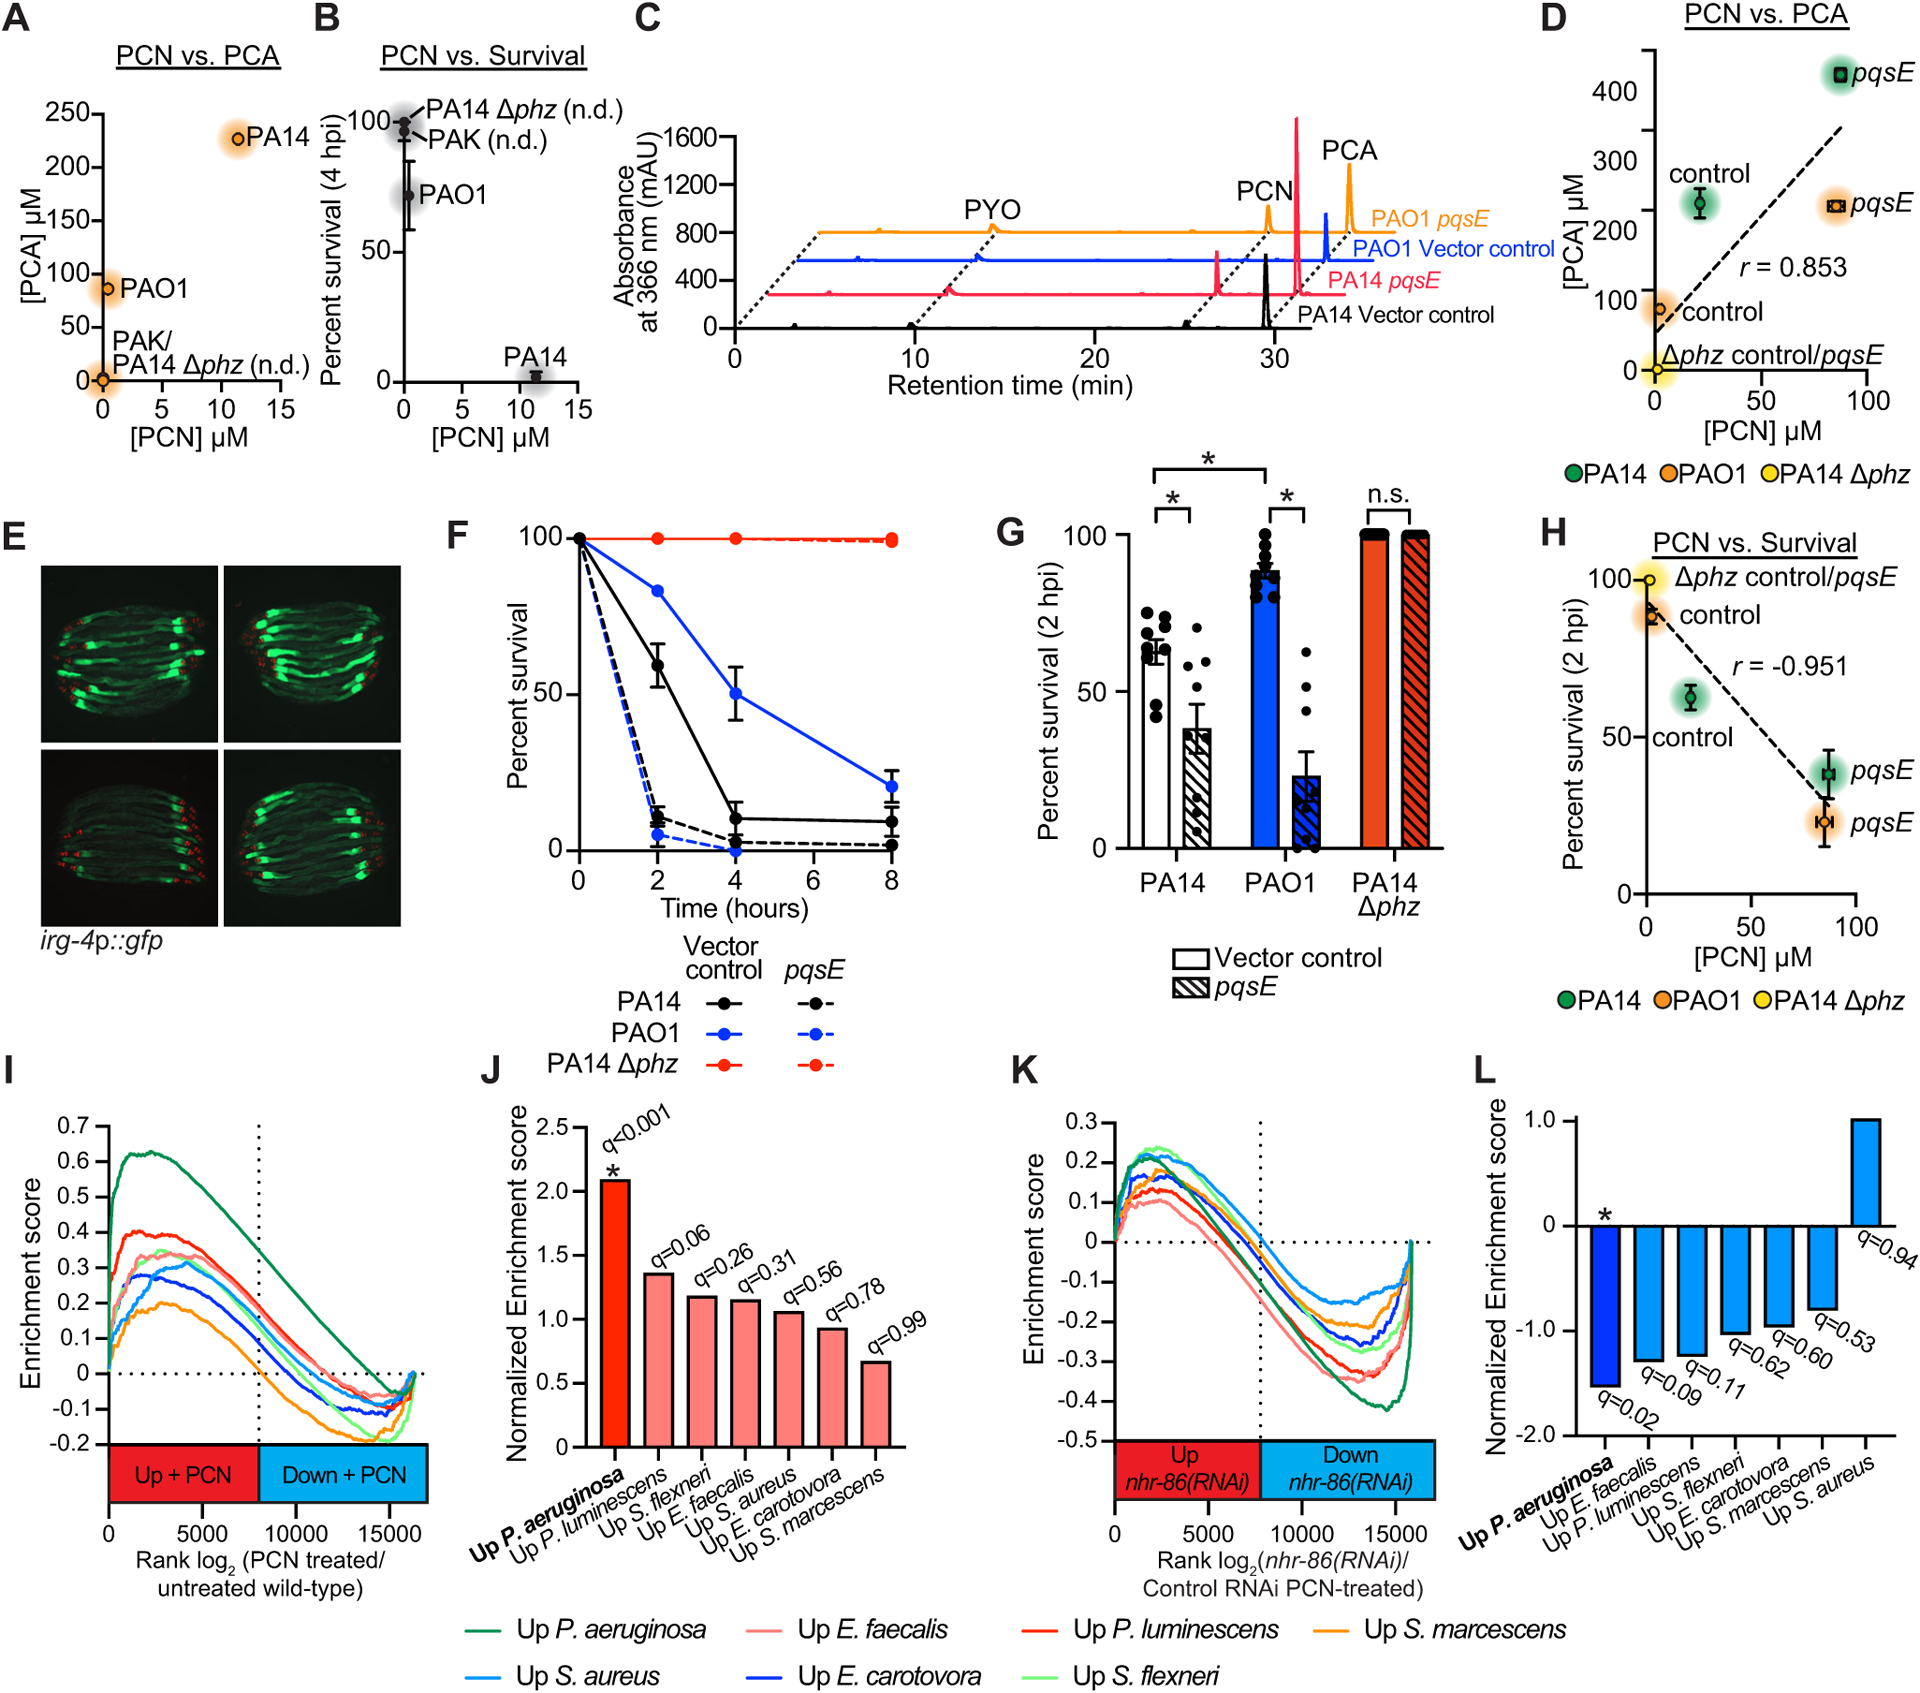
Figure 6. C. elegans sense PCN to assess the relative threat of virulent P. aeruginosa, but not other pathogenic bacteria.

(A-C) HPLC-UV spectroscopy was used to quantify the individual phenazines in the indicated P. aeruginosa strains. (A) PCN production was compared to PCA production in biological replicates of the indicated P. aeruginosa strains (n=3). See Fig. S6 for the comparison of PCN production with 1-HP (Fig. S6A) and PYO (Fig. S6B) in these strains. (B) PCN production was compared to the pathogenicity of P. aeruginosa towards C. elegans in the phenazine toxicity assay, as quantified by percent nematode survival at four hours. n.d.=PCN was not detected. (C) Liquid chromatography-UV chromatograms of P. aeruginosa PA14 or PAO1 strains that express pqsE in multicopy (pqsE) or a control plasmid (vector control). See Fig. S6 for a comparison of PCA (Fig. S6D) and PCN (Fig. S6E) production in these strains. (D) HPLC-UV spectroscopy data showing the comparison of PCN production versus PCA production in biological replicates of the indicated P. aeruginosa strains. Pearson correlation coefficient (r) is significant (p<0.05, n=3). (E) Images of C. elegans irg-4p∷gfp animals infected with the indicated P. aeruginosa strains, (scale bar, 200 μM). (F) Phenazine toxicity assay with wild-type C. elegans and indicated P. aeruginosa strains. The difference between the PAO1 control vector and pqsE overexpression is significant (p<0.05, log-rank test, n=3). Data is representative of three biological replicates. (G) Survival data at two hours for strains of the indicated genotypes is shown for the experiment described (F). Data are the average of three biologicals replicates each containing three trials with error bars showing SEM (n=9). *equals p<0.05 (two-way ANOVA with Tukey’s multiple comparisons test). Sample sizes, two-hour survival, and p-values for each replicate are shown in Table S2. (H) Comparison of PCN production in the indicated P. aeruginosa genotypes with their pathogenicity toward C. elegans in the phenazine toxicity assay is presented. Pearson correlation coefficient (r) from biological replicates is significant (p<0.05, n=3). See also Table S3 for the HPLC-UV and LC-MS/MS phenazine retention times and abundance for the data shown in (A-D) and (H). (I) Gene set enrichment analysis (GSEA) examining the genes that are differentially regulated in wild-type C. elegans exposed to PCN, as determined by mRNA-seq (See Fig. 1H). Fold change in expression of genes in uninfected animals exposed to PCN are presented in rank order on the x-axis from higher expression (red) to lower expression (blue) and compared to the genes that are induced upon exposure to the indicated pathogens. (J) GSEA normalized enrichment score (NES) and q-value for the comparisons shown in (I). Only the comparison of genes whose transcription changes in the presence of PCN and during P. aeruginosa infection was significant (q<0.05). (K) A similar GSEA as described in (I) except genes whose transcription depend on nhr-86 during PCN treatment (See Fig. 2L) are compared to genes induced upon exposure to the indicated pathogens. (L) GSEA normalized enrichment score (NES) and q-value for the experiment described in (K) are shown. As in (J), only the comparison with genes induced during P. aeruginosa infection was significant (q<0.05). Source data for this figure is in Table S3. See also Fig. S6.
